

Holocene El Niño-Southern Oscillation variability reflected in subtropical Australian precipitation
- PMID: 30733569
- PMCID: PMC6367503
- DOI: 10.1038/s41598-019-38626-3
Holocene El Niño-Southern Oscillation variability reflected in subtropical Australian precipitation
Erratum in
-
Author Correction: Holocene El Niño-Southern Oscillation variability reflected in subtropical Australian precipitation.Sci Rep. 2021 Apr 1;11(1):7634. doi: 10.1038/s41598-021-86998-2. Sci Rep. 2021. PMID: 33795814 Free PMC article. No abstract available.
Abstract
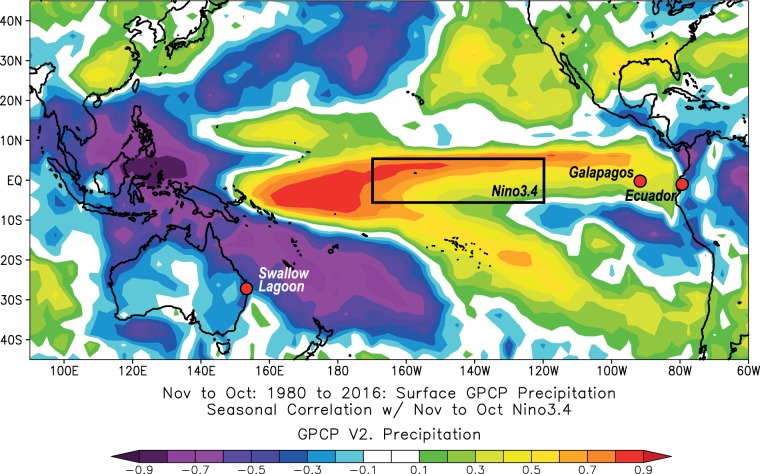
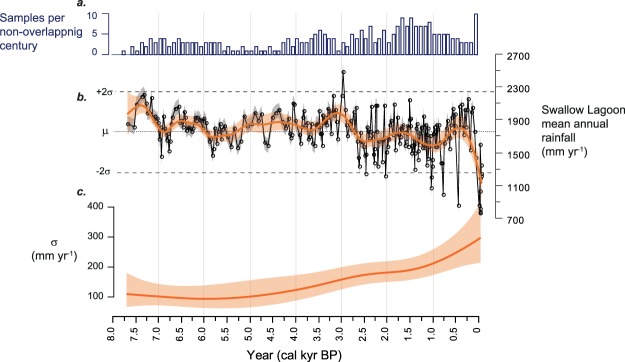
The La Niña and El Niño phases of the El Niño-Southern Oscillation (ENSO) have major impacts on regional rainfall patterns around the globe, with substantial environmental, societal and economic implications. Long-term perspectives on ENSO behaviour, under changing background conditions, are essential to anticipating how ENSO phases may respond under future climate scenarios. Here, we derive a 7700-year, quantitative precipitation record using carbon isotope ratios from a single species of leaf preserved in lake sediments from subtropical eastern Australia. We find a generally wet (more La Niña-like) mid-Holocene that shifted towards drier and more variable climates after 3200 cal. yr BP, primarily driven by increasing frequency and strength of the El Niño phase. Climate model simulations implicate a progressive orbitally-driven weakening of the Pacific Walker Circulation as contributing to this change. At centennial scales, high rainfall characterised the Little Ice Age (~1450-1850 CE) in subtropical eastern Australia, contrasting with oceanic proxies that suggest El Niño-like conditions prevail during this period. Our data provide a new western Pacific perspective on Holocene ENSO variability and highlight the need to address ENSO reconstruction with a geographically diverse network of sites to characterise how both ENSO, and its impacts, vary in a changing climate.
Conflict of interest statement
The authors declare no competing interests.
Figures

References
-
- Dai A, Wigley TML. Global patterns of ENSO-induced precipitation. Geophysical Research Letters. 2000;27:1283–1286. doi: 10.1029/1999GL011140. - DOI
-
- Boening, C., Willis, J. K., Landerer, F. W., Nerem, R. S. & Fasullo, J. The 2011 La Niña: So strong, the oceans fell. Geophysical Research Letters39, 10.1029/2012gl053055 (2012).
Publication types
LinkOut - more resources
Full Text Sources
