. 2019 Feb 7;9(1):1584.
doi: 10.1038/s41598-019-38505-x.

Normalization strategies differently affect circulating miRNA profile associated with the training status

Affiliations

Normalization strategies differently affect circulating miRNA profile associated with the training status

Martina Faraldi et al. Sci Rep. .

Abstract

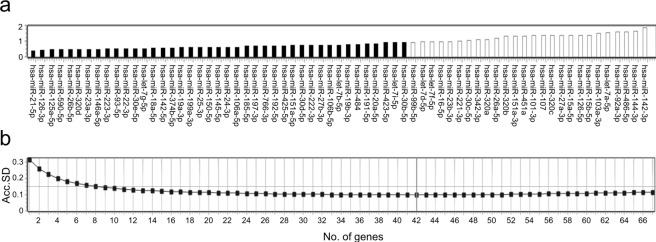
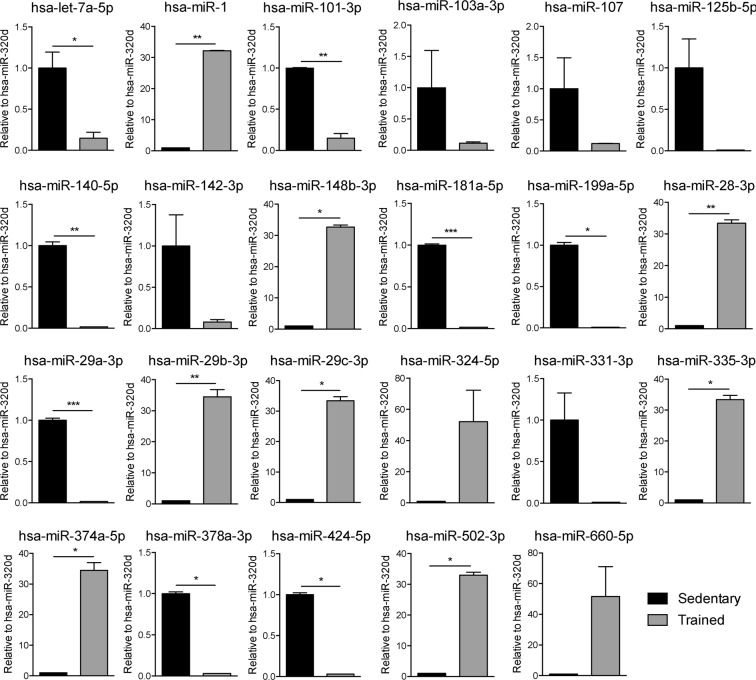
MicroRNAs are fine regulators of the whole-body adaptive response but their use as biomarkers is limited by the lack of standardized pre- and post-analytical procedures. This work aimed to compare different normalization approaches for RT-qPCR data analyses, in order to identify the most reliable and reproducible method to analyze circulating miRNA expression profiles in sedentary and highly-trained subjects. As the physically active status is known to affect miRNA expression, they could be effective biomarkers of the homeostatic response. Following RNA extraction from plasma, a panel of 179 miRNAs was assayed by RT-qPCR and quantified by applying different normalization strategies based on endogenous miRNAs and exogenous oligonucleotides. hsa-miR-320d was found as the most appropriate reference miRNA in reducing the technical variability among the experimental replicates and, hence, in highlighting the inter-cohorts differences. Our data showed an association between the physically active status and specific skeletal muscle- and bone-associated circulating miRNAs profiles, revealing that established epigenetic modifications affect the baseline physiological status of these tissues. Since different normalization strategies led to different outputs, in order to avoid misleading interpretation of data, we remark the importance of the accurate choice of the most reliable normalization method in every experimental setting.


Conflict of interest statement

The authors declare no competing interests.

Figures

Figure 1
Figure 1
Analyses on endogenous miRNAs. (a) Arbitrary stability value of 67 miRNAs selected by NormFinder. miRNAs are ranked as stable (black) and unstable (white). (b) Acc.SD of 67 miRNAs selected by NormFinder. The lowest Acc.SD. value indicates the optimal number of reference genes. Expression stability analysis was performed comparing free-circulating miRNAs from sedentary and trained subjects.
Figure 2
Figure 2
Coefficient of variation analyses after normalization on endogenous miRNAs. (a) Coefficient of variation (CV%) of all analyzed miRNAs normalized on global mean, mean-endo, 8 most stable miRNAs, singularly (hsa-miR-21-5p, hsa-miR-126-3p, hsa-miR-125a-5p, hsa-miR-590-5p, hsa-miR-26b-5p, hsa-miR-320d, hsa-miR-23a-3p, and hsa-miR-146a-5p) and 3 less stable miRNAs, singularly (hsa-miR-486, hsa-miR-144-3p, hsa-miR-142-3p). The lowest CV% indicates the most suitable method. (b) Frequency distribution of CV% of all analyzed miRNAs normalized as in (a). The median CV% distribution is indicated for each graph.
Figure 3
Figure 3
Analyses on exogenous oligonucleotide. (a) Arbitrary stability value and Acc.SD. of exogenous oligonucleotide (cel-39, UniSp2, UniSp4 and UniSp6) calculated by NormFinder. Spike-ins are ranked as stable (black) and unstable (white). The analysis of the expression stability was performed comparing free-circulating miRNAs from sedentary and trained subjects. (b) CV% of all analyzed miRNAs normalized on mean-spike-in (average of cel-39, UniSp2 and UniSp4) and on cel-39, UniSp2, UniSp4 and UniSp6, singularly. (c) Percentage of the frequency distribution of CV of all analyzed miRNAs normalized as in (b). Median of the CV% distribution is indicated for each graph.
Figure 4
Figure 4
Expression profile of miRNAs of sedentary and trained subjects after normalization on global mean, mean-endo, hsa-miR-21a-5p, hsa-miR-320d, mean-spike-in and cel-39. Expression profile of representative miRNAs selected as >20% up- or down-regulated in plasma of trained subject compared to sedentary subjects (hsa-let-7c-5p, hsa-miR-28-5p, hsa-miR-32-5p, hsa-miR-146b-5p, hsa-miR-324-3p, hsa-miR-363-3p, and miR-532-5p) Statistical analysis was performed with Prism® v6.01 (GraphPad Software). All data are expressed as mean ± SEM and data were compared throughout unpaired t-test with Welch’s correction. The differences were considered significant when p value < 0.05 (*p < 0.05, **p < 0.01).
Figure 5
Figure 5
Expression profile of miRNAs of sedentary and trained subjects associated to skeletal muscle and bone. Expression profile of miRNAs from sedentary and trained subjects which function is associated to skeletal muscle and bone (hsa-let-7a-5p, hsa-miR-1, hsa-miR-101-3p, hsa-miR-103a-3p, hsa-miR-107, hsa-miR-125b-5p, hsa-miR-140-5p, hsa-miR-142-3p, hsa-miR-148b-5p, hsa-miR-181a-5p, hsa-miR-199a-5p, hsa-miR-28-3p, hsa-miR-29a-3p, and hsa-miR-29b/c-3p, hsa-miR-324-5p, hsa-miR-331-3p, hsa-miR-335-5p, hsa-miR-374a-5p, hsa-miR-378-3p, miR-424-5p, hsa-miR-502-3p, and hsa-miR-660-5p). Statistical analysis was performed with Prism® v6.01 (GraphPad Software). All data are expressed as mean ± SEM and data were compared throughout unpaired t-test with Welch’s correction. The differences were considered significant when p value < 0.05 (*p < 0.05, **p < 0.01, ***p < 0.001).

References

    1. Ha M, Kim VN. Regulation of microRNA biogenesis. Nat. Rev. Mo.l Cell. Biol. 2014;15:509–524. doi: 10.1038/nrm3838. - DOI - PubMed
    1. Tomaselli S, Panera N, Gallo A, Alisi A. Circulating miRNA profiling to identify biomarkers of dysmetabolism. Biomark. Med. 2012;6:729–742. doi: 10.2217/bmm.12.91. - DOI - PubMed
    1. Wang J, Chen J, Sen S. MicroRNA as Biomarkers and Diagnostics. J. Cell. Physiol. 2016;231:25–30. doi: 10.1002/jcp.25056. - DOI - PMC - PubMed
    1. Chen Y, Gelfond JA, McManus LM, Shireman PK. Reproducibility of quantitative RT-PCR array in miRNA expression profiling and comparison with microarray analysis. BMC genomics. 2009;10:407. doi: 10.1186/1471-2164-10-407. - DOI - PMC - PubMed
    1. Marabita F, et al. Normalization of circulating microRNA expression data obtained by quantitative real-time RT-PCR. Brief. Bioinform. 2016;17:204–212. doi: 10.1093/bib/bbv056. - DOI - PMC - PubMed

Publication types