. 2019 Jan 24:13:2.
doi: 10.3389/fnins.2019.00002. eCollection 2019.

A Microglial Signature Directing Human Aging and Neurodegeneration-Related Gene Networks

Affiliations

A Microglial Signature Directing Human Aging and Neurodegeneration-Related Gene Networks

Shradha Mukherjee et al. Front Neurosci. .

Abstract

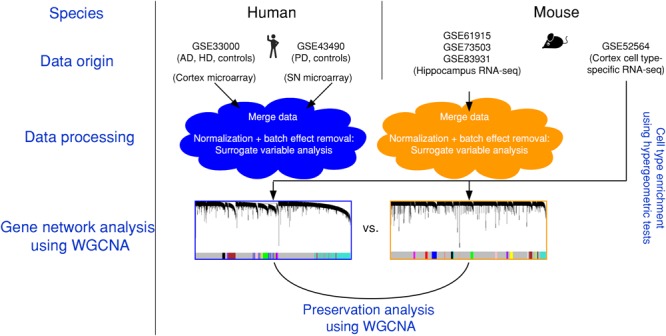
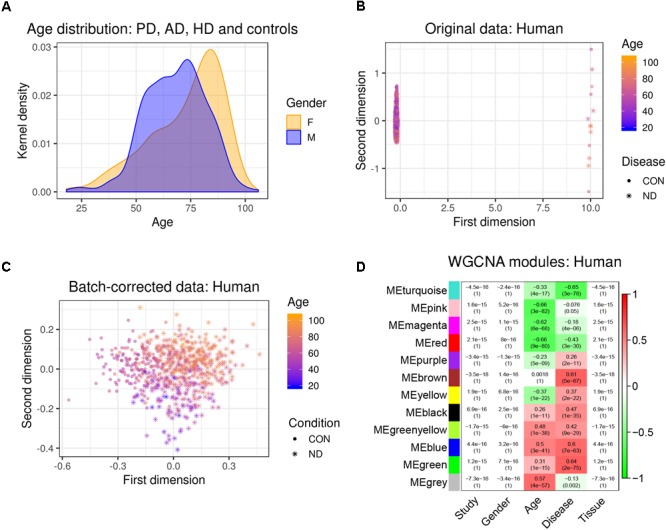
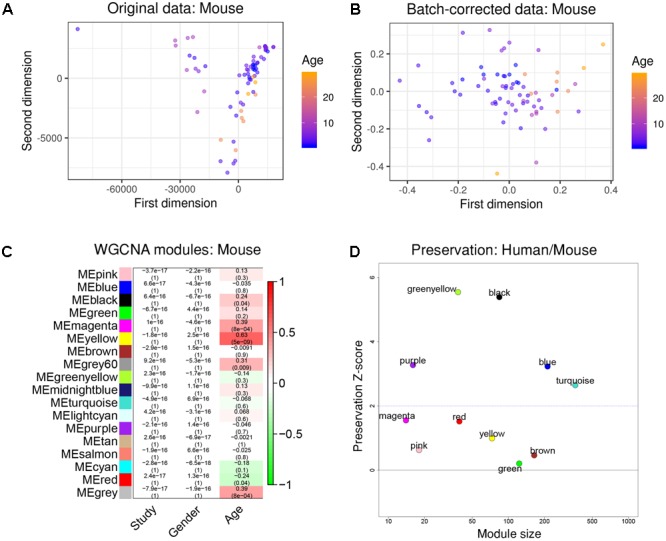
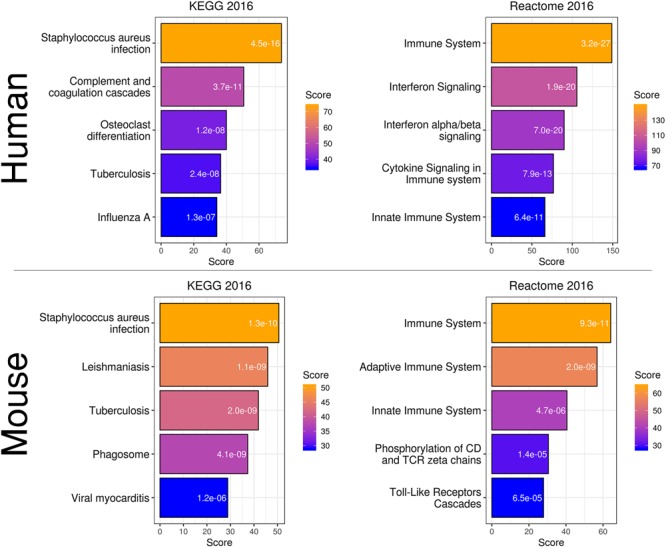
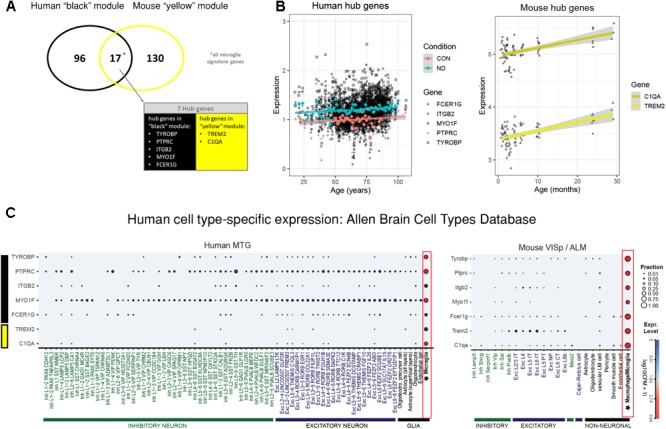
Aging is regarded as a major risk factor for neurodegenerative diseases. Thus, a better understanding of the similarities between the aging process and neurodegenerative diseases at the cellular and molecular level may reveal better understanding of this detrimental relationship. In the present study, we mined publicly available gene expression datasets from healthy individuals and patients affected by neurodegenerative diseases (Alzheimer's disease, Parkinson's disease, and Huntington's disease) across a broad age spectrum and compared those with mouse aging and mouse cell-type specific gene expression profiles. We performed weighted gene co-expression network analysis (WGCNA) and found a gene network strongly related with both aging and neurodegenerative diseases. This network was significantly enriched with a microglial signature as imputed from cell type-specific sequencing data. Since mouse models are extensively used for the study of human diseases, we further compared these human gene regulatory networks with age-specific mouse brain transcriptomes. We discovered significantly preserved networks with both human aging and human disease and identified 17 shared genes in the top-ranked immune/microglia module, among which we found five human hub genes TYROBP, FCER1G, ITGB2, MYO1F, PTPRC, and two mouse hub genes Trem2 and C1qa. Taken together, these results support the hypothesis that microglia are key players involved in human aging and neurodegenerative diseases, and suggest that mouse models should be appropriate for studying these microglial changes in human.

Keywords: Alzheimer; Parkinson; WGCNA; aging; bioinformatics; gene networks; microglia; neurodegeneration.


Figures

FIGURE 1
FIGURE 1
Experimental design and data pre-processing. Two microarray-based gene expression datasets of human patients including three neurodegenerative diseases and age-matched controls were combined and analyzed. Simultaneously, three RNA-sequencing-based gene expression datasets from mouse hippocampus were combined. The human and the mouse datasets were corrected for batch effects and gene networks were constructed with WGCNA. Species-specific networks were checked for overlap with cell type-specific RNA-sequencing data. AD, Alzheimer’s disease; HD, Huntington’s disease; PD, Parkinson’s disease; SN, substantia nigra.
FIGURE 2
FIGURE 2
Removal of batch effects and gene network construction in human aging and neurodegeneration. (A) Age and gender distribution for the combined human dataset. (B,C) The different microarray datasets showed a strong batch effect, which was corrected using SVA to remove confounders while retaining age and disease as main discriminators (CON, healthy controls; ND, neurodegeneration). (D) WGCNA modules: Each row corresponds to one gene co-expression network (labeled by color). Numbers in the table indicate the Pearson correlation coefficient r and the associated p-values in parentheses. Coloring of the table encodes the correlation between each phenotype and each module eigengene (scale on the right).
FIGURE 3
FIGURE 3
Removal of batch effects and gene network construction in mouse aging. (A,B) Dimensionality reduction of the three combined mouse RNA-seq datasets suggested a strong batch effect that was successfully mitigated by the chosen batch correction method. (C) WGCNA modules: Each row corresponds to one gene co-expression network (labeled by color). Numbers in the table indicate the Pearson correlation coefficient r and the associated p-values in parentheses. Coloring of the table encodes the correlation to the phenotype. The mouse “yellow” module was highly related to aging and also showed a significant enrichment in microglia. (D) Preservation analysis of mouse and human gene networks using human colors derived from Figure 2D. The human “black” module shows the strongest preservation in mice.
FIGURE 4
FIGURE 4
Gene expression classification and pathway analysis of human “black” and mouse “yellow” microglia-specific modules. Both species showed a similar enrichment in pathways related to infection and the immune system.
FIGURE 5
FIGURE 5
Microglia-specific hub genes in mouse and human and enrichment with the Allen Brain Cell Types Database. (A) The human “black” module and the mouse “yellow” module shared 17 genes, out of which five were hub genes in human and two were hub genes in mouse. All 17 shared genes were microglia signature genes as confirmed with the published cell type signature genes. (B) These hub genes correlated positively with age in both mouse and human, while mean expression is higher in human neurodegeneration (ND) than in controls (CON). Each gray dot represents one sample and gene, whereas the blue (ND) and the red (CON) dots indicate means and the colored lines represent a linear fit with a gray-shaded 95% confidence interval. (C) The hub genes were enriched in human (left) and mouse (right) microglia. Gene symbols are given on the y-axis, while different cell types as defined in the Allen Cell Types Database are displayed on the x-axis. Dot size and color correspond to the fraction of cells in a cluster expressing a given gene and the median gene expression, respectively. CPM, counts per million; MTG, middle temporal gyrus; VISp, primary visual cortex; ALM, anterior lateral motor cortex; Inh, inhibitory neurons; Exc, excitatory neurons; oligodendro, oligodendrocytes, LM, leptomeningeal; IT, intratelencephalic; PT, pyramidal tract; NP, near-projecting; CT, corticothalamic. Microglia are highlighted with a red box.

References

    1. Aaronson J., Rosinski J. (2015). Transcriptome profiling in knock-in mouse models of Huntington’s disease [Hippocampus_mRNA]. Available at: https://www.ncbi.nlm.nih.gov/geo/query/acc.cgi?acc=GSE73503
    1. Anders S., Pyl P. T., Huber W. (2015). HTSeq–a python framework to work with high-throughput sequencing data. Bioinformatics 31 166–169. 10.1093/bioinformatics/btu638 - DOI - PMC - PubMed
    1. Bertram L., Tanzi R. E. (2009). Genome-wide association studies in Alzheimer’s disease. Hum. Mol. Genet 18 R137–R145. 10.1093/hmg/ddp406 - DOI - PMC - PubMed
    1. Boyle E. A., Li Y. I., Pritchard J. K. (2017). An expanded view of complex traits: from polygenic to omnigenic. Cell 169 1177–1186. 10.1016/j.cell.2017.05.038 - DOI - PMC - PubMed
    1. Brendel M., Kleinberger G., Probst F., Jaworska A., Overhoff F., Blume T., et al. (2017). Increase of TREM2 during aging of an Alzheimer’s disease mouse model is paralleled by microglial activation and amyloidosis. Front. Aging Neurosci. 9:8. 10.3389/fnagi.2017.00008 - DOI - PMC - PubMed