. 2019 Jan 24:9:1965.
doi: 10.3389/fphys.2018.01965. eCollection 2018.

Personalization of Logical Models With Multi-Omics Data Allows Clinical Stratification of Patients

Affiliations

Personalization of Logical Models With Multi-Omics Data Allows Clinical Stratification of Patients

Jonas Béal et al. Front Physiol. .

Abstract

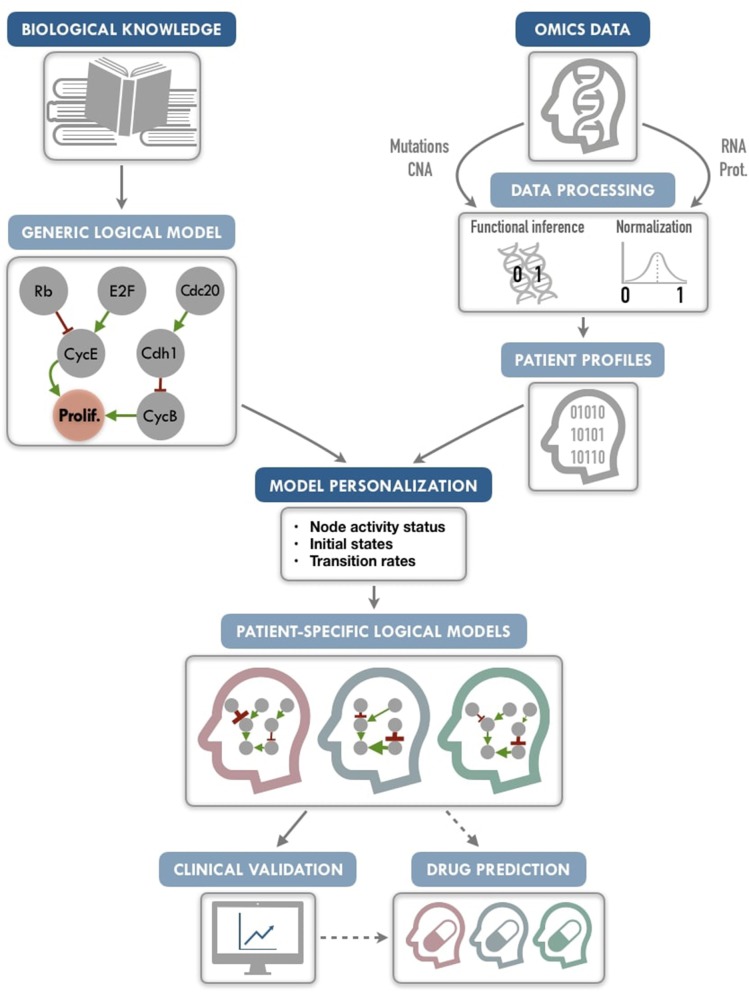
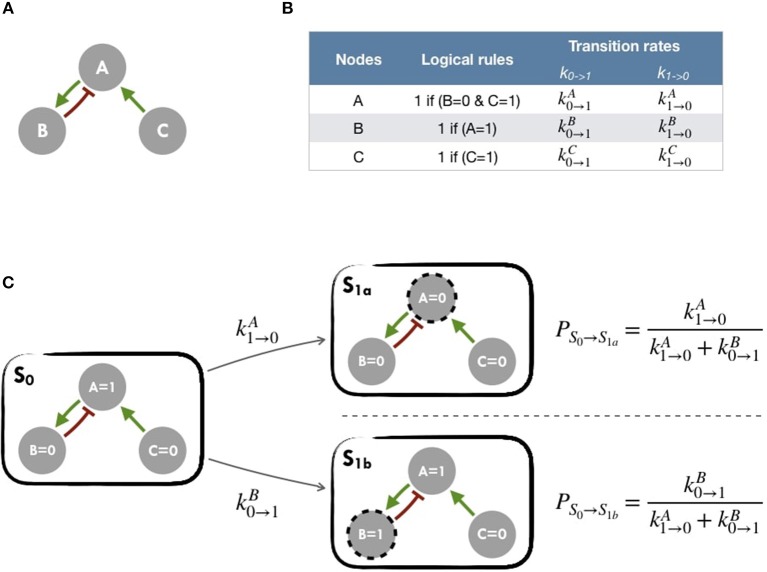
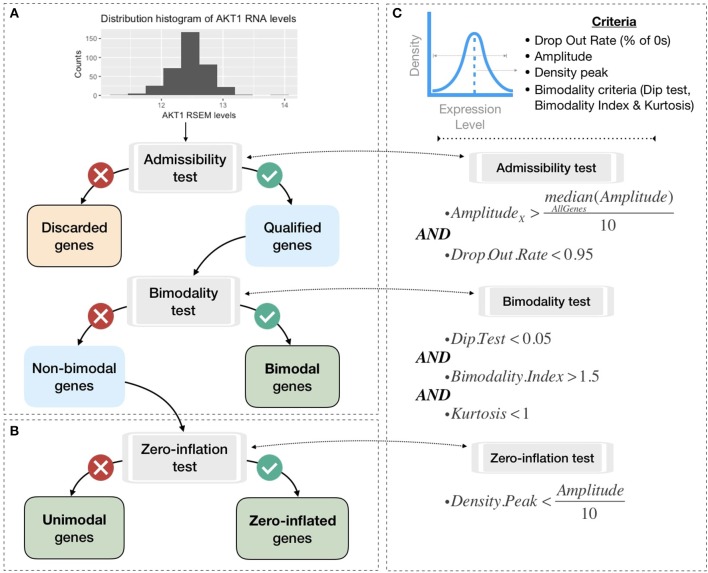
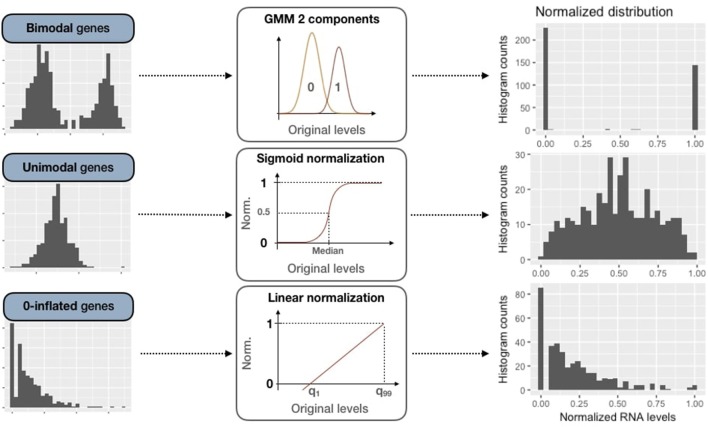
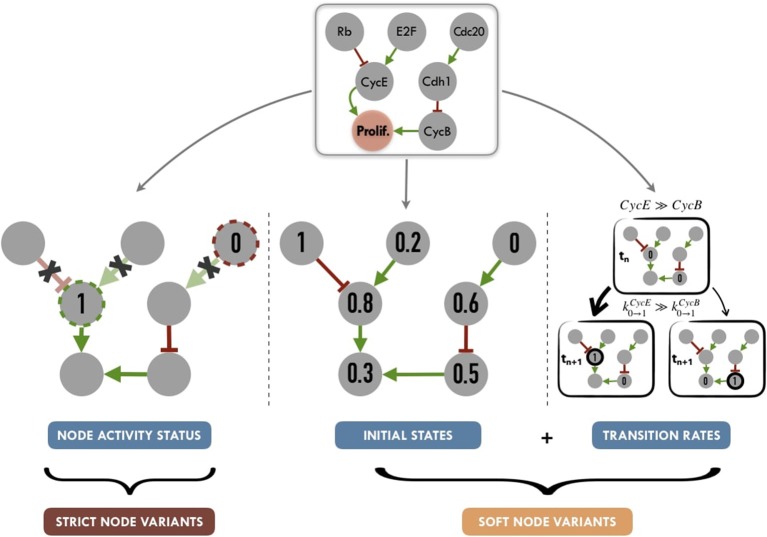
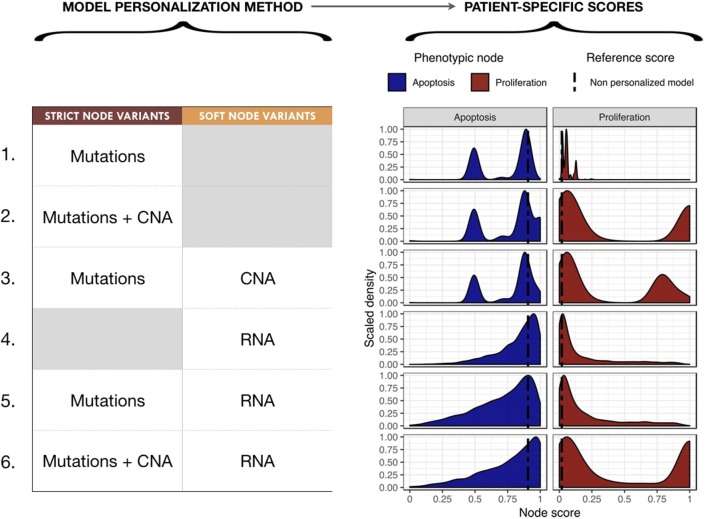
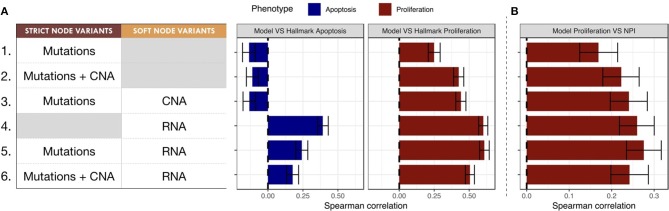
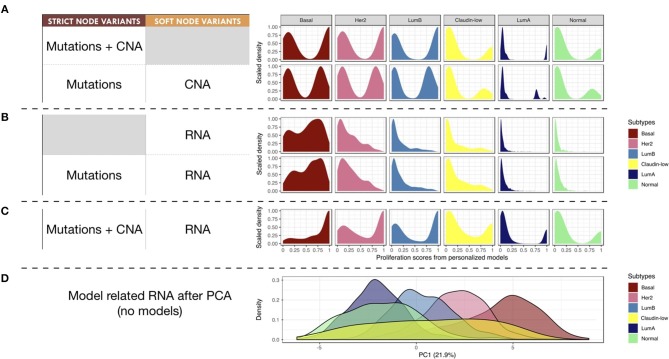
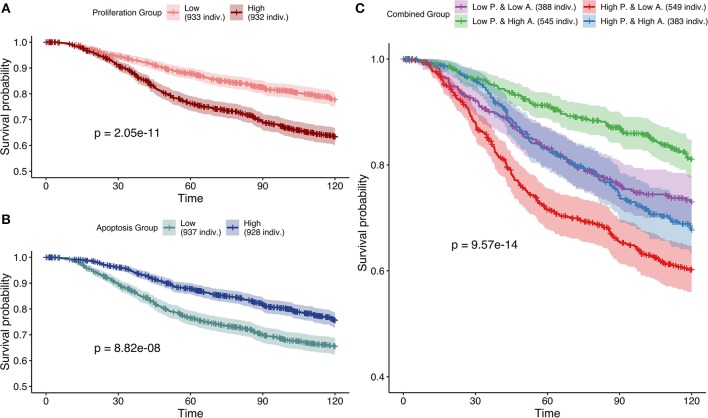
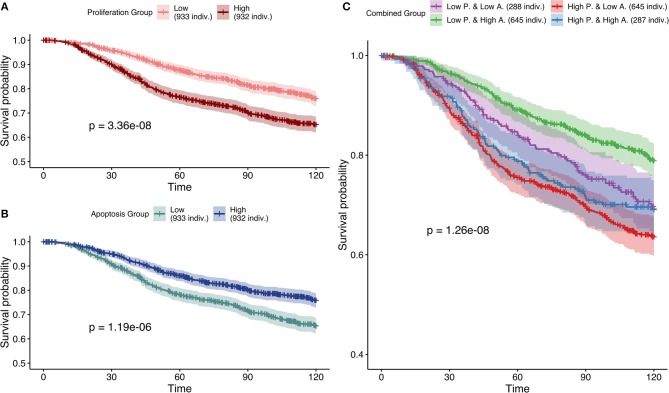
Logical models of cancer pathways are typically built by mining the literature for relevant experimental observations. They are usually generic as they apply for large cohorts of individuals. As a consequence, they generally do not capture the heterogeneity of patient tumors and their therapeutic responses. We present here a novel framework, referred to as PROFILE, to tailor logical models to a particular biological sample such as a patient tumor. This methodology permits to compare the model simulations to individual clinical data, i.e., survival time. Our approach focuses on integrating mutation data, copy number alterations (CNA), and expression data (transcriptomics or proteomics) to logical models. These data need first to be either binarized or set between 0 and 1, and can then be incorporated in the logical model by modifying the activity of the node, the initial conditions or the state transition rates. The use of MaBoSS, a tool based on Monte-Carlo kinetic algorithm to perform stochastic simulations on logical models results in model state probabilities, and allows for a semi-quantitative study of the model phenotypes and perturbations. As a proof of concept, we use a published generic model of cancer signaling pathways and molecular data from METABRIC breast cancer patients. For this example, we test several combinations of data incorporation and discuss that, with these data, the most comprehensive patient-specific cancer models are obtained by modifying the nodes' activity of the model with mutations, in combination or not with CNA data, and altering the transition rates with RNA expression. We conclude that these model simulations show good correlation with clinical data such as patients' Nottingham prognostic index (NPI) subgrouping and survival time. We observe that two highly relevant cancer phenotypes derived from personalized models, Proliferation and Apoptosis, are biologically consistent prognostic factors: patients with both high proliferation and low apoptosis have the worst survival rate, and conversely. Our approach aims to combine the mechanistic insights of logical modeling with multi-omics data integration to provide patient-relevant models. This work leads to the use of logical modeling for precision medicine and will eventually facilitate the choice of patient-specific drug treatments by physicians.

Keywords: breast cancer; data discretization; logical models; personalized mechanistic models; personalized medicine; stochastic simulations.


Figures

Figure 1
Figure 1
PROFILE methodology for personalization of logical models. On the one hand (upper left), a generic logical model, in a MaBoSS format (a BND file for model description with logical rules and a CFG file for definition of the simulation parameters), is selected to serve as the starting-point. Note that any SBML qual model can be easily translated into a MaBoSS format. The parameters related to the nodes (initial states and transition rates) are chosen to be generic in the initial CFG file. On the other hand (upper right), omics data are gathered (e.g., genome and transcriptome) as data frames, and processed through functional inference methods (for already discrete genome data) or binarization/normalization (for continuous expression data). The resulting patient profiles are used to perform model personalization, i.e., adapt the generic model with patient data. The merging of the generic model with the patient profiles creates a personalized MaBoSS model with an unchanged BND file and a CFG file per patient. Then, clinical relevance of these patient-specific models can be assessed before providing original and personalized therapeutic strategies and drug predictions.
Figure 2
Figure 2
Main principles of MaBoSS simulation framework and Gillespie algorithm (A) Toy model with B and C regulated by A. (B) In the first column, logical rules of the logical model: as an input A remains in its initial state; presence of A triggers B activation and C inhibition. In the second column, MaBoSS activation and inactivation transition rates are defined for each possible transition (C) In an asynchronous update scheme, starting from S0 state, there are two possible following states S1a and S1b with their corresponding probabilities.
Figure 3
Figure 3
Processing pipeline to classify genes in different categories based on their expression pattern across the cohort. (A) Tests to separate bimodal from non-bimodal genes before subsequent binarization. (B) Test to classify non-bimodal genes in unimodal or zero-inflated genes. (C) Statistical and logical content of the various tests used in (A,B), thresholds have been taken from the papers presenting each tool and are more precisely justified in the Methods section.
Figure 4
Figure 4
Normalization methods for expression data of genes of all three categories (bimodal, unimodal and zero-inflated). First column panels show examples of original patterns from the three categories. Second column panels illustrate the processing methods used for normalization (GMM 2-component, sigmoid normalization and linear normalization). Third column panels correspond to normalized distributions.
Figure 5
Figure 5
Graphical summary of personalization methods for logical models: node activity status (nodes set to a given value for the full run of the simulation, without consideration for logical rules), initial states (nods initialized to a given proportion of 0 or 1 states) and transition rates (weighted stochastic transitions depending on the assumed activity level of nodes). Tuning node activity status, we define Strict Node Variants or Strict NV, i.e., forcing the activity (either present or absent) of a node. Tuning both initial states and transition rates, we define Soft Node Variants or Soft NV, i.e, nodes whose initial activation proportion is close to that of the patient and whose transition rates promote maintenance in its state of activity.
Figure 6
Figure 6
Impact of different model personalization methods on the distribution of phenotypic nodes Proliferation and Apoptosis, using a generic cancer model and METABRIC data. On the left, description of data types used as Strict or Soft Node Variants to personalize the model resulting in different phenotypic probabilities' distributions across the cohort, as shown on the right. Dashed lines correspond to the probabilities of the phenotypes obtained from the original model without any personalization: 0.019 for Proliferation and 0.906 for Apoptosis.
Figure 7
Figure 7
Biological and clinical classification of phenotypic probabilities from personalized models. (A) Model personalization methods used and the corresponding Spearman rank correlation between phenotypic probabilities from personalized model and the corresponding Hallmark signatures score based on RNA gene sets. (B) Spearman rank correlation between personalized Proliferation probabilities and the Nottingham Prognostic Index (NPI) score based on clinical features (size and grade of tumor, node status).
Figure 8
Figure 8
Breast-cancer subtypes and personalized logical models. (A–C) Patterns of Proliferation probabilities per subtype with different personalization methods results in different grouping of subtypes. (D) Densities of breast-cancer subtypes along first principal component, PCA transformation based on METABRIC RNA data limited to the 114 genes described in the logical model ; percentage of variance explained by PC1 in parenthesis.
Figure 9
Figure 9
Survival analyses of METABRIC samples from which exome mutations are used as Strict Node Variants and CNA as Soft Node Variants in the model (case 3). All p-values are derived from a log-rank test. (A) Survival curves with high and low Proliferation groups. (B) Survival curves with high and low Apoptosis groups. (C) Survival curves with combined groups.
Figure 10
Figure 10
Survival analyses of METABRIC samples from which exome mutations are used as Strict Node Variants and RNA as Soft Node Variants in the model (case 5). All p-values are derived from a log-rank test. (A) Survival curves with high and low Proliferation groups. (B) Survival curves with high and low Apoptosis groups. (C) Survival curves with combined groups.

References

    1. Abou-Jaoudé W., Chaves M., Gouzé J.-L. (2011). A theoretical exploration of birhythmicity in the p53-mdm2 network. PLoS ONE 6:e17075. 10.1371/journal.pone.0017075 - DOI - PMC - PubMed
    1. Abou-Jaoudé W., Traynard P., Monteiro P. T., Saez-Rodriguez J., Helikar T., Thieffry D., et al. . (2016). Logical modeling and dynamical analysis of cellular networks. Front. Genet. 7:94. 10.3389/fgene.2016.00094 - DOI - PMC - PubMed
    1. Adzhubei I. A., Schmidt S., Peshkin L., Ramensky V. E., Gerasimova A., Bork P., et al. . (2010). A method and server for predicting damaging missense mutations. Nat. Methods 7, 248–249. 10.1038/nmeth0410-248 - DOI - PMC - PubMed
    1. Arshad O. A., Datta A. (2017). Towards targeted combinatorial therapy design for the treatment of castration-resistant prostate cancer. BMC Bioinformatics 18:134. 10.1186/s12859-017-1522-2 - DOI - PMC - PubMed
    1. Calzone L., Tournier L., Fourquet S., Thieffry D., Zhivotovsky B., Barillot E., et al. . (2010). Mathematical modelling of cell-fate decision in response to death receptor engagement. PLoS Comput. Biol. 6:e1000702. 10.1371/journal.pcbi.1000702 - DOI - PMC - PubMed