. 2019 Mar;8(5):e1900001.
doi: 10.1002/adhm.201900001. Epub 2019 Feb 8.

Evaluating CAR-T Cell Therapy in a Hypoxic 3D Tumor Model

Affiliations

Evaluating CAR-T Cell Therapy in a Hypoxic 3D Tumor Model

Yuta Ando et al. Adv Healthc Mater. 2019 Mar.

Abstract

Despite its revolutionary success in hematological malignancies, chimeric antigen receptor T (CAR-T) cell therapy faces disappointing clinical results in solid tumors. The poor efficacy has been partially attributed to the lack of understanding in how CAR-T cells function in a solid tumor microenvironment. Hypoxia plays a critical role in cancer progression and immune editing, which potentially results in solid tumors escaping immunosurveillance and CAR-T cell-mediated cytotoxicity. Mechanistic studies of CAR-T cell biology in a physiological environment has been limited by the complexity of tumor-immune interactions in clinical and animal models, as well as by a lack of reliable in vitro models. A microdevice platform that recapitulates a 3D tumor section with a gradient of oxygen and integrates fluidic channels surrounding the tumor for CAR-T cell delivery is engineered. The design allows for the evaluation of CAR-T cell cytotoxicity and infiltration in the heterogeneous oxygen landscape of in vivo solid tumors at a previously unachievable scale in vitro.

Keywords: chimeric antigen receptors; hypoxia; immune checkpoints; immunotherapy; ovarian cancer; solid tumors.


Conflict of interest statement

Conflict of Interest

K.S., Y.A., and H.P.T. are listed as inventors for a US patent application disclosing the hypoxia device, which includes part of the data described in the manuscript.

Figures
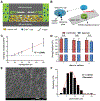
Figure 1.
Figure 1.
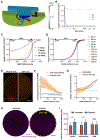
Physical characteristics of the 3-D tumor model that recapitulates an oxygen gradient and matrix microenvironment for T cell infiltration. (A) Illustration of the working principle. (B) Schematics of the microdevice assembly. A PDMS fluidic component is plasma-bonded to a glass slide before assembling with a milled polycarbonate (PC) cap to form a cell-laden GelMA layer under the oxygen barrier pillar. (C) Stiffness of the GelMA hydrogels in relation to UV-curing time (R2 = 0.9909, linear regression). (D) Viability of GelMA-encapsulated SKOV3 human ovarian cancer cells under hypoxic or normoxic incubation in device (n = 3; n.s.: not significant, p < 0.05 by Student’s t-test). (E) Scanning electron microscopy image (scale bar = 10 µm), and (F) the average pore size of the 120-second UV-crosslinked GelMA hydrogel.
Figure 2.
Figure 2.
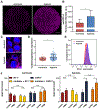
Characterization of the oxygen gradient. (A) Heat map illustrating the oxygen levels at the steady state in the hypoxic microdevice. (B) Evolvement of oxygen concentration in the microdevice within 24 hours of device assembly. Oxygen gradient profiles in relations to (C) the cell density and (D) the thickness of the cell-laden hydrogel at the 10 million/mL density. (E) Fluorescent images (scale bar = 1,000 µm) and (F) measurements with microparticle-based oxygen sensors without or with cells in the device (n = 4 with cells, n = 2 without cells). (G) Measured/calculated vs. simulated oxygen profiles. (H) Expression of Glut-1, a hypoxia marker, in the 3-D tumor model incubated without or with the hypoxic microdevice (scale bar = 1,000 µm), and (I) a radial analysis of high Glut-1 expression across cells (n = 190, 185, 249 for normoxic center, intermediate, and edge, respectively, and n = 163, 183, 231 for hypoxic center, intermediate, and edge, respectively; n.s.: not significant, *: p < 0.05 by Student’s t-test).
Figure 3.
Figure 3.
T cell mediated killing in the 3-D tumor models. (A) Schematic of normoxic and hypoxic conditions in the platform. Upon crosslinking of cell-laden GelMA, media was flushed through the PDMS fluidics channels. The cap was then disassembled for normoxic conditons (top), while the construct remained assembled for hypoxic conditions (bottom). (B) Live/dead staining of the 3-D tumor models after 24 hours of culture without or with microfluidic channel-delivered T cells in normoxia and hypoxia devices (scale bar = 1,000 µm). Radial analysis of dead cell counts in (C) normoxia and (D) hypoxia devices (n = 9 for no treatment, n = 5 for NT-T and CAR-T). (E) Comparison of non-transduced and CAR-T cell-mediated cytotoxicity under 2-D vs. 3-D, normoxia vs. hypoxia, and three effector:target (E:T) ratios (n = 3; n.s.: not significant, ‡: p < 0.05 between compared conditions, and *: p < 0.05 compared to the corresponding 2-D culture under the same E:T ratio conditions; all comparisons done by one-way ANOVA).
Figure 4.
Figure 4.
PD-L1 characterization and inhibition in the 3-D tumor models. (A) PD-L1 immunostaining showing an up-regulation in the hypoxia microdevice (scale bar = 1,000 µm). (B) Quantification of the fluorescence intensity of the PD-L1 staining (n = 100, *: p < 0.05 by Mann-Whitney test). (C) Confocal images of single cancer cells in the tumor models under normoxia and hypoxia (scale bar = 10 µm). (D) Up-regulation of PD-L1 surface/cytoplasmic ratio by hypoxia (n = 129 for normoxia, n =105 for hypoxia; *: p < 0.05 by Mann-Whitney test). (E) Confirmation of PD-L1 surface up-regulation by flow cytometric analysis with live-stained cancer cells. (F) PD-L1 inhibition has negligible effect on NT-T and CAR-T killing behavior and efficacy in the 3-D tumor models (n = 6; n.s.: not significant, *: p < 0.05 by one-way ANOVA).
Figure 5.
Figure 5.
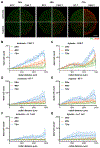
Temporal analysis of CAR-T cell-induced cytotoxicity. (A) Live/dead staining of the 3-D tumor models incubated in normoxia or hypoxia with NT-T or CAR-T cells at a 20:1 E:T ratio for 24, 48, and 72 hours (scale bar = 1,000 µm). The number of dead cells from CAR-T cell-treated conditions were then radially quantified for the (B) normoxic and (C) hypoxic microdevice conditions. Control samples were treated with NT-T cells under (D) normoxia and (E) hypoxia or no T cells under (F) normoxia and (G) hypoxia (n = 4 for all conditions).
Figure 6.
Figure 6.
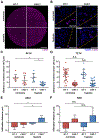
Assessment of T cell infiltration into the tumor bulk. (A) 3-D micropatterns after treatment fixed and immuno-stained against CD45 for identification of T cells within the tumor bulk (scale bar = 1,000 µm). (B) Confocal images of NT-T and CAR-T cells in the device near the tumor-channel boundary after 72 hours of treatment (scale bar = 50 µm). Quantification of the distance between CD45+ cells and the nearest GelMA-embedded cancer cells at (C) 24 hours and (D) 72 hours (*: p < 0.05, n.s.: not significant, by one-way ANOVA). Quantification of the infiltration distance into or outside of GelMA was depicted as a positive or negative value, respectively, and depicted at (E) 24 hours and (F) 72 hours (*: p < 0.05, n.s.: not significant, by one-way ANOVA). (C, E) n = 8 for normoxia NT-T and CAR-T, n = 7 for hypoxia NT-T, n = 12 for hypoxia CAR-T. (D, F) n = 29 for normoxia NT-T, n = 20 for normoxia CAR-T, n = 13 for hypoxia NT-T, n = 25 for hypoxia CAR-T.

Similar articles

Cited by

References

    1. Beatty GL, O’Hara M, Pharmacol. Ther 2016, 166, 30. - PMC - PubMed
    1. Yu S, Li A, Liu Q, Li T, Yuan X, Han X, Wu K, J. Hematol. Oncol.J Hematol Oncol 2017, 10, 78. - PMC - PubMed
    1. Scarfò I, Maus MV, Immunother J. Cancer 2017, 5, 28. - PMC - PubMed
    1. Maude SL, Frey N, Shaw PA, Aplenc R, Barrett DM, Bunin NJ, Chew A, Gonzalez VE, Zheng Z, Lacey SF, et al., N. Engl. J. Med 2014, 371, 1507. - PMC - PubMed
    1. Newick K, Moon E, Albelda SM, Mol. Ther. - Oncolytics 2016, 3, 16006. - PMC - PubMed

Publication types

MeSH terms

Substances