. 2019 Feb 8;17(2):e3000134.
doi: 10.1371/journal.pbio.3000134. eCollection 2019 Feb.

Proximal recolonization by self-renewing microglia re-establishes microglial homeostasis in the adult mouse brain

Affiliations

Proximal recolonization by self-renewing microglia re-establishes microglial homeostasis in the adult mouse brain

Lihong Zhan et al. PLoS Biol. .

Abstract

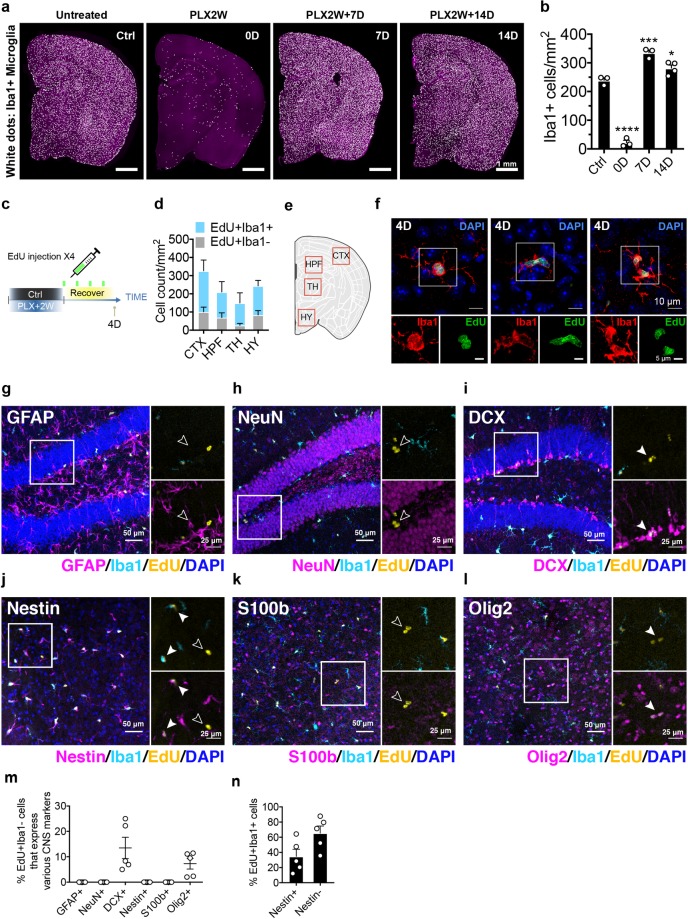
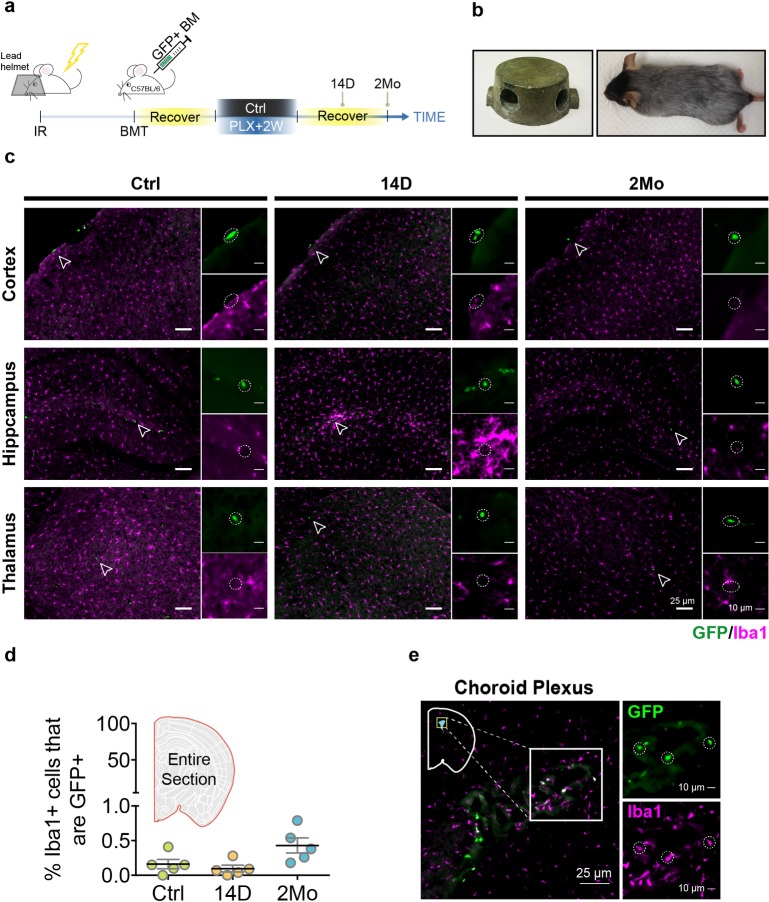
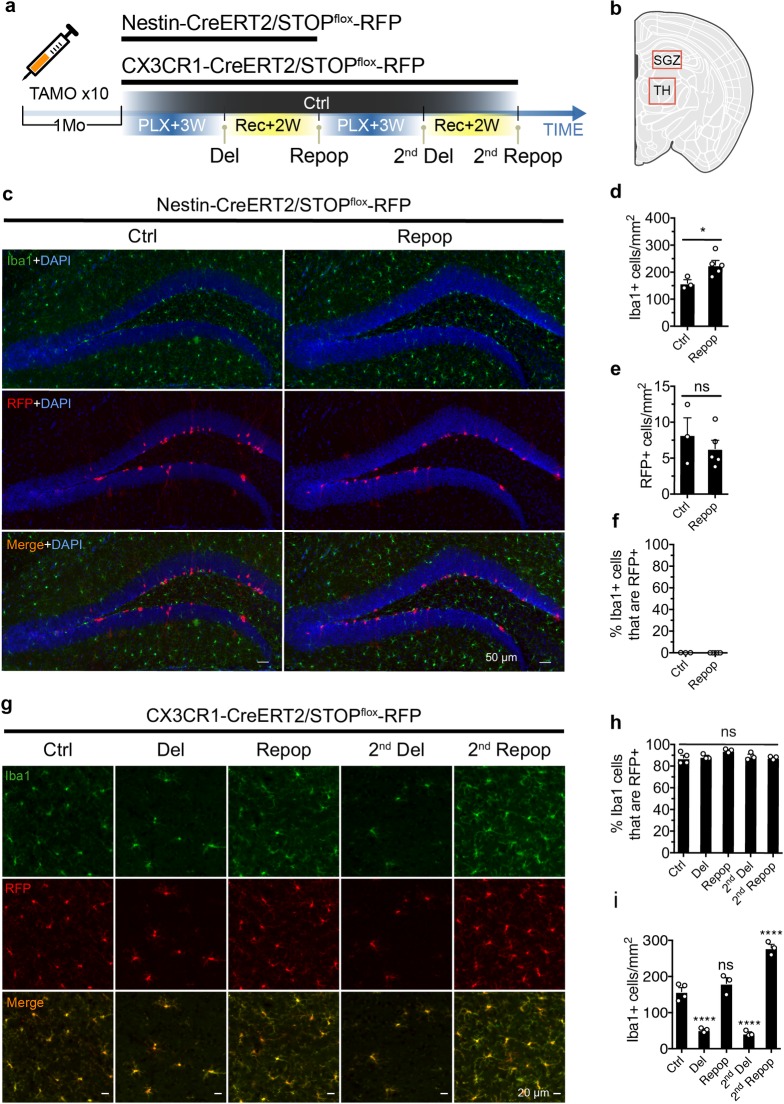
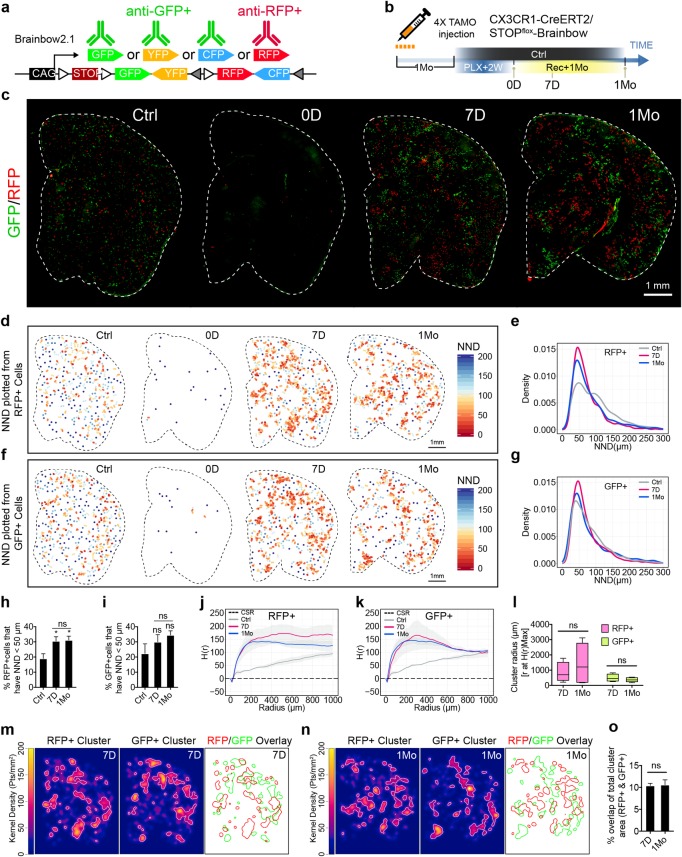
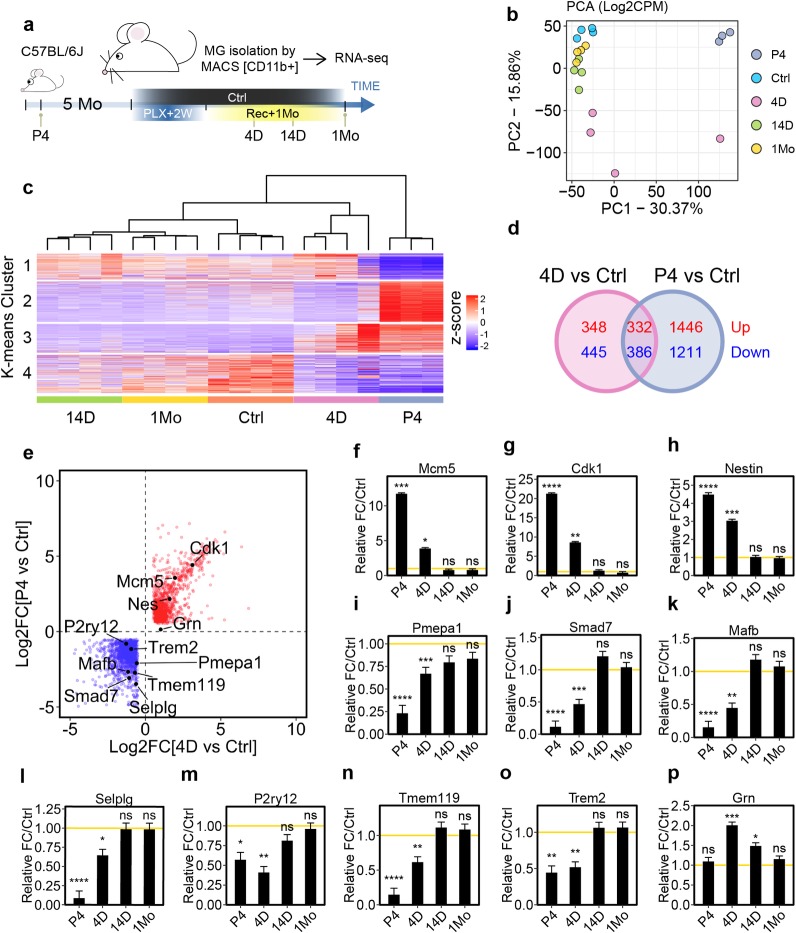
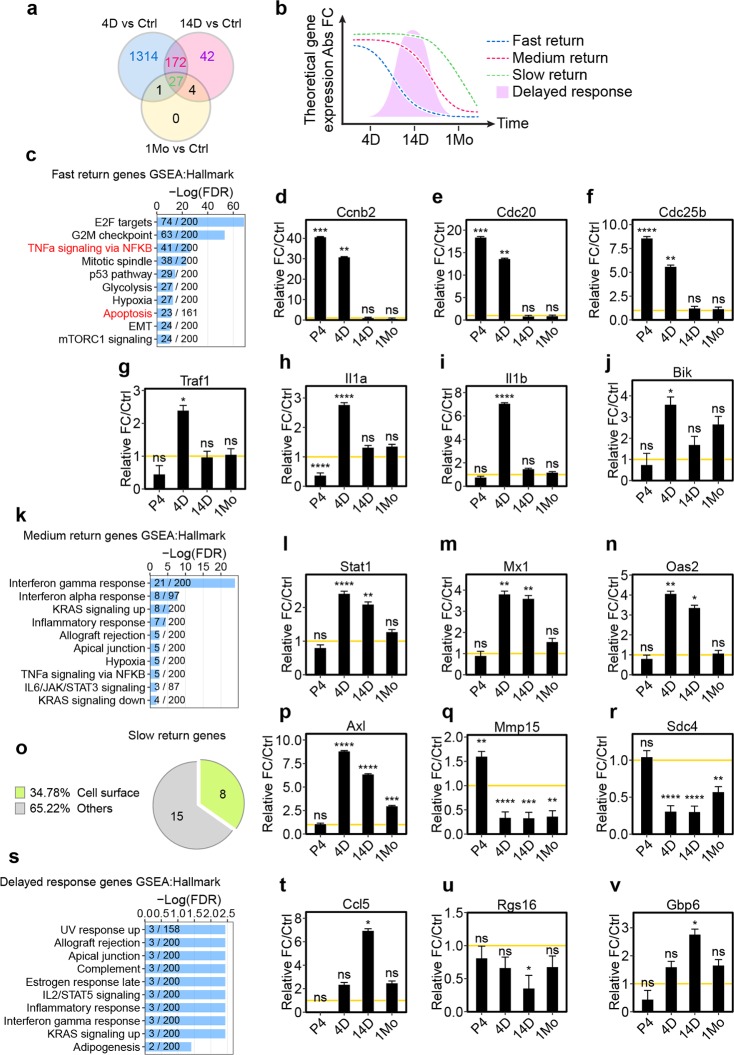
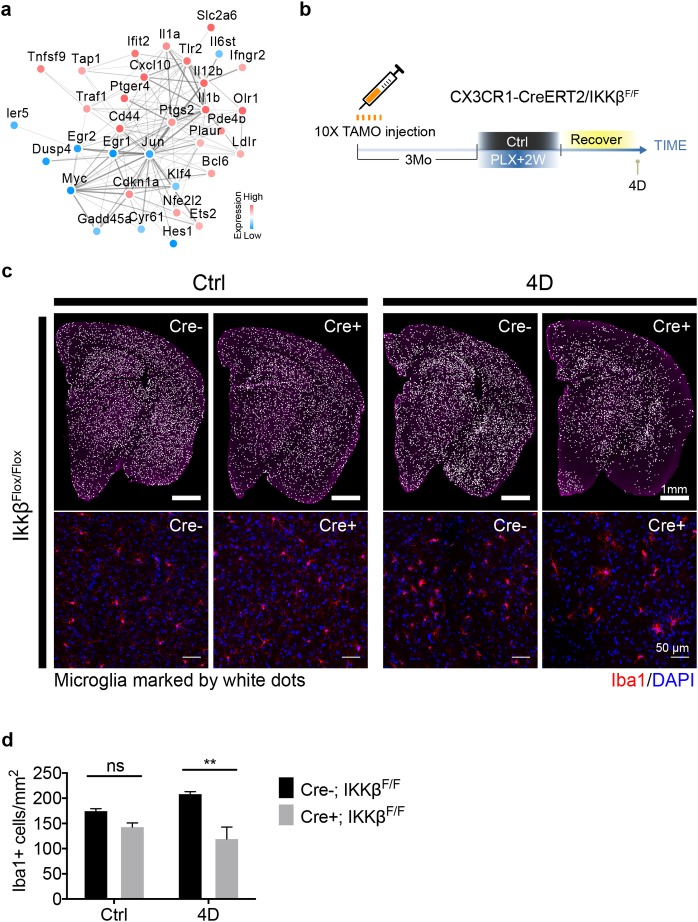
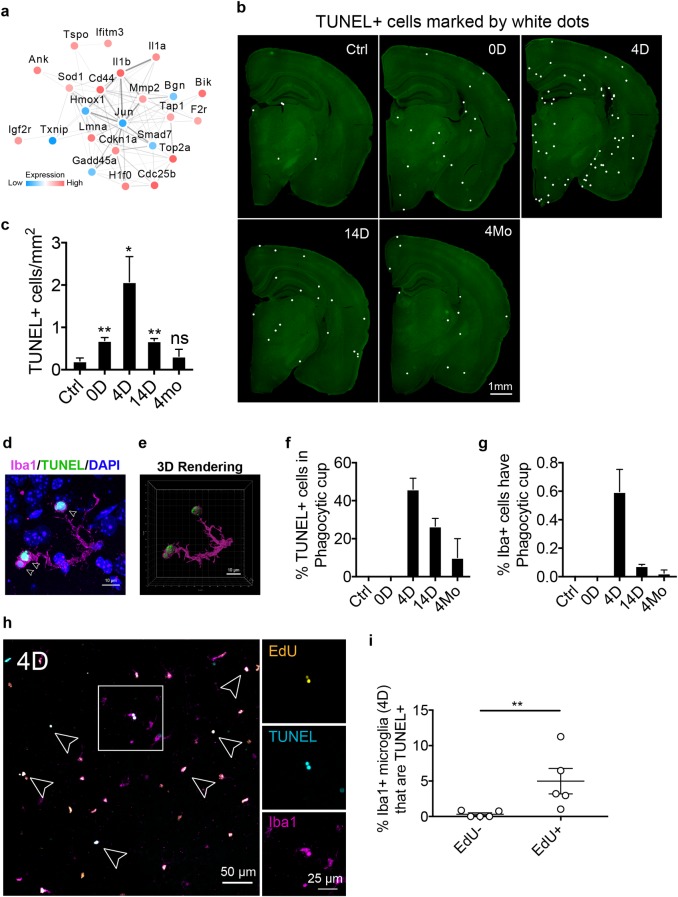
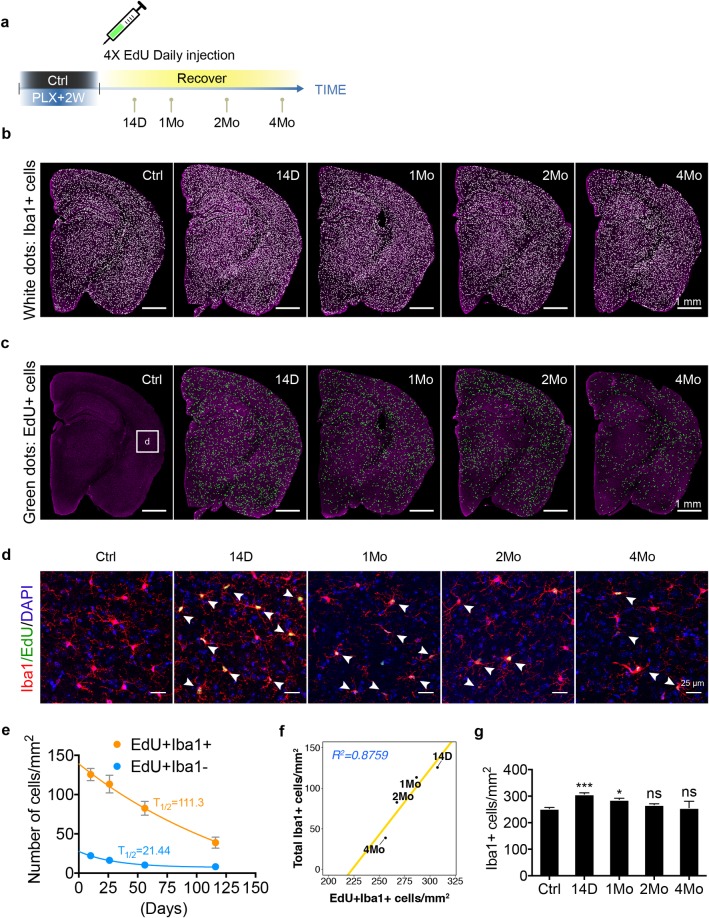
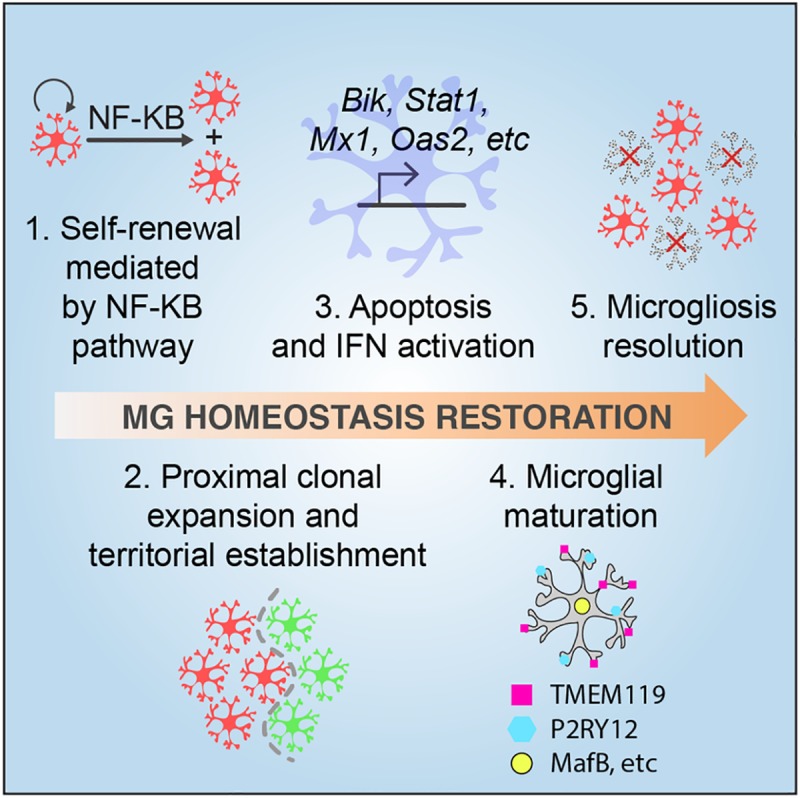
Microglia are resident immune cells that play critical roles in maintaining the normal physiology of the central nervous system (CNS). Remarkably, microglia have an intrinsic capacity to repopulate themselves after acute ablation. However, the underlying mechanisms that drive such restoration remain elusive. Here, we characterized microglial repopulation both spatially and temporally following removal via treatment with the colony stimulating factor 1 receptor (CSF1R) inhibitor PLX5622. We show that microglia were replenished via self-renewal, with no contribution from nonmicroglial lineages, including Nestin+ progenitors and the circulating myeloid population. Interestingly, spatial analyses with dual-color labeling revealed that newborn microglia recolonized the parenchyma by forming distinctive clusters that maintained stable territorial boundaries over time, indicating the proximal expansive nature of adult microgliogenesis and the stability of microglia tiling. Temporal transcriptome profiling at different repopulation stages revealed that adult newborn microglia gradually regain steady-state maturity from an immature state that is reminiscent of the neonatal stage and follow a series of maturation programs, including nuclear factor kappa-light-chain-enhancer of activated B cells (NF-κB) activation, interferon immune activation, and apoptosis. Importantly, we show that the restoration of microglial homeostatic density requires NF-κB signaling as well as apoptotic egress of excessive cells. In summary, our study reports key events that take place from microgliogenesis to homeostasis reestablishment.


Conflict of interest statement

LG is a cofounder of Aeton Therapeutics, Inc.

Figures

Fig 1
Fig 1. Release from CSF1 inhibition triggers proliferation of microglia and a nonmicroglial population.
(a) Stitched image of coronal section showing microglial density at steady state (Ctrl), after 2 weeks of PLX5622 treatment (PLX2W), repopulation for 7 days (PLX2W + 7 D), and repopulation for 14 days (PLX2W + 14 D). C57BL/6J mice were used. Iba1+ cells are shown as microglia. (b) Quantification of microglial density shown in (a). Microglia number was counted and normalized to area of the coronal section (mean ± SEM). Number of C57BL/6J mice (3 Mo) used: Ctrl (n = 3), PLX2W (n = 3), 7 D (n = 3), and 14 D (n = 4). One-way ANOVA with Dunnett's multiple comparisons test was used to compare with Ctrl group. (c) Schematic diagram of EdU labeling during microglia repopulation. Microglia were depleted in 3-month-old C57BL/6J mice using PLX5622 diet for 2 weeks. EdU was then administered via IP injection every 24 hours during 4 days of repopulation. (d) Quantification of cell density for EdU+/Iba1+ and EdU+/Iba1− cells (mean ± SEM) from different regions in day 4 repopulating brain. Number of C57BL/6J mice (3 Mo) used: n = 5. (e) Diagram showing the sub-brain regions used for quantification (see S2 Fig for representative images). (f) Confocal images showing Iba1+ microglia undergoing mitosis as marked by EdU labeling. (g–l) Confocal microscopy images showing costaining of Iba1, EdU, and a panel with different CNS markers in sections after 4 days of repopulation. EdU+Iba1− cells are highlighted with open arrow heads. EdU+Iba1− cells that are positive for CNS marker are marked by closed arrow heads. GFAP+, NeuN+, and DCX+ cells were imaged from the hippocampal region. Nestin+, S100β+, and Olig2+ cells were imaged from the thalamic region, shown as HPF and TH in panel (e), respectively. (m) Quantification of the percentage of EdU+Iba1− cells expressing different CNS markers out of all EdU+Iba1− cells in mice after 4 days of repopulation (mean ± SEM). Number of animal used: (n = 5). (n) Quantification of the percentage of Nestin-positive and Nestin-negative cells out of all EdU+Iba1+ cells. Number of animals used: (n = 5). P value is summarized as ns (P > 0.05), *(P ≤ 0.05), **(P ≤ 0.01), ***(P ≤ 0.001), and ****(P ≤ 0.0001). Individual numerical values can be found in S1 Data. CNS, central nervous system; Ctrl, control; CTX, cortex; D, days; DCX, doublecortin; EdU, 5-Ethynyl-2′-deoxyuridine; GFAP, glial fibrillary acidic protein; HY, hypothalamus; HPF, hippocampus; Iba1; IP, intraperitoneal; Mo, months; NeuN, neuronal nuclei; Olig2, oligodendrocyte transcription factor 2; PLX, PLX5622; TH, thalamus.
Fig 2
Fig 2. Donor hematopoietic myeloid cells do not contribute to the repopulated microglial pool.
(a) Experimental design for the BMT experiment. The BMT mice were treated with 2 weeks of PLX5622 diet and switched to a normal diet for 14 D or 2 Mo for histological analyses. (b) A custom-designed lead helmet used to protect the brain from irradiation damage. Mouse brain was protected by the helmet as shown by the preservation of black fur. (c) Representative images of Iba1+ microglia (red) and GFP+ cells (green) in different brain regions from BMT mice after 14 D and 2 Mo of microglial repopulation. GFP+ cells are highlighted with an open arrowhead and enlarged in the inset highlighted by the dotted circle. (d) Quantification of the percentage of GFP+Iba1+ in repopulated microglia. Quantification was performed using stitched image for the whole coronal section (mean ± SEM). Number of animals used: Ctrl (n = 5), 14 D (n = 5), and 2 Mo (n = 5). (e) GFP+Iba1+ cells shown in choroid plexus and highlighted in the box inset. GFP+Iba1+ cells are highlighted by the dotted circle. Individual numerical values can be found in S1 Data. BMT, bone marrow transplantation; Ctrl, control; D, days; GFP, green fluorescent protein; Iba1, ionized calcium binding adaptor molecule 1; Mo, months; PLX, PLX5622.
Fig 3
Fig 3. Repopulated microglia are exclusively derived from CX3CR1+ cell lineage.
(a) Schematic diagram of lineage tracing experiment for repopulated microglia. Nestin-CreERT2/STOPflox-RFP mice (4 Mo) or CX3CR1-CreERT2/STOPflox-RFP mice (7–9 Mo) were given 2 mg tamoxifen daily via IP injection for 10 days. Two weeks after the last tamoxifen administration, mice were subjected to 3 weeks of PLX treatment (Del) before switching back to normal diet for 2 weeks (Repop). This microglial depletion/repopulation regimen was repeated for a second round (2nd Del, 2nd Repop) for the CX3CR1-CreERT2/STOPflox-RFP mice. (b) Diagram showing the SGZ region and TH region used for imaging and quantification performed in the Nestin-CreERT2/STOPflox-RFP mice (c–f) and CX3CR1-CreERT2/STOPflox-RFP mice (g, i), respectively. (c) Representative images showing Nestin+ lineage (RFP+, red) and microglia (Iba1+, green) at the SGZ before and after microglial repopulation. Nestin-CreERT2/STOPflox-RFP mice (4 Mo) were treated as described in panel (a), with a single round of microglial depletion and repopulation. (d) Quantification of Iba1+ microglial cell density before and after repopulation (mean ± SEM). Number of animals used: Ctrl (n = 3) and Repop (n = 4). (e) Quantification of cell density of Nestin lineage (RFP+) before and after microglial repopulation (mean ± SEM). (f) Quantification of Iba1+ microglia that express Nestin before and after microglial repopulation (mean ± SEM). Unpaired t test was used to compute statistical differences (d, e). (g) Representative images showing Iba1+ (green) and RFP (red) after depletion and repopulation. Images were taken from the TH region. (h) Quantification of the percentage of Iba1+ microglia that express RFP (mean ± SEM). Numbers of animals used: Ctrl (n = 4), 1st Del (n = 3), 1st Repop (n = 3), 2nd Del (n = 3), and 2nd Repop (n = 3). One-way ANOVA was used to assess statistical differences among the groups. (i) Quantification of Iba1+ microglial density after different treatments (mean ± SEM). One-way ANOVA with Dunnett's multiple comparisons test was used by comparing to the Ctrl group. P value is summarized as ns (P > 0.05), *(P ≤ 0.05), **(P ≤ 0.01), ***(P ≤ 0.001), and ****(P ≤ 0.0001). Individual numerical values can be found in S1 Data. Ctrl, control; CreERT2, tamoxifen-inducible Cre recombinase; CX3CR1, CX3C chemokine receptor 1; Del, deletion; Iba1, ionized calcium binding adaptor molecule 1; IP, intraperitoneal; Mo, months; ns; PLX, PLX5622; Repop, repopulation; RFP, red fluorescent protein; SGZ, subgranular zone; TH, thalamus.
Fig 4
Fig 4. Repopulated microglia form stable clusters with minimal migratory diffusion.
(a) Immunofluorescent staining strategy to visualize RFP+ or GFP+ microglia using the Brainbow reporter. (b) Experimental scheme to sparsely label microglia with Brainbow reporter. The CX3CR1-CreERT2/STOPflox-Brainbow mice (7–8 Mo) were given a daily dose of 2 mg tamoxifen per animal via IP injection for 4 days. Labeled mice were subjected to 2 weeks of PLX treatment before switching to normal diet for 7 D or 1 Mo. (c) Representative images from coronal sections of RFP+ cells (red) and GFP+ cells (green). Parenchyma outline is visualized with white dotted line. (d) Spatial heatmap of NND reconstructed from RFP+ cells. Each dot represents a single cell color-coded by NND score. (e) Density plot showing NND distribution from RFP+ cells. (f) Spatial heatmap of NND reconstructed from GFP+ cells. (g) Density plot showing NND distribution from GFP+ cells. (h) Quantification of the percentage of RFP+ cells that have equal or less than 50 μm NND (mean ± SEM). Animals used: Ctrl (n = 5), 7 D (n = 4), and 1 Mo (n = 5). One-way ANOVA with Dunnett's multiple comparisons test was used by comparing to the Ctrl group. Sidak's multiple comparisons test was used to compare 7 D and 1 Mo. (i) Quantification of the percentage of GFP+ cells that have equal or less than 50 μm NND. Statistical analysis was the same as (h). (j, k) Plot of Ripley’s H-function analysis on RFP+ (h) and GFP+ (i) cell-clustering patterns. Black dotted line represents CSR, i.e., absence of clustering pattern. Average H(r) value from each group were plotted. Grey ribbon shades represent SEM. Animals used: Ctrl (n = 5), 7 D (n = 4), and 1 Mo (n = 5). (l) Cluster domain size estimation from H(r)Max. Box-whisker plot of cluster domain size estimation from H(r)Max (whisker: max and min; box: 25 and 75 percentile). Unpaired t test was used. (m, n) 2D kernel density map showing cluster interaction between RFP+ and GFP+ cells. Representative sample from 7 D (m) and 1 Mo (n) were plotted. White line marks the border of isolated cluster domains based on the top 10% of the highest kernel density. Overlay of the isolated RFP+ and GFP+ cluster contours are delineated with red and green lines, respectively. (o) Quantification of the percentage of overlapping area of RFP+ and GFP+ clusters with respect to total RFP+ and GFP+ cluster area (mean ± SEM). Animals used: 7 D (n = 4); 1 Mo (n = 5). Unpaired t test was used. P value is summarized as ns (P > 0.05), *(P ≤ 0.05), **(P ≤ 0.01), ***(P ≤ 0.001), and ****(P ≤ 0.0001). Individual numerical values can be found in S1 Data. CreERT2, tamoxifen-inducible Cre recombinase; CSR, complete spatial randomness; Ctrl, control; CX3CR1, CX3C chemokine receptor 1; D, days; GFP, green fluorescent protein; IP, intraperitoneal; Mo, months; NND, nearest neighbor distance; PLX, PLX5622; RFP, red fluorescent protein.
Fig 5
Fig 5. Adult newborn microglia progressively restore homeostatic maturity from a unique immature state.
(a) Schematic design for the RNA-seq experiment. C56BL/6 mice (5 Mo) were treated with 2 weeks of PLX5622 diet and switched to a normal diet for 4 days (4 D), 14 days (14 D), or 1 month (1 Mo). (b) PCA analysis of relative gene expression variance from control (Ctrl), P4 neonatal microglia (P4), and after 4 days (4 D), 14 days (14 D), and 1 month (1 Mo) of repopulation. The largest principle components, PC1 and PC2, were used to plot the data. (c) Heatmap showing k-means clustering (k = 4) for relative gene expression. Dendrogram indicates the hierarchical clustering of each biological replicates. Number of animals used: Ctrl (n = 4), 4 D (n = 4), 14 D (n = 4), 1 Mo (n = 4), and P4 (n = 3). (d) Venn diagram comparing differentially expressed genes between 4 D adult newborn microglia and P4 neonatal microglia. DE genes: Log2FC ≥ 1 or ≤ −1 and FDR < 0.05 in comparison to unperturbed adult microglia (Ctrl). Up-regulated genes and down-regulated genes are shown in red and blue, respectively. (e) Scatter plot showing DE genes shared by 4 D and P4 microglia. DE genes were calculated in comparison to Ctrl microglia with Log2FC ratio greater or less than 1 with FDR < 0.05. DE genes that are up-regulated in both 4D and P4 microglia are shown as red dots, while down-regulated genes are shown as blue dots. (f–p) Relative gene expression of Mcm5 (f), Cdk1 (g), Nestin (h), Pmepa1(i), Smad7 (j), Mafb (k), Selplg (l), P2ry12 (m), Tmem119 (n), Trem2 (o), and Grn (p). Relative fold change was calculated in comparison to untreated control microglia. The yellow lines (y = 1) indicate normalized baseline expression of control. FDR is summarized as ns (P > 0.05), *(P ≤ 0.05), **(P ≤ 0.01), ***(P ≤ 0.001), and ****(P ≤ 0.0001). Individual numerical values can be found in S1 Data. Ctrl, control; D, days; DE, differentially expressed; FDR, false discovery rate; Log2FC, log2 transformed fold change; Mo, months; PCA, principal component analysis; PLX, PLX5622.
Fig 6
Fig 6. Adult newborn microglia engage a stepwise program to restore their steady-state gene signature.
(a) Venn diagram comparing DE genes among 4 D, 14 D, and 1 Mo adult newborn microglia. DE genes were calculated in comparison to Ctrl microglia with Log2FC ratio greater or less than 1 with FDR < 0.05. (b) Schematic diagram illustrating gene sets with differential rates of homeostatic return. (c) GSEA analysis of fast-return genes using the hallmark gene set. The top 10 most-enriched pathways are shown. The number of genes identified in the RNA-seq is shown as numerator. The number of total genes curated for the specific term is shown as denominator. (d–j) Relative gene expression of Cdcnb2 (d), Cdc20 (e), Cdc25b (f), Traf1 (g), Il1a (h), Il1b (i), and Bik (j). (k) GSEA analysis on medium-return genes using the hallmark gene set. (l–n) Relative gene expression of Stat1 (l), Mx1 (m), and Oas2 (n). (o) GO (cellular component) analysis on slow-return genes. (p–r) Relative gene expression of Axl (p), Mmp15 (q), and Sdc4 (r). (s) GSEA analysis on “delayed response” genes using the hallmark gene set database. (t–v) Relative gene expression of Ccl5 (t), Rgs16 (u), and Gbp6 (v). For all gene expression graphs, relative fold change was calculated in comparison to untreated Ctrl microglia. Yellow lines (y = 1) indicate normalized baseline expression of control. FDR is summarized as ns (P > 0.05), *(P ≤ 0.05), **(P ≤ 0.01), ***(P ≤ 0.001), and ****(P ≤ 0.0001). Individual numerical values can be found in S1 Data. Ctrl, control; DE, differentially expressed; FDR, false discovery rate; GO, gene ontology; GSEA, gene set enrichment analysis; Log2FC, log2 transformed fold-change.
Fig 7
Fig 7. NF-kβ pathway promotes microglia repopulation.
(a) Network of NF-kβ signaling–associated genes identified from the RNA-seq experiment (fast-return genes). Network was constructed using the STRING database. Directionality of gene expression pattern is shown as red for up-regulation and blue for down-regulation. (b) Experimental scheme for generating conditional IKKβ knockout mice. CX3CR1-CreERT2/IKKβf/f mice (7–8 Mo) injected with 2 mg tamoxifen/day via IP for 10 days. Three months later, mice were treated with PLX5622 diet for 2 weeks and switched to a normal diet for 4 D. (c) Representative images showing microglial density from the whole coronal section (upper panel) and thalamic region (lower panel). Iba1+ cells are visualized as white dots. (d) Quantification of microglial density from entire coronal section as shown in panel (c, upper panel) (mean ± SEM). Animal used: (n = 3) for each group. Two-way ANOVA with Sidak's multiple comparisons test was used to compare IKKβ control (Cre−) and IKKβ deletion (Cre+). P value is summarized as ns (P > 0.05), *(P ≤ 0.05), **(P ≤ 0.01), ***(P ≤ 0.001), and ****(P ≤ 0.0001). Individual numerical values can be found in S1 Data. CreERT2, tamoxifen-inducible Cre recombinase; CX3CR1, CX3C chemokine receptor 1; D, days; IKKβ, I-Kappa-B-Kinase Beta; IP, intraperitoneal; Mo, months; PLX, PLX5622; STRING, Search Tool for the Retrieval of Interacting Genes/Proteins.
Fig 8
Fig 8. Cell death is associated with microglial proliferation.
(a) Network of apoptosis-associated genes identified from the RNA-seq experiment (fast-return genes). Network was generated using the STRING database. Directionality of gene expression pattern is shown as red for up-regulation and blue for down-regulation. (b) Representative images of the coronal sections. C57/BL6J mice (3–5 Mo) were treated with PLX5622 diet for 2 weeks, then switched to control diet for various repopulation time points. TUNEL+ cells are marked with white dots. (c) Quantification of TUNEL+ cell density from entire coronal sections (mean ± SEM). Animal used: Ctrl (n = 5), 0 D (n = 6), 4 D (n = 5), 14 D (n = 7), and 4 Mo (n = 3). Statistical tests used: unpaired t test (Ctrl versus 0 D), unpaired t test with Welch's correction (Ctrl versus 4 D), Mann–Whitney test (Ctrl versus 14 D), and unpaired t test (Ctrl versus 4 Mo). (d) Example of microglia (4 D) forming phagocytic cup around TUNEL+ cells (highlighted by arrow heads). This image is rendered using max projection from a series of z-stack confocal images. (e) 3D model rendered from a series of z-stack confocal images. (f) Quantification of TUNEL+ cells that are in the phagocytic cup of Iba1+ microglia. (g) Quantification of Iba1+ microglia that exhibited phagocytic cup. (h) Representative confocal images of Iba1+ microglia, either EdU+ or EdU−, showing colocalization with TUNEL at day 4. EdU was given via IP injection every 24 hours for 4 days during repopulation. (i) Quantification of the percentage of TUNEL+ microglia (Iba1+) that are either EdU+ or EdU− (mean ± SEM). Animal used: 4 D (n = 5). Unpaired t test was used to compute statistical differences. P value is summarized as ns (P > 0.05), *(P ≤ 0.05), **(P ≤ 0.01), ***(P ≤ 0.001), and ****(P ≤ 0.0001). Individual numerical values can be found in S1 Data. Ctrl, control; D, days; EdU, 5-Ethynyl-2′-deoxyuridine; Iba1, ionized calcium binding adaptor molecule 1; IP, intraperitoneal; Mo, months; PLX, PLX5622; STRING, Search Tool for the Retrieval of Interacting Genes/Proteins.
Fig 9
Fig 9. Homeostasis of adult newborn microglia is re-established through steady turnover.
(a) EdU pulse-chase experiment to determine the longevity of newborn microglia. C57BL/6J mice (3–5 Mo) were treated with PLX5622 diet for 2 weeks and switched to a normal diet. EdU was injected via IP every 24 hours during the first 4 days of repopulation. Mice were analyzed after repopulation of 14 D, 1 Mo, 2 Mo, and 4 Mo. (b) Stitched coronal section showing microglia density. Iba1+ cells are visualized by white dots. (c) Stitched coronal section showing the density of EdU+ cells. EdU+ cells are visualized by green dots. (d) Zoomed in images from the cortical region (box “d” in panel c) showing colocalization of Iba1+ microglia (red) and EdU (green). Iba1+EdU+ cells are highlighted with white arrowheads. (e) Number of EdU+Iba1+ cells (orange line) and EdU+Iba1− cells (blue line) over time is fitted with nonlinear model: 1-phase exponential decay. Cell density (mean ± SEM) was quantified using the entire coronal area, as shown in panel c. T1/2 indicates half-life (days) for each population. Animals used: 14 D (n = 4), 1 Mo (n = 6), 2 Mo (n = 6), and 4 Mo (n = 3). (f) Linear regression showing the correlation between the decay of EdU+Iba1+ cells (x-axis) and the decay of total microglial cells (y-axis). R2 = 0.8579. (g) Quantification of Iba1+ microglial density using entire coronal area as shown in panel (b) (mean ± SEM). Animals used: 14 D (n = 4), 1 Mo (n = 6), 2 Mo (n = 6), and 4 Mo (n = 3). One-way ANOVA with Dunnett's multiple comparisons test was used by comparing to the Ctrl group. P value is summarized as ns (P > 0.05), *(P ≤ 0.05), **(P ≤ 0.01), ***(P ≤ 0.001), and ****(P ≤ 0.0001). Individual numerical values can be found in S1 Data. Ctrl, control; D, days; EdU, 5-Ethynyl-2′-deoxyuridine; Iba1, ionized calcium binding adaptor molecule 1; IP, intraperitoneal; Mo, months; PLX, PLX5622.
Fig 10
Fig 10. A model for the transitions from microgliogenesis to homeostatic establishment.
Microglia are expanded through self-renewal. First, the proliferation of repopulating microglia partially requires the NF-κB pathway. Next, newborn microglia recolonize the parenchyma forming stable spatial clusters once the cell proliferation is completed. During this process, newborn microglia re-established maturity in a process that involves mitosis, apoptosis, and IFN pathway activation. Expression of mature markers such as P2RY12, TMEM119, and MafB is restored. Finally, microglia re-establish steady-state density through passive egress of excessive newborn cells. IFN, interferon; MafB, V-maf musculoaponeurotic fibrosarcoma oncogene homolog B; NF-κB, nuclear factor kappa-light-chain-enhancer of activated B cells; P2RY12, Purinergic Receptor P2Y12; TMEM119, Transmembrane Protein 119.

References

    1. Goldmann T, Wieghofer P, Jordao MJ, Prutek F, Hagemeyer N, Frenzel K, et al. Origin, fate and dynamics of macrophages at central nervous system interfaces. Nat Immunol. 2016;17(7):797–805. 10.1038/ni.3423 - DOI - PMC - PubMed
    1. Li Q, Barres BA. Microglia and macrophages in brain homeostasis and disease. Nat Rev Immunol. 2018;18(4):225–42. 10.1038/nri.2017.125 . - DOI - PubMed
    1. Prinz M, Priller J. Microglia and brain macrophages in the molecular age: from origin to neuropsychiatric disease. Nat Rev Neurosci. 2014;15(5):300–12. 10.1038/nrn3722 . - DOI - PubMed
    1. Kierdorf K, Erny D, Goldmann T, Sander V, Schulz C, Perdiguero EG, et al. Microglia emerge from erythromyeloid precursors via Pu.1- and Irf8-dependent pathways. Nat Neurosci. 2013;16(3):273–80. 10.1038/nn.3318 . - DOI - PubMed
    1. Ginhoux F, Greter M, Leboeuf M, Nandi S, See P, Gokhan S, et al. Fate mapping analysis reveals that adult microglia derive from primitive macrophages. Science. 2010;330(6005):841–5. 10.1126/science.1194637 - DOI - PMC - PubMed

Publication types

MeSH terms