. 2019 Feb 8;14(2):e0209759.
doi: 10.1371/journal.pone.0209759. eCollection 2019.

Control of basal autophagy rate by vacuolar peduncle

Affiliations

Control of basal autophagy rate by vacuolar peduncle

Marc Bourouis et al. PLoS One. .

Abstract

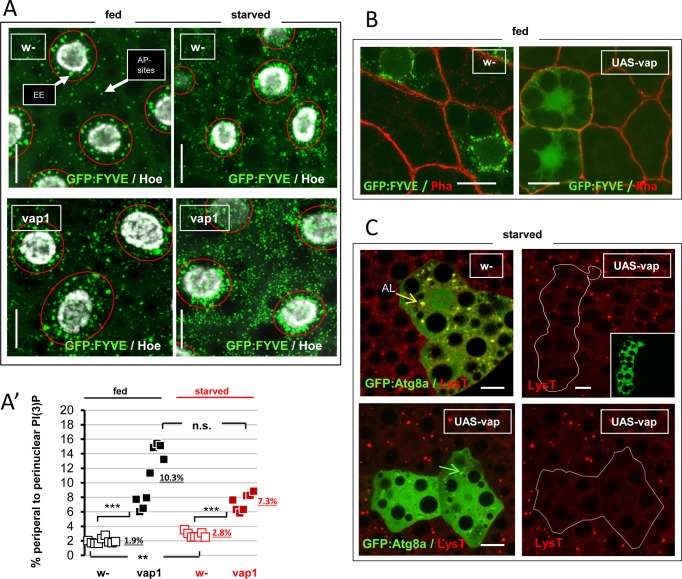
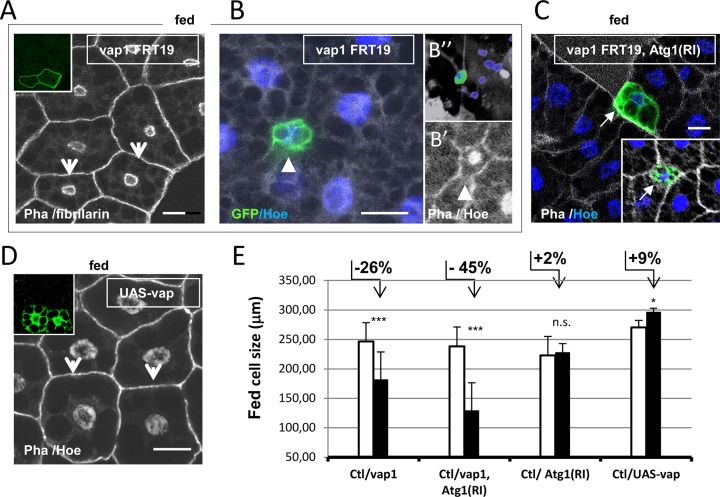
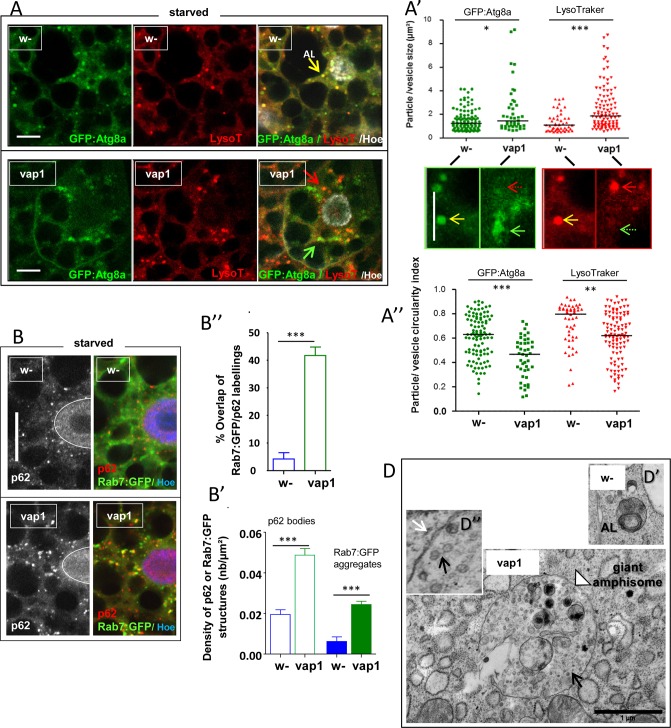
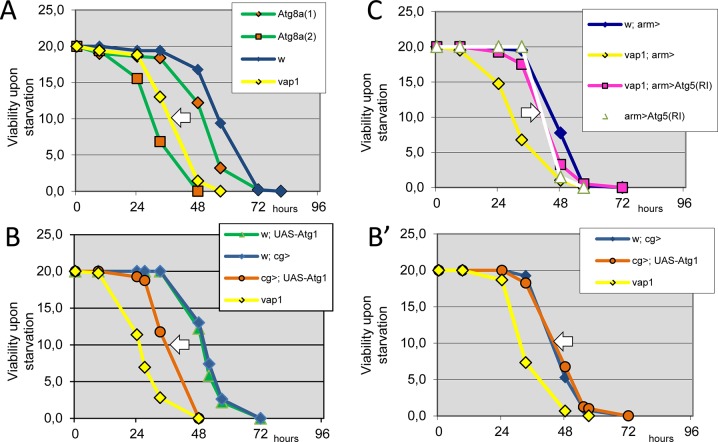
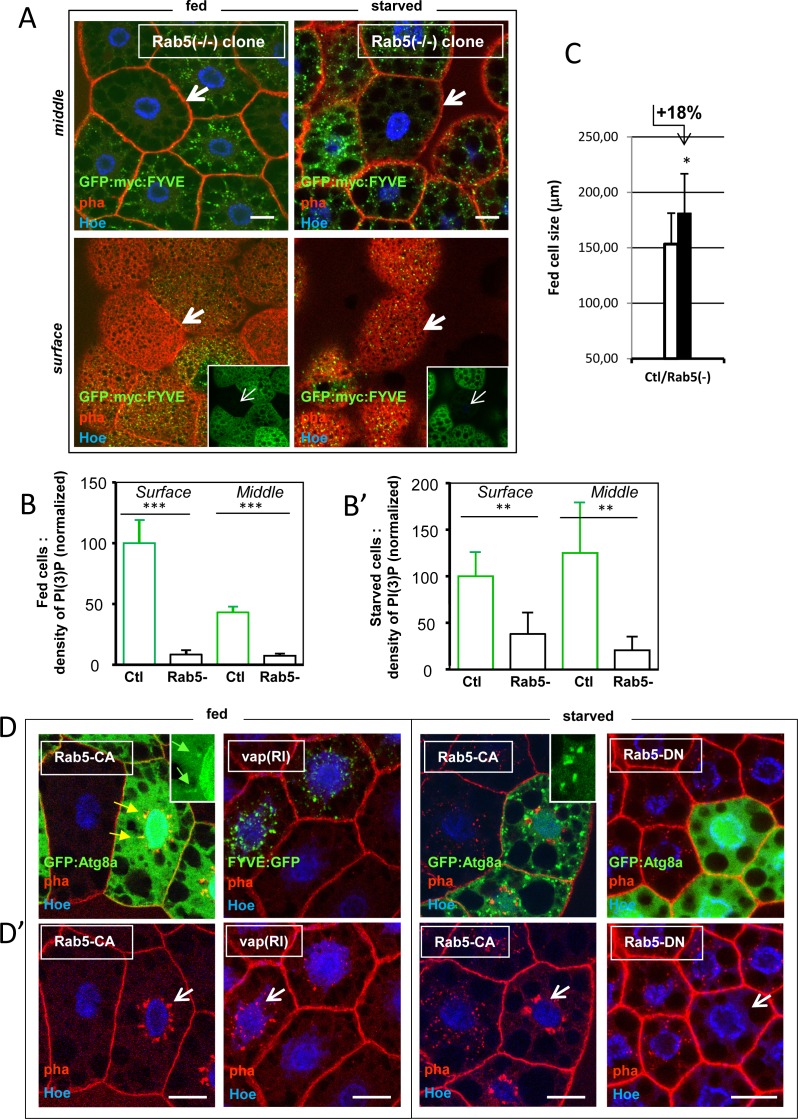
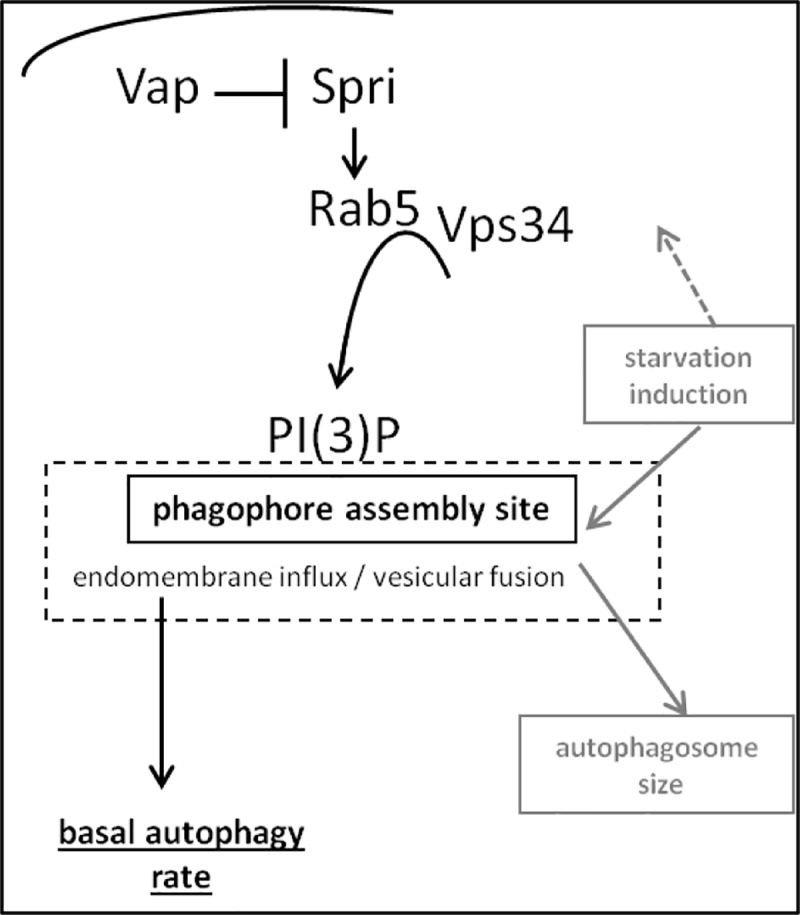
Basal autophagy is as a compressive catabolic mechanism engaged in the breakdown of damaged macromolecules and organelles leading to the recycling of elementary nutrients. Thought essential to cellular refreshing, little is known about the origin of a constitutional rate of basal autophagy. Here, we found that loss of Drosophila vacuolar peduncle (vap), a presumed GAP enzyme, is associated with enhanced basal autophagy rate and physiological alterations resulting in a wasteful cell energy balance, a hallmark of overactive autophagy. By contrast, starvation-induced autophagy was disrupted in vap mutant conditions, leading to a block of maturation into autolysosomes. This phenotype stem for exacerbated biogenesis of PI(3)P-dependent endomembranes, including autophagosome membranes and ectopic fusions of vesicles. These findings shed new light on the neurodegenerative phenotype found associated to mutant vap adult brains in a former study. A partner of Vap, Sprint (Spri), acting as an endocytic GEF for Rab5, had the converse effect of leading to a reduction in PI(3)P-dependent endomembrane formation in mutants. Spri was conditional to normal basal autophagy and instrumental to the starvation-sensitivity phenotype specific of vap. Rab5 activity itself was essential for PI(3)P and for pre-autophagosome structures formation. We propose that Vap/Spri complexes promote a cell surface-derived flow of endocytic Rab5-containing vesicles, the traffic of which is crucial for the implementation of a basal autophagy rate.


Conflict of interest statement

The authors have declared that no competing interests exist.

Figures

Fig 1
Fig 1. Perturbations of animal fitness and basal, or starvation-induced autophagy in vap mutants.
(A) The total amount of TAG in aged-matched samples of adult male flies grown in rich food was compared between control, w- and mutant, vap1 and vap2 (n = 4). Mutants showed diminished TAG stores. (B) The mass of adults male flies was compared in aged-matched samples when grown in rich food or poor food (aa-rich or aa-poor conditions, Materials and Methods) (n = 5–8). Mutants had chronic mass deficits in rich conditions. Mutant flies emerged 10h in advance compared to controls but had quite limited mass deficits when grown in poor food conditions. The same effects were observed in females. In A-B, error bars are mean differences; significances are from Student’s t-tests. (C) Acidic lysosomal compartments were revealed by pH-sensitive LysoTracker staining in life tissue. Fat bodies in 96h, mid-3rd vap1 larvae but not control, w- showed punctuate fluorescent particles. Mutant fat bodies also exhibited reduced cell adhesion. Scale bar = 20 μm. Inset: higher magnification images. Scale bars = 10 μm. (C’) LysoTracker-positive punctate densities were evaluated on images obtained in C, using 72h and 96h samples (n = 2). Both time points showed abnormal occurrence of lysosomal staining in vap1. (D) Starvation-induced lysosomal response was analyzed in 72h, 2nd instar larvae subjected to complete food deprivation for 3h. Fat bodies of control, w- showed frequent LysoTracker-positive vesicles but mutant, vap1 fat bodies elicited a stronger response, including the presence of many large acidic particles (compare image in insets; Scales as in C). Similar effects were seen in vap2 and vap3 mutants. (D’) The size distribution of LysoTracker positive punctate in experiment in D was quantified. The size of punctate particles of two wide field images obtained from identically stained tissues, counting 192 particles (w-) and 488 particles (vap1) were analyzed and graphed as boxplots. Mutant tissue shows particles spanning a larger size range (w-, Mdn = 0.80 μm2; vap1, Mdn = 1.68 μm2). See S1A Fig for complete size distribution of the particles. Medians are drawn as thick lines; significance is from Mann Whitney test. Genotypes. (A, B) Control: w1118/Y. Assay: vap1/Y. vap2/Y. (C, C’, D, D’) Control: w1118/Y. Assay: vap1/Y.
Fig 2
Fig 2. Loss of vap disturbs PI(3)P homeostasis in fed and starved cells.
(A) Cg-Gal4-driven expression of the GFP:FYVE biosensor was performed in control, w- and mutant, vap1 fat cells, and images recorded from stage-matched early/ mid-3rd instar live tissues form fed or 3h-starved animals. PI(3)P specific sub-pools comprising perinuclear early-endosomes (EE) and cytoplasmic-dispersed autophagy sites (AP sites), were delimited by red rings used for quantification following a setup described in [34] and S2C Fig, and graphed in details in S1B Fig. As noticed previously [34], starvation for 3h caused an elevation of the GFP:FYVE staining of both PI(3)P sub-pools, as found here in control, w- cells and in mutant, vap1 cells. Scale bars = 20 μm. (A’) Relative changes of cytoplasmic vs perinuclear PI(3)P were scored here. The respective GFP+ areas in selected acquisitions encompassing 3–4 cells and 7–9 depth sections each (corrected for nuclei numbers), were plotted. Underlined numbers are the mean relative percentage of cytoplasmic PI(3)P fractions in indicated categories. Control, w- fed: 1.9% (+/- 0.37) and starved: 2.8% (+/- 0.40). Mutant vap1 fed: 10.3% (+/- 3.9) and starved: 7.3% (+/- 1.2). The cytoplasmic PI(3)P fractions of vap1 fed and starved cells is significantly increased compared to controls: Fed, vap1 vs control, w- = 5 fold increase (p<0.0001). Starved, vap1 vs control, w- = 3 fold increase (p<0.001). In controls, starvation produced low but significant elevation of the relative cytoplasmic PI(3)P fraction (2.8% vs 1,9%; p<0.002). No starvation mediated elevation or clear decline is observed in vap1 cells (7,3% vs 10,3%; p>0.05). Note the dispersion of values in mutants as often the case. Significances are from Student’s t-tests. (B) Clonal expression of an UAS-vap wild-type transgene in fed larval fat body cells in the presence of the GFP:FYVE biosensor was induced using the Act>CD2>Gal4 flipout cassette method. When compared to control, w- clones, clonal excess of Vap produced a complete absence of perinuclear GFP with rare remaining PI(3)P spots at the cell periphery. Scale bars = 20 μm. (C) Clonal expression of an UAS-vap(wt) transgene in the presence of the autophagosome marker GFP:Atg8a in larval fat cells was obtained as above, but larvae were starved for 3h and cells were additionally stained with LysoTracker red. Clones with excess Vap (inset and delimited by white lines) shows fewer or not any stained lysosomes (Top and bottom right panels respectively) compared to the wild-type neighboring cells, whereas GFP:Atg8a-labeled autophagomes is reduced to tiny GFP:Atg8a-positive structures (green arrow) as compared to starvation-induced autolysosomes (AL, yellow arrow) in control, w- clones. Scale bars = 20 μm. Genotypes. (A) Control: w1118/Y; cg-GAL4/ UAS-GFP:myc:2xFYVE. Assay: vap1/Y; cg-GAL4/ UAS-GFP:myc:2xFYVE. (B) Control: w1118/ hsFLP12; UAS-GFP:myc:2xFYVE, Act>CD2>GAL4/+. Assay: w1118/ hsFLP12; UAS-Vap:myc16.4/+; UAS-GFP:myc:2xFYVE, Act>CD2>GAL4/+. (C) Control: w1118/ hsFLP12; Act>CD2>GAL4, UAS-GFP:Atg8a/+. Assay: w1118/ hsFLP12; UAS-Vap:myc16.4/+; Act>CD2>GAL4, UAS-GFP:Atg8a/+.
Fig 3
Fig 3. Fat cell clones of manipulated vap activity showed growth competitive phenotypes.
(A) Clonal loss of vap in fat bodies of well-fed animals was generated by the MARM, GFP-positive labeling technique and analyzed in mid-3rd larvae. Clonal vap1 cells (inset and arrows) grown for ca. 88h, shows autonomous cell size reduction compared to wild-type neighboring cells used as controls (Ctl). (B) An extreme case of disfavored growth of a vap1 mutant clone in the process of active elimination (size diminished by 60% and corresponding reduction of nucleus size). (B’) Mutant cell lost part of the phalloïdin-labeled actin cytoskeleton at a cellular contact (arrowhead). (B‘‘) A similar clone in the process of nuclear fragmentation is extruded from the tissue. (C) Doubly mutant clones of vap1 and tubulin-Gal4 driven Atg1(RI) cells, were generated in fed animals and analyzed as in A (inset: a distinct clone). If anything, these shows enhanced cell size reduction rather than suppression of cell growth. Such a synergism could be related to the autophagy-independent requirement of Drosophila Atg1 [43]. Atg1(RI) expression alone in these conditions has not detectable effects (E). See validation of experimental setting and used Atg1(RI) construct in S3A Fig. (D) Clonal expression of an UAS-vap(wt) transgene in larval fed fat body cells was achieved using the Act>CD2>Gal4 flipout cassette method. A mild and autonomous increase in cell size is observed. Scale bars in all panels = 20 μm. (E) Relative cell-size changes of manipulated cell clones in A-D were quantified. Lengths of the cell contours (in μm) were determined from images of the clones and compared to wild-type cells contours in the same images. MARCM and flipout genetic setting resulted in normal sized GFP-positive cells. (Clt n = 23 /vap1 n = 13; Ctl n = 14 /vap1, Atg1(RI) n = 10; Ctl n = 8 /Atg1(RI) n = 8; Ctl n = 10 /UAS-vap n = 12). Error bars are mean differences; significances are from Student’s t-tests Genotypes. (A-B”) vap1, FRT19A / tub-GAL80, hsFLP1, FRT19A; UAS-CD8:GFP/+; tub-GAL4/+. (C, E) Control: FRT19A / tub-GAL80, hsFLP1, FRT19A; UAS-CD8:GFP/+; tub-GAL4/ UAS-Atg1(RI). Assay: vap1, FRT19A / tub-GAL80, hsFLP1, FRT19A; UAS-CD8:GFP/+; tub-GAL4/ UAS-Atg1(RI). (D) Assay: w1118/ hsFLP12; UAS-Vap:myc16.4/+; Act>CD2>GAL4, UAS-GFP/ +.
Fig 4
Fig 4. Loss of vap alters starvation-induced autophagy-membrane biogenesis.
(A) The autophagosome marker GFP:Atg8a was expressed in control, w- or vap1 fat bodies using a cg-Gal4 driver, and mid-3rd instar larvae were starved for 1h30’. Fat bodies were dissected and stained LysoTracker red for an immediate observation of live tissue. Shown, are comparable images of control, w- and mutant, vap1 cells, which respectively scored 14 yellow vesicles depicting fused autolysosomes (AL) out of 52 total vesicles, and 1 yellow vesicle out of 51 total vesicles, indicating that no or rare autolysosomes had formed in the mutant. LysoTracker red signal area intersecting GFP:Atg8a signal area was 77,3% in control and only 2,3% in vap1 confirming the lack of fused structures. Scale bars = 10 μm. (A’, A”) Green and red vesicular-membrane signals were extracted from similar images and their size (in μm2) and circularity index (1.0 for perfect circles; 0.0 for elongated polygons) graphed as scatter plots (w-: n = 106 green vesicles, n = 49 red vesicles; vap1: n = 43 green vesicles, n = 107 red vesicles). Below are enlarged pictures of green and red single channel images for w- and vap1 respectively. Yellow arrows point to autolysosomes in w-. Green and red arrows point to autophagosome membranes and lysosome respectively, in vap1. Dotted arrows emphasize the absence of vesicular fusion. Scale bar = 10 μm. In A’, control, w- green and red vesicles has relatively packed distribution as a fraction of them derive from same autolysosomes. Mutant vap1 cells has non-fused green and red membranes (or vesicles) which are of larger sizes and wider distributions (green vesicles Mdn = 1,46 μm2 in vap1 vs 1,25 μm2 in controls; red vesicles Mdn = 1,86 μm2 in vap1 vs 1,10 μm2 in controls). These differences correlate with a decreased circularity index of the mutant particles in A” (green vesicles Mdn = 0,47 in vap1 vs 0,63 in controls; red vesicles Mdn = 0,62 in vap1 vs 0,79 in controls), indicating that mutant autophagosomes and lysosome membranes were wider and of uneven shapes. Medians are drawn as lines; significances are from Mann Whitney test. (B) The late endosome Rab7:GFP marker was expressed in control, w- and mutant, vap1 larval fat bodies using a cg-Gal4 driver and 3h-starved fat cells were analyzed. Endogenous p62/SQSTM1 flux marker was detected by immunostaining. In control, w- starved cells, fine p62 bodies (grey or red) are detected over the cytosol whereas Rab7:GFP aggregates are forming independently of them. In vap1 cells both the density (B’) and size range of p62 bodies and Rab7:GFP aggregates (S1D and S1D’ Fig) are increased and the two markers match frequently (B”), suggesting accumulation of unresolved maturation intermediates in the mutant. Scale bar = 20 μm. (B’) The densities for p62 bodies and Rab7:GFP aggregates were compared in a selections of fat body cells samples of defined areas of control and mutant cell in B (w- n = 8, vap1 n = 13). Error bars are standard errors; significances are from ANOVA. (B”) The overlap between Rab7:GFP and p62 staining was determined in the set of cells used in B’. Rab7:GFP signal areas intersecting p62-positive pixels were expressed relative to total p62 staining areas. Significant intersections are only found in the case of starved vap1 cells. Error bars are standard errors; significances is from Student’s t-tests. (D-D”) TEM semi-quantitative analysis of autophagy structures found in fat body cells of 2h-starved early/mid-3rd instar of control, w- and vap1 mutant (Table C in S5 Fig). Control, w- shows typical degradative autolysosomes (AL in D’; scale as in mutant below) of ca. 0.5 μm in size (28 cases of AL out of 41 scored autophagy-related structures). No autolysosomes were detected in vap1 samples. Instead, large hybrid organelles (arrowhead: giant amphisome) of greater than 2 μm are observed (14 giant amphisomes cases out of 38 scored autophagy-related structures). These have single-bilayered membranes (D” inset: white arrow) and are filled with intraluminal, electron-clear vesicles (black arrow) akin those of MVB (multivesicular bodies). These structures appear to match the accumulated maturation intermediate detected in B. Scale bar = 1 μm. Genotypes. (A) Control: w1118/Y; cg-GAL4/ UAS-GFP:Atg8a/+. Assay: vap1/Y; cg-GAL4/ UAS- GFP:Atg8a/+. (B, C, C’) Control: w1118/Y; cg-GAL4/ UAS-Rab7:GFP/+. Assay: vap1/Y; cg-GAL4/ UAS-Rab7:GFP/+. (D) Control: w1118/Y. Assay: vap1/Y.
Fig 5
Fig 5. Starvation-sensitivity assays define the range of autophagy defects in vap flies.
The survival rate of 3 day-old adult males of indicated genotypes was recorded at 25°C in condition of complete food deprivation (see S4A–S4C Fig for initial characterization). (A) The vap-dependent starvation sensitivity (white arrow) was compared to weak (Atg8a1) and strong (Agt8a2) alleles of Atg8a. Atg8a2 flies showed slightly altered development that might contribute to its greater sensitivity to starvation. (B-B’) Starvation sensitivity effect, as assayed at 25°C, is partially recapitulated by flies that were ectopically expressing an UAS-myc:Atg1 transgene (Materials and Methods) along fat cell development performed at 25°C (white arrow in B) when driven by cg-Gal4. As a control, there is no detectable starvation sensitivity (as assayed at 25°C) using identical flies (UAS-myc:Atg1 /cg-Gal4) that developed at 18°C to minimized transgene expression (white arrow in B’). Ectopic expression of Atg1 during development is therefore responsible for the sensitivity effect found in B. (C) The vap-dependent starvation sensitivity is suppressed (white arrow) by co-expressed Atg5(RI) using the broadly expressed arm-Gal4 driver. Genotypes. (A) Control: w1118/Y. Assay vap1/Y. Atg8a1/Y. Atg8a2/Y. (B, B’) Control: UAS-myc:Atg1/+ and vap1/Y and vap1/Y; cg-GAL4/+. Assay: vap1/Y. cg-GAL4/ UAS-myc:Atg1(RI)/+. (C) Control: arm-GAL4/+ and vap1/Y; arm-GAL4/+ and arm-GAL4/ UAS-Atg5(RI)/+. Assay: vap1/Y; arm-GAL4/ UAS-Atg5(RI)/+.
Fig 6
Fig 6. Sprint appears to be dispensable for starvation-induced autophagy.
(A) Clones of spri(RI) fat cell or control, w- were generated together with GFP:Atg8a autophagosome marker expression, using the Act>CD2>Gal4 flipout cassette method. Larvae were starved for 3h, and fat body stained with LysoTracker red when needed. spri mutant cells shows autophagosomes of reduced size compared to that of control, w- cells. (B) spri(RI) clonal cells (delimited by a white line) shows small-sized or tiny lysosomes as stained with LysoTracker red. (C) A close view of autophagy vesicles shows fused ‘yellow’ autolysosomes (arrows) in control, w-whereas mutant spri(RI) forms small but fused autolysosomes (arrows) and more sporadically, none-fused but tethered autophagosome and lysosome vesicles (arrows and S1 Table). (D) spri(RI) clonal cells were stained for the ESCRT-0 early endosome marker Hrs, showing perinuclear accumulation of these structures (arrowhead) as compared to control nearby cells (arrow). This either resulted from blocked progression into endosomal MVB (as intraluminal vesicles formation of MVB requires PI(3)P for scission from the surface [53]), or else from ineffective maturating fusion of autophagosome to the MVB [78]. (E) Clones of spri(RI) fat cell or control, w- were generated together with the GFP:FYVE biosensor, using the Act>CD2>Gal4 flipout cassette method. Fed or 3h-starved early/mid-3rd instar larvae were analyzed in fixed tissues. Fed spri-silenced cells form fine PI(3)P foci at the periphery and the perinuclear pools of PI(3)P is reduced compared to control (red circles for delimitation of the pools, see S2C Fig). Free GFP:FYVE fluorescent probe remains in the cytosol and nucleus as in the case of UAS-vap wild-type transgene expression (Fig 2B). Upon starvation, spri-silenced cells partly recovered from these defects, including the formation of new perinuclear PI(3)P pools. The phenotype is subjected to variation (S1 Table). A detailed quantification is found in S5B Fig. (F, F’) Clonal spri(RI) cells developed in normally fed animal has mild increased size. Cell size was quantified relative to neighboring control cells as in Fig 3. (Clt n = 24; spri- n = 21). Error bars are mean differences; significance is from Student’s t-tests. Scale bars in all panels = 20 μm. Genotypes. (A-D, F, F’) Control: w1118/ hsFLP12; +/+; Act>CD2>GAL4, UAS-GFP:Atg8a/+. Assay: w1118/ hsFLP12; UAS-spri(RI)/ +; Act>CD2>GAL4, UAS-GFP:Atg8a/+. (E) Control: w1118/ hsFLP12; UAS-GFP:myc:2xFYVE, Act>CD2>GAL4/+. Assay: w1118/ hsFLP12; UAS-spri(RI)/ +; UAS-GFP:myc:2xFYVE, Act>CD2>GAL4/+.
Fig 7
Fig 7. Sprint is essential for the starvation-sensitivity phenotype of vap.
The genetic relationship between vap and spri mutants was evaluated using the starvation-sensitivity set up as in Fig 5 and S4 Fig. Females of indicated genotypes were used to record for survival upon complete nutritional deprivation at 25°C. The strong sensitivity to starvation of vap2 mutants is suppressed when combined to the spri6G1-null mutants (white arrow). Thus, Spri acts after Vap. When in the vap mutant context, spri heterozygous flies (vap-/-, spri-/+) shows midway suppression (grey arrow), and thus dosage effect of spri+. Single mutant spri6G1 or double mutant vap2, spri6G1 has greater resistance than control. Male genotypes resulted in all the same effects. Genotypes. Control females: w1118/ w1118. vap2/ vap2. spri6G1/spri6G1. Assay females: vap2, spri6G1/ vap2, spri6G1. vap2, spri6G1/ vap2, +.
Fig 8
Fig 8. Regulation of Rab5-positive vesicle formation in the endocytic compartment of fat cells.
(A) The Rab5:GFP tracer was expressed in control, w- or vap1 fat bodies using cg-Gal4. Mid-3rd instar larvae were starved for 4h before staining of the fat tissue with LysoTracker and live cells analysis. Compared to control, w- cells, vap1 cells shows enhanced vesicular Rab5 trafficking near the cell membrane (green arrows). Scale bars = 20 μm. (B, B’) Cortical and endocytic compartment organization of fat body cells. Control strain, w- was used to express a GFP:Spri transgene using a cg-Gal4 driver. Fed fat cells or 1h30’-starved cells of early-3rd instar larvae were analyzed after immunostaining for Rab5, and F-actin (Pha) plus nuclei (Hoe) labeling. Each panel shows: (Top) Z-sections images of dome-shaped fat cells reconstituted from serial XY optical sections exemplified below. (Below left images) Colored surface plan views shows the distribution of GFP:Spri present as spots close to the plasma membrane. (Below right images) Underneath plan section view of Rab5 (grey scale or red) carried along the dotted lines shown in the Z section views. Scale bars in Z and plan sections = 10 μm. The GFP:Spri labeling is imbricate with the cortical F-actin stain (blue) above the vesicular Rab5 staining (Rab5 signal overlapped 2,6% of GFP:Spri signal). Insets: high magnification images. Scale bars = 2.5 μm. In B’, Rab5-positive vesicles are clearly increased after short starvation period (Rab5 signal overlapped 11.7% of GFP:Spri signal). Scale bars as in B. (D-D”) GFP:Spri and myc-tagged Vap were coexpressed from an Act-Gal4 driver in fat cell clones of fed control, w- animals. A plan surface view reveals the GFP:Spri spots together with immunostained Vap:myc proteins in red (also shown in the respective gray scale images). Vap-specific staining overlapped 8% of GFP:Spri signal (yellow arrows) as determined in wide field images. Spri proteins were found engaged with several partners of the cell cortex [79] and only phospho-Tyrosylated Spri associated to Vap [48]. This may account for the relatively low coincidence of the two proteins. Scale bar = 2 μm. (C, C’) The density of endocytic Rab5-positive vesicles was quantified in control and mutant fat bodies. Experimental setting was exactly as in B, but used the genotype given below. Single plan images along the dotted line in the Z views were used to measure Rab5-positive vesicle densities (numbers of vesicles per μm2 of cellular area) as taken from wide field images. Values were normalized to the fed control, w-; cg-Gal4/+. Data using three different GFP:Spri transgenes were pooled. spri6G1-null cells were analyzed as above but the GFP:Spri transgene was omitted. In fed cells, the absence of vap causes in an elevation of ca. 2 fold of the Rab5-positive vesicle density, whereas the loss of spri results in a 6 fold reduction of vesicle density. Starvation is associated with a rise of 2.2 fold of vesicular Rab5 in control cells and this is not significantly different in the vap or spri mutant cells.(w- fed, n = 13; vap1 fed, n = 5; spri6G1 fed, n = 3; w- sta, n = 13; vap1 sta, n = 5; spri6G1 sta, n = 3). Error bars are standard errors; significances are from ANOVA. Genotypes. (A) Control: w1118/Y; cg-GAL4/ UAS-Rab5:GFP/+. Assay: vap1/Y; cg-GAL4/ UAS-Rab5:GFP/+. (B, B’) Assay: w1118/Y; cg-GAL4/ UASp-GFP:Spri9M. (C, C’) Control: w1118/Y; cg-GAL4/+; UASp-GFP7M or 8M or 9M/+. Assay: vap1/Y; cg-GAL4/+; UASp-GFP:Spri7M or 9M/+. spri6G1/Y; cg-GAL4/+. (D) Assay: w1118/ hsFLP12; UAS- Vap:myc16.4/ UASp-GFP:Spri9M; Act>CD2>GAL4/+.
Fig 9
Fig 9. Rab5 is required for early events during autophagosome biogenesis.
(A) Clones of fat body cell deprived of any Rab5 product were generated by heat shock-Flp/FRT mitotic recombination of the Rab52-null, deletion allele, in fed or 2h-starved animals in presence of myc-tagged PI(3)P biosensor (GFP:myc:FYVE) expressed in every fat-body cells. Anti-myc immunostaining (in green) was used to detect the biosensor in fixed tissue. Inset: identified GFP-, Rab5-/- clones. In fed cells, both perinuclear and dispersed cytoplasmic PI(3)P is absent from mutant cells (arrows pointing two plans of same clones). Little but detectable PI(3)P labeling persists in the Rab5-/- cells of 2h-starved animals. Scale bars = 20 μm. S8 Fig for single channels. (B, B’) The myc labeling of tagged GFP:FYVE of surface or middle cell plans of Rab5-/- clones was quantified relative to neighboring control cells in both fed and starved cells samples of A (fed GFP- n = 3, fed GFP+ n = 6; sta GFP- n = 3, sta GFP+ n = 6). Fed, Rab5-null cells has negligible amount of PI(3)P. 2h-starved cell shows 1/3 to 1/8 of residual PI(3)P labeling in the Rab5 mutant cells (surface or middle plans respectively). Error bars are standard errors; significances are from Student’s t-tests. (C) The cell size of Rab5-null cells is increased in identified clone of fed animals compared to neighboring wild-type cells. Data from A were quantified as in Fig 3E (Ctl n = 23; Rab5-/- n = 10). Error bars are mean differences; significance is from Student’s t-tests. (D-D’) Clones of Rab5-CA, vap(RI) or Rab5-DN cells were generated together with the GFP:Atg8a or GFP:FYVE markers expression, using the Act>CD2>Gal4 flipout cassette method. Fed or 3h-starved fat cells of early/mid-3rd instar were analyzed in fixed tissues. Fluorescent GFP and phalloïdin are shown in panel D, and phalloïdin-labeled actin structures are shown panel D’. In fed animals, Rab5-CA clones induces excessive actin-labeled phagophore network (or PhAS, white arrow in D’). These overlapped with GFP:Atg8a-labeled isolation membranes (yellow arrows in D or green arrows in inset). In the same conditions, vap(RI) clones leads to equivalent excess of actin-labeled PhAS formation (arrow). Upon starvation, Rab5-CA clones formed plenty of induced-autophagosomes. Those were abnormal in shape (inset: enlarged picture) and were not overlapping with the large PhAS network (arrow in D’). Analysis of the Rab5-CA-induced green-vesicle signal (Materials and Methods) revealed that mutant cells has an 2.8 time higher density in autophagosomes compared to wild-type controls; median size: Rab5-CA, Mdn = 0,931 μm2 (n = 411); control, w- Mdn = 1,238 μm2 (n = 158). Total amount of autophagy-membranes areas are thus doubling in the Rab5-CA expressing cells. Inhibition of Rab5 in Rab5-DN expressing clones prevents the formation of starvation-induced autophagosomes and that of endogenous actin-labeled PhAS (arrow in D’). Scale bars in all panels = 20 μm. Genotypes. (A) Assay: w1118/ hsFLP12; Rab52, FRT40A/ 2xUAS-EGFP, FRT40A, Fb-GAL4; UAS-GFP:myc:2xFYVE/+. (D) Assay: w1118/ hsFLP12; UAS-GFP:myc:Atg8a, Act>CD2>GAL4/ UAS-Rab5CA. w1118/ hsFLP12; UAS-vap(RI-KK)/ +; Act>CD2>GAL4, UAS-GFP:myc:2xFYVE/+. w1118/ hsFLP12; UAS-GFP:Atg8a/, Act>CD2>GAL4/ UAS-Rab5DN.
Fig 10
Fig 10. A model for the generation of basal autophagy and its coupling to stimulated autophagy.
In fat body tissue, endocytic cell-compartment contains Rab5-positive vesicles issued partly by the activity of Vap/Spri modules. Here, the RasGAP homolog Vap (Vacuolar Peduncle), negatively regulates the Rab5-GEF partner, Spri (Sprint). Autophagy competent Rab5-vesicles drive nucleation of pre-autophagosome structures evolving into phagophores at multiple ER sites called omegasomes. This sets the foundation of the double-layered membranes of the autophagosome organelles. Rab5-vesicles “competence” presumably involves the recruitment or activation of proautophagy-competent Vps34 complexes (or Vps34-complex I) and translocation to omegasomes, ending in a local stimulation of PI(3)P synthesis and nucleation of proportionate PAS and phagophore components [76] (i.e. higher PI(3)P synthesis promotes larger phagophores; see text). In normal fed cells, microscopic autophagosomes are manufactured from extant phagophores and these assume a basal autophagy rate (black arrow downward). On starvation, Rab5-vesicle density is increased (dashed grey arrow) causing further phagophore inflation, which is modeled on its extant architecture. Starvation-induced autophagosome size is therefore a reflection of fed-cell phagophore size. The parallel formation of endosomal membranes is not represented.

References

    1. Levine B, Kroemer G. Autophagy in the pathogenesis of disease. Cell [Internet]. 2008. January 11;132(1):27–42. Available from: http://www.ncbi.nlm.nih.gov/pubmed/18191218 - PMC - PubMed
    1. Ravikumar B, Sarkar S, Davies JE, Futter M, Garcia-Arencibia M, Green-Thompson ZW, et al. Regulation of mammalian autophagy in physiology and pathophysiology. Physiol Rev [Internet]. 2010;90(4):1383–435. Available from: http://www.ncbi.nlm.nih.gov/pubmed/20959619 - PubMed
    1. Meléndez A, Neufeld TP. The cell biology of autophagy in metazoans: a developing story. Development. 2008;135(14):2347–60. 10.1242/dev.016105 - DOI - PMC - PubMed
    1. Knævelsrud H, Simonsen A. Fighting disease by selective autophagy of aggregate-prone proteins. FEBS Lett [Internet]. 2010. June 18;584(12):2635–45. Available from: http://www.ncbi.nlm.nih.gov/pubmed/20412801 - PubMed
    1. Komatsu M, Waguri S, Ueno T, Iwata J, Murata S, Tanida I, et al. Impairment of starvation-induced and constitutive autophagy in Atg7-deficient mice. J Cell Biol. 2005;169(3):425–34. 10.1083/jcb.200412022 - DOI - PMC - PubMed

Publication types

Substances

LinkOut - more resources