. 2019 Feb 8;14(2):e0211943.
doi: 10.1371/journal.pone.0211943. eCollection 2019.

The organization of leukotriene biosynthesis on the nuclear envelope revealed by single molecule localization microscopy and computational analyses

Affiliations

The organization of leukotriene biosynthesis on the nuclear envelope revealed by single molecule localization microscopy and computational analyses

Angela B Schmider et al. PLoS One. .

Abstract

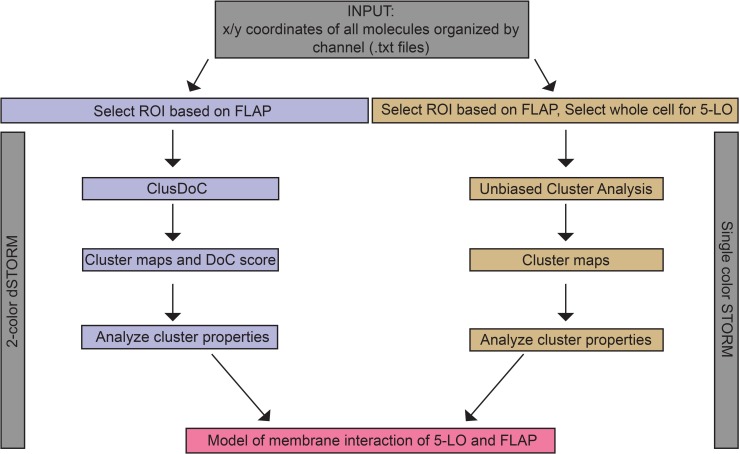
The initial steps in the synthesis of leukotrienes are the translocation of 5-lipoxygenase (5-LO) to the nuclear envelope and its subsequent association with its scaffold protein 5-lipoxygenase-activating protein (FLAP). A major gap in our understanding of this process is the knowledge of how the organization of 5-LO and FLAP on the nuclear envelope regulates leukotriene synthesis. We combined single molecule localization microscopy with Clus-DoC cluster analysis, and also a novel unbiased cluster analysis to analyze changes in the relationships between 5-LO and FLAP in response to activation of RBL-2H3 cells to generate leukotriene C4. We identified the time-dependent reorganization of both 5-LO and FLAP into higher-order assemblies or clusters in response to cell activation via the IgE receptor. Clus-DoC analysis identified a subset of these clusters with a high degree of interaction between 5-LO and FLAP that specifically correlates with the time course of LTC4 synthesis, strongly suggesting their role in the initiation of leukotriene biosynthesis.


Conflict of interest statement

The authors have declared that no competing interests exist.

Figures

Fig 1
Fig 1. Analysis workflow for measuring the properties of 5-LO and FLAP and their relationship on the nuclear envelope.
Initially, a .txt file with tab-delimited x/y coordinates of all localizations from both channels was generated. To analyze two-color dSTORM (purple), FLAP localizations were used to define a region of interest (ROI) around the nuclear envelope, which was also applied to 5-LO within the Clus-DoC user interface. Degree of colocalization (DoC) scores were calculated for each localization. DBSCAN detected clusters and defines cluster contours, yielding cluster maps and cluster properties. For conventional STORM (orange), FLAP localizations were used to define an ROI around the nuclear envelope, or in the perinuclear region and nucleus for 5-LO. Within unbiased cluster analysis, cluster maps with cluster properties are determined. Data from both methods were combined to produce a model of membrane reorganization of 5-LO and FLAP.
Fig 2
Fig 2. 5-LO and FLAP localization on the nuclear envelope on mast cell activation by two-color dSTORM.
RBL-2H3 cells (100,000 per well) were primed with anti-TNP IgE then activated with TNP-BSA for 0, 2, 5, 7, and 10 min, or left not treated (NT). Localization data was collected by two-color dSTORM. (A) Total media concentration of LTC4 (pg/mL) was measured by enzyme immunoassay. Mean ± SEM. Time points significantly different from 0 min (1-way ANOVA with Bonferroni post-hoc test) indicated by *p < 0.05, ****p < 0.0005. (B) Representative two-color STORM images of 5-LO (left panel, green) and FLAP (middle panel, red) following activation over time. Scale bar = 5 μm.
Fig 3
Fig 3. 5-LO and FLAP colocalize on the nuclear envelope by two-color dSTORM.
RBL-2H3 cells were primed with anti-TNP IgE then activated with TNP-BSA for 2, 5, 7 and 10 min, or left not treated (NT). Localization data was collected by two-color dSTORM and analyzed with ClusDoC. Data shown is from the representative cells shown in Fig 2. (A) Localization maps for 5-LO (green) and FLAP (red) (left panels) and colocalization maps for 5-LO relative to FLAP. 5-LO molecules are color-coded according to their degree of colocalization (DoC) scores (right panels, score bar at the bottom). (B,C) Histograms of DoC scores of all molecules for 5-LO (green) and FLAP (red) from representative cells at (B) 0 and (C) 7 min. (D) Percent colocalization of 5-LO molecules with FLAP from all ROIs (left panel; green) and percent colocalization of FLAP molecules with 5-LO from all ROIs (right panel; red). Statistical significance was assessed by Kolmogorov-Smirnov test, with significance indicated by *p < 0.05. Bars show mean ± SEM from 4 to 21 cells over 3 separate experiments.
Fig 4
Fig 4. Activation changes 5-LO and FLAP cluster properties by two-color dSTORM.
RBL-2H3 cells were primed with anti-TNP IgE then activated with TNP-BSA for 2, 5, 7, and 10 min, or left not treated (NT). Localization data was collected by two-color dSTORM and analyzed with Clus-DoC. Clusters were defined as having either ≥ 5 5-LO localizations or 10 FLAP localizations, and were split into 3 categories based on the number of founding localizations with a degree of colocalization (DoC) score ≥ 0.4 indicating interaction: no interaction clusters (NIC; white bars) with 0 interacting localizations; low interaction clusters (LIC; gray bars) with between 1 and 4 interacting localizations; and high interaction clusters (HIC; black bars) with 5 or more interacting localizations. (A) Average number of clusters per ROI. (B) Average cluster area. (C,D) Average number of 5-LO and FLAP localizations per cluster, respectively. (E,F) Relative density of 5-LO and FLAP in clusters, respectively. Relative density of clusters was calculated by dividing the local density within 20 nm of each localization by the average density of the cluster, a measure of the local concentration maxima within the cluster. (G,H) Percent of interacting 5-LO and FLAP localizations located in clusters, respectively. Time points for a cluster type with fewer than 3 values for that cluster type were excluded. One-way ANOVA with Tukey’s post-hoc multiple comparisons test was performed to determine significance among interaction groups where *p < 0.05, **p < 0.005 and ****p < 0.0001; within timepoint, HIC–NIC or HIC–LIC indicated by black brackets, LIC–NIC by orange line; between timepoints by blue line. Bars show mean ± SEM of clusters within 4 to 21 cells over 3 independent experiments.
Fig 5
Fig 5. Activation organizes 5-LO into clusters by conventional STORM.
RBL-2H3 cells were primed with anti-TNP IgE then activated with TNP-BSA for 0, 2, 5, and 10 min and analyzed as shown S1 Fig. Cells were imaged with conventional STORM and cluster properties were analyzed with unbiased cluster analysis. (A) Detailed STORM analysis of 5-LO following priming and activation over time. Grayscale STORM images show localizations (upper panels), clusters are shown as convex hulls (middle panels, arbitrary colors) and 5-LO clusters are shown as points colored by number of localizations in the cluster (lower panels, legend bar below). (B) The average number of localizations per cluster over time. (C) The average area of 5-LO clusters over time. (D) The average density of 5-LO clusters over time. Plots show mean ± 95% confidence intervals of all pooled clusters identified in cells for that time point. At least 3 separate experiments collected between 10 and 30 cells. Scale bar = 5 μm.
Fig 6
Fig 6. FLAP re-organization on the nuclear envelope.
RBL-2H3 cells were primed with anti-TNP IgE then activated with TNP-BSA for 0 and 7 min then analyzed as shown Fig 1. Cells were imaged with conventional STORM and cluster properties were analyzed with unbiased cluster analysis. (A) Detailed STORM analysis of FLAP following priming and activation over time. Grayscale images show localizations (upper panels), cluster areas are shown as convex hulls (middle panels, arbitrary colors) and FLAP clusters are shown as points colored by number of localizations in the cluster (lower panels, legend bar below). Scale bar = 5 μm. (B-D) Normalized point-weighted histograms with inset bars showing mean ± SEM for (B) number of localizations, (C) cluster areas and (D) cluster densities. Student’s t-test was used to determine significance indicated by *p < 0.05 and ****p < 0.0005. At least 3 separate experiments collected between 10 and 30 cells.
Fig 7
Fig 7. Proposed model linking HIC to LTC4 synthesis.
At steady state (NT), small clusters (NIC, light gray outline) of 5-LO (green) or FLAP (red) exist on the nuclear membrane, few with 5-LO associated with FLAP (LIC, dark gray outline). By 2 min after activation, 5-LO and FLAP increasingly interact and more LIC are observed. Between 5 and 7 min after activation, large clusters with extensive interaction between 5-LO and FLAP have formed (HIC, black outline) and produce LTA4, which is converted to LTC4 then released from the cell. HIC are no longer observed at 10 min.

References

    1. Galli SJ, Tsai M. IgE and mast cells in allergic disease. Nat Med. 2012;18(5):693–704. 10.1038/nm.2755 - DOI - PMC - PubMed
    1. Turner H, Kinet JP. Signalling through the high-affinity IgE receptor Fc epsilonRI. Nature. 1999;402(6760 Suppl):B24–30. . - PubMed
    1. Stone KD, Prussin C, Metcalfe DD. IgE, mast cells, basophils, and eosinophils. J Allergy Clin Immunol. 2010;125(2 Suppl 2):S73–80. 10.1016/j.jaci.2009.11.017 - DOI - PMC - PubMed
    1. Scharenberg AM, Lin S, Cuenod B, Yamamura H, Kinet JP. Reconstitution of interactions between tyrosine kinases and the high affinity IgE receptor which are controlled by receptor clustering. EMBO J. 1995;14(14):3385–94. - PMC - PubMed
    1. Kinet JP. The high-affinity IgE receptor (FcεRI): from physiology to pathology. Annu Rev Immunol. 1999;17:931–72. 10.1146/annurev.immunol.17.1.931 . - DOI - PubMed

Publication types

MeSH terms