. 2019 Feb 7;176(4):743-756.e17.
doi: 10.1016/j.cell.2019.01.017.

Establishing Cerebral Organoids as Models of Human-Specific Brain Evolution

Affiliations

Establishing Cerebral Organoids as Models of Human-Specific Brain Evolution

Alex A Pollen et al. Cell. .

Abstract

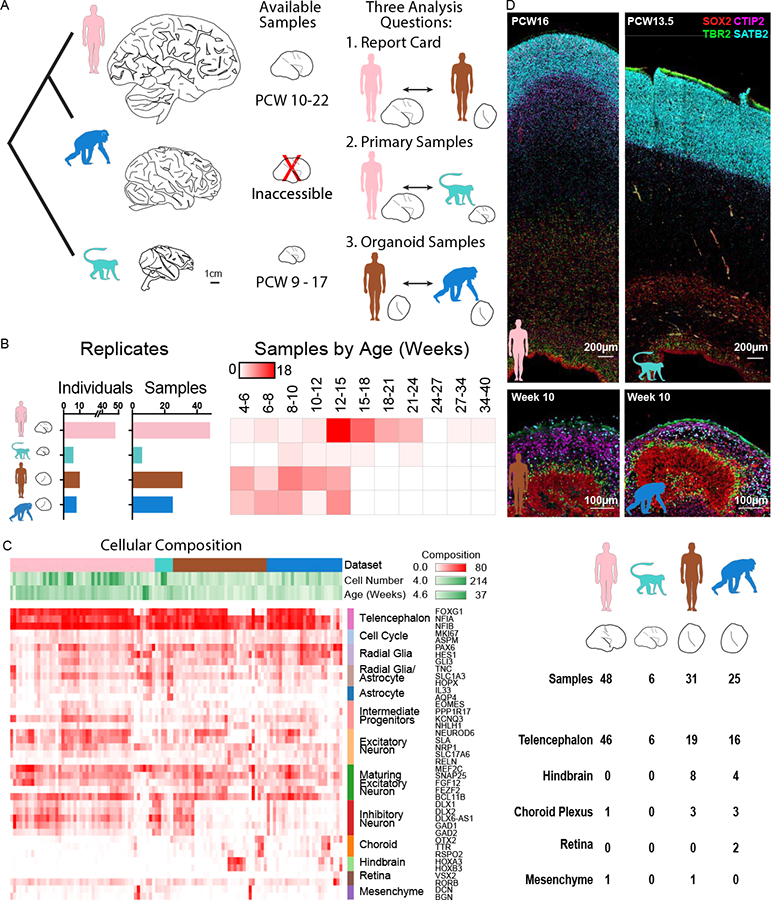
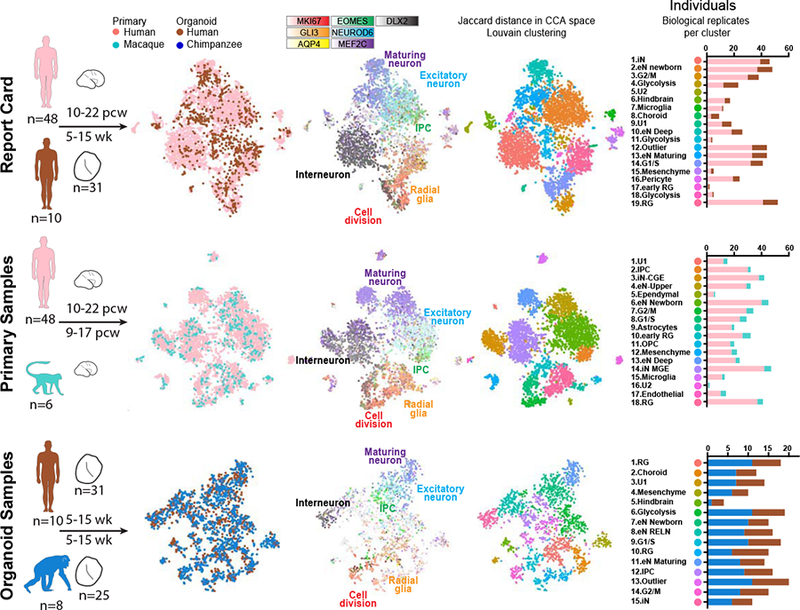
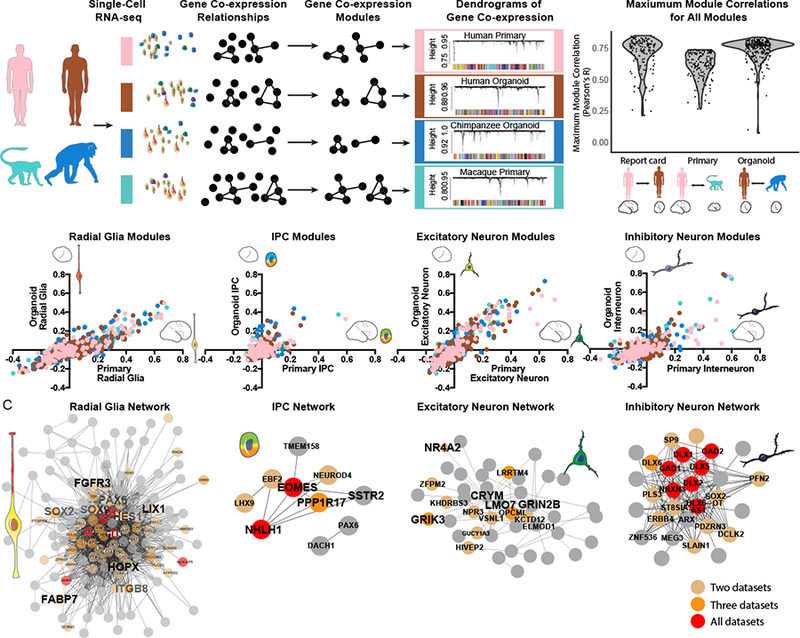
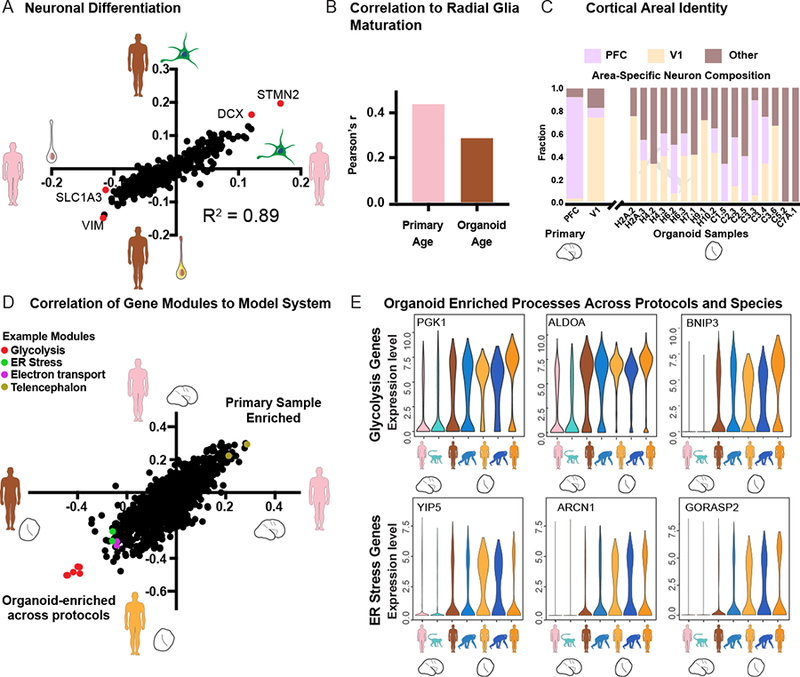
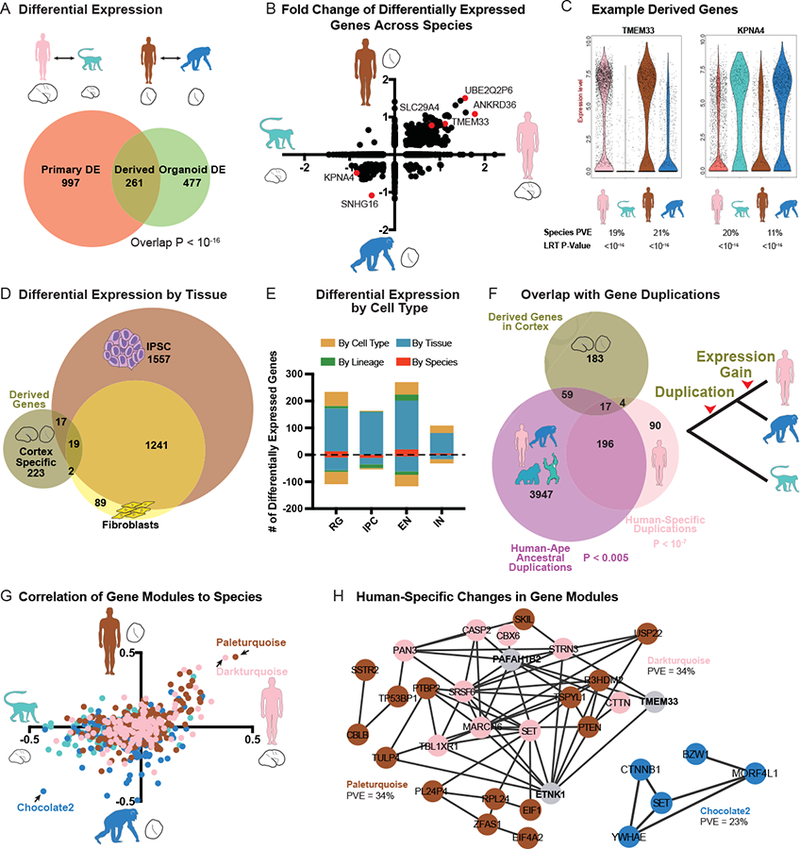
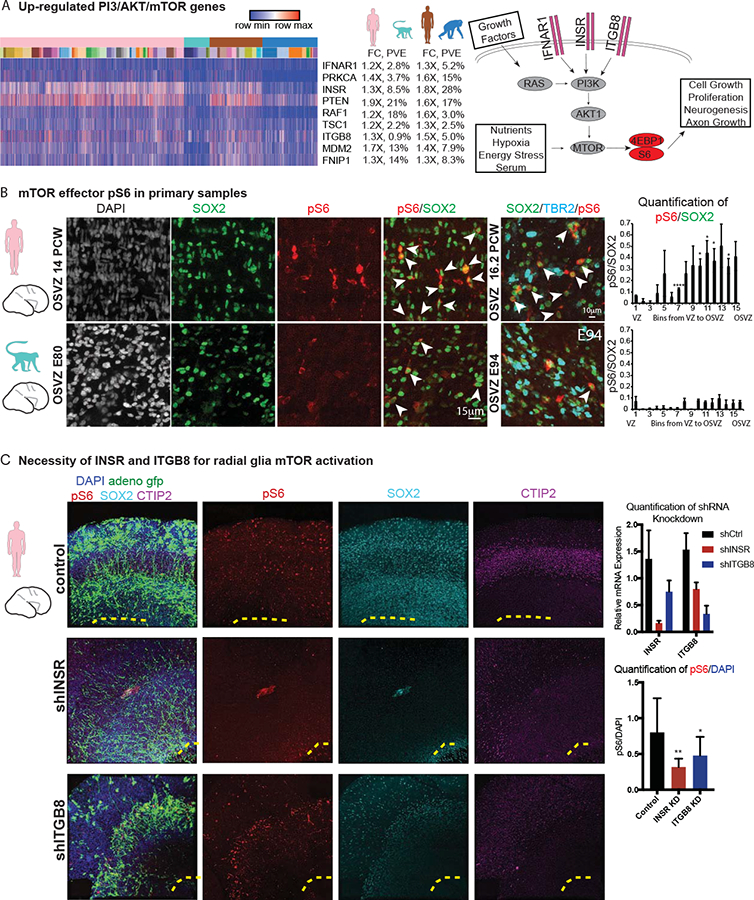
Direct comparisons of human and non-human primate brains can reveal molecular pathways underlying remarkable specializations of the human brain. However, chimpanzee tissue is inaccessible during neocortical neurogenesis when differences in brain size first appear. To identify human-specific features of cortical development, we leveraged recent innovations that permit generating pluripotent stem cell-derived cerebral organoids from chimpanzee. Despite metabolic differences, organoid models preserve gene regulatory networks related to primary cell types and developmental processes. We further identified 261 differentially expressed genes in human compared to both chimpanzee organoids and macaque cortex, enriched for recent gene duplications, and including multiple regulators of PI3K-AKT-mTOR signaling. We observed increased activation of this pathway in human radial glia, dependent on two receptors upregulated specifically in human: INSR and ITGB8. Our findings establish a platform for systematic analysis of molecular changes contributing to human brain development and evolution.

Keywords: cerebral organoids; chimpanzee; cortical development; human-specific evolution; mTOR; macaque; neural progenitor cells; radial glia; single-cell RNA sequencing.


Figures

Figure 1.
Figure 1.. Organoid models reflect normal features of human and chimpanzee brain development.
a) The human brain has expanded dramatically compared with other primates, but brain tissue is largely inaccessible from developing chimpanzee. To compare human and chimpanzee development, our study focuses on three analysis questions that integrate data from primary human (pink) and macaque samples (light blue) with human (brown) and chimpanzee (blue) organoid models. b) Histograms and heatmap depict the number of individuals and primary or organoid samples and the distribution of samples over post conception or post differentiation weeks. c) Heatmap represents the fraction of cells expressing each marker gene across cells from each primary sample or organoid, and table summarizes the number of samples that predominantly express markers for a given regional identity. d) Immunohistochemistry for markers of radial glia (SOX2), intermediate progenitors TBR2 (EOMES), and neurons CTIP2 (BCL11B), SATB2, reveals histological and cellular features of normal neurogenesis in the germinal zones of human and chimpanzee cerebral organoids, but a much more extensive intermediate zone and cortical plate in primary samples.
Figure 2.
Figure 2.. Identification of homologous cell types across species and model system.
a-c) Pairwise comparisons of human primary and human organoid cells (a), human primary and macaque primary cells (b), and human organoid and chimpanzee organoid cells (c), with developmental stages and the number of distinct individuals and organoids depicted under the schematics. Columns 1–3 display cells plotted based on gene expression similarity after principle components analysis and t-stochastic neighbor embedding, and colored by species or model system (column 1), by marker genes for known cell types (column 2), and by clusters following Louvain-Jaccard clustering (column 3). Column 4 indicates the number of primary individuals or distinct iPS lines contributing to each cluster.
Figure 3.
Figure 3.. Conservation of gene co-expression modules across species and model system.
a) Gene co-expression relationships were determined independently in each dataset using WGCNA. Violin plots indicate the distribution of maximum correlation values for all co-expression modules in each pairwise comparison. b) Scatterplots depict the correlation of modules to cell types independently determined in organoid (Y-axis) and primary cell datasets (X-axis). Notably many modules correlate to coarse cell-type classifications, representing finer cell subtypes and states. Dots are colored by the model system in which the network was identified. c) Network maps depict the correlation of genes from top cell type networks across all four datasets. Edges represent a correlation with R > 0.25, with edge length inversely related to correlation strength. Brown, orange and red dots highlight genes that appear in the core module for 2, 3 and 4 networks respectively.
Figure 4.
Figure 4.. Organoid modules recapitulate developmental gene expression trajectories but exhibit elevated metabolic stress across protocols.
a) Scatterplot shows the correlation of genes to the neuronal differentiation signature as derived in organoids (Y-axis) and in primary cells (X-axis). b) Histogram of R values indicating the correlation of the radial glia maturation network to sample age across primary radial glia (PCW8–22) and organoid radial glia (Week 5–15). c) Areal identity of maturing excitatory neurons in primary tissue and across organoids as predicted by a classifier. First two columns indicate primary cells with known areal identity. d) Scatterplot shows the correlation of all gene co-expression modules to primary human cells (positive on both axes) versus organoid cells from this paper using the Kadoshima protocol (negative on X-axis) and a previous paper (Camp et al., 2015) using a whole brain organoid protocol (negative on Y-axis). Modules are generated independently in each dataset and correlated to primary or organoid cell identity. Glycolysis, endoplasmic-reticulum (ER) stress, and electron transport modules show a strong correlation with organoid cells from both protocols. e) Violin plots illustrate the distribution of single cell gene expression values for hub genes in the glycolysis and ER stress co-expression modules from primary human and macaque cells (columns 1 and 2) organoid cells generated in this paper using the Kadoshima protocol (columns 3 and 4), organoid cells generated using a whole brain organoid protocol (columns 5 and 6, Camp et al., 2015; Mora-Bermudez et al., 2016) and a cortical spheroid protocol (column 7, Sloan et al., 2017).
Figure 5.
Figure 5.. Human-specific gene expression patterns during cortical neurogenesis.
a) Venn diagram represents the number of differentially expressed genes between primary human and macaque (left circle) and differentially expressed genes between human and chimpanzee organoids with cortical identity (LRT adjusted p-value < 0.0005). Overlap represents candidate genes with human-specific regulatory changes. b) Scatterplot illustrates the fold change for genes differentially expressed in either primary cell or organoid cell comparisons across all cells. c) Violin plots for genes up- or down-regulated specifically in human cells. d) Venn diagram represents the overlap between derived regulatory changes in cortex and human and chimpanzee differential expression previously determined in fibroblasts and iPS cells (Gallego Romero et al., 2015). e) Histogram highlights the number of derived expression changes that are shared across cortex, iPSC, and fibroblasts (by species, red), found only in cortex (by tissue, blue), found only in the excitatory neuron lineage of radial glia, intermediate progenitor cells (IPC) and excitatory neurons (by lineage, green), or in one cortical cell type (by cell type, dark yellow). f) Venn diagram represents the overlap between derived genes in cortex, and genes with duplications or copy number expansions that are human-specific (pink) or occurred in apes along the lineage leading to humans, prior to our divergence with chimpanzee (purple) (Sudmant et al., 2013). Note that some genes underwent multiple duplication events along the human lineage (overlap between pink and purple circles). g) Scatterplot illustrates the correlation of each gene co-expression module to species across primary cells (X-axis) and organoid cells (Y-axis). Colors correspond to the dataset in which the module was generated. h) Network maps highlight genes from the modules with expression most correlated to human or primate cell sources. Edges correspond to a correlation R > 0.25.
Figure 6.
Figure 6.. Human outer subventricular zone radial glia show increased phosphorylation of the mTOR effector S6 compared to other primates.
a) Heatmap across all cells (columns) illustrating differential expression for a subset genes related to the PI3K/AKT/mTOR pathway, with label showing the log2(fold change) and percent variance explained by species in both the primary cell and the organoid cell comparison. Schematic highlights receptors upregulated in human and their relationship to downstream effectors, phosphorylated S6 (pS6) and phosphorylated 4EBP1 (p4EBP1). b) Immunohistochemistry illustrates abundant labeling of pS6 in radial glia of primary human outer subventricular zone compared to primary macaque. Quantification of the levels of pS6 is shown in equal bins across the ventricular and outer subventricular zone. * denotes significant up-regulation in human compared to macaque with p <0.05 (*) or p <- 0.0001 (****) in each bin, with aggregated across bins significant at p < 10−6 (Welch’s t-test). c) Immunohistochemistry in human slice culture (representative example, n = 4) shows the fiber architecture (adeno GFP), pS6, SOX2 (progenitor population), and CTIP2 (neuronal population) in slices treated with hairpins targeting INSR or ITGB8. Quantification of knockdown and pS6 levels in outer subventricular zone is also shown. Note the control sample also contains pS6 in the cortical plate as previously observed. * indicates significant downregulation of pS6 levels with p < 0.05 (*) or p < 0.01 (**) (Welch’s t-test).

References

    1. Bakken TE, Miller JA, Ding S-L, Sunkin SM, Smith KA, Ng L, Szafer A, Dalley RA, Royall JJ, Lemon T, et al. (2016). A comprehensive transcriptional map of primate brain development. Nature 535, 367–375. - PMC - PubMed
    1. Bershteyn M, Nowakowski TJ, Pollen AA, Di Lullo E, Nene A, Wynshaw-Boris A, and Kriegstein AR (2017). Human iPSC-Derived Cerebral Organoids Model Cellular Features of Lissencephaly and Reveal Prolonged Mitosis of Outer Radial Glia. Cell Stem Cell 20, 435–449.e4. - PMC - PubMed
    1. Blake LE, Thomas SM, Blischak JD, Hsiao CJ, Chavarria C, Myrthil M, Gilad Y, and Pavlovic BJ (2018). A comparative study of endoderm differentiation in humans and chimpanzees. Genome Biology 19, 162. - PMC - PubMed
    1. Boyd JL, Skove SL, Rouanet JP, Pilaz L-J, Bepler T, Gordân R, Wray GA, and Silver DL (2015). Human-chimpanzee differences in a FZD8 enhancer alter cell-cycle dynamics in the developing neocortex. Current Biology 25, 772–779. - PMC - PubMed
    1. Butler A, Hoffman P, Smibert P, Papalexi E, and Satija R (2018). Integrating single-cell transcriptomic data across different conditions, technologies, and species. Nat. Biotechnol 48, 1070. - PMC - PubMed

Publication types