. 2019 May;66(5):834-848.
doi: 10.1109/TUFFC.2019.2898127. Epub 2019 Feb 7.

Combining Slow Flow Techniques With Adaptive Demodulation for Improved Perfusion Ultrasound Imaging Without Contrast

Combining Slow Flow Techniques With Adaptive Demodulation for Improved Perfusion Ultrasound Imaging Without Contrast

Jaime Tierney et al. IEEE Trans Ultrason Ferroelectr Freq Control. 2019 May.

Abstract

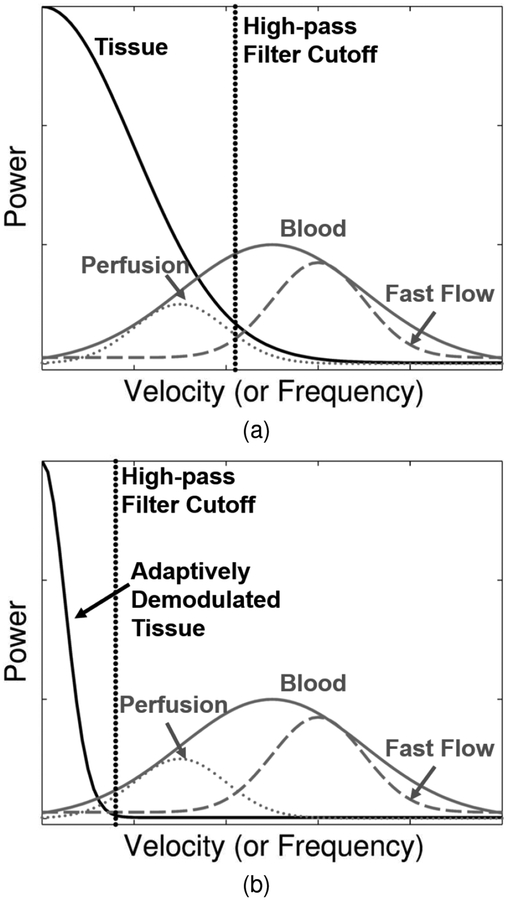
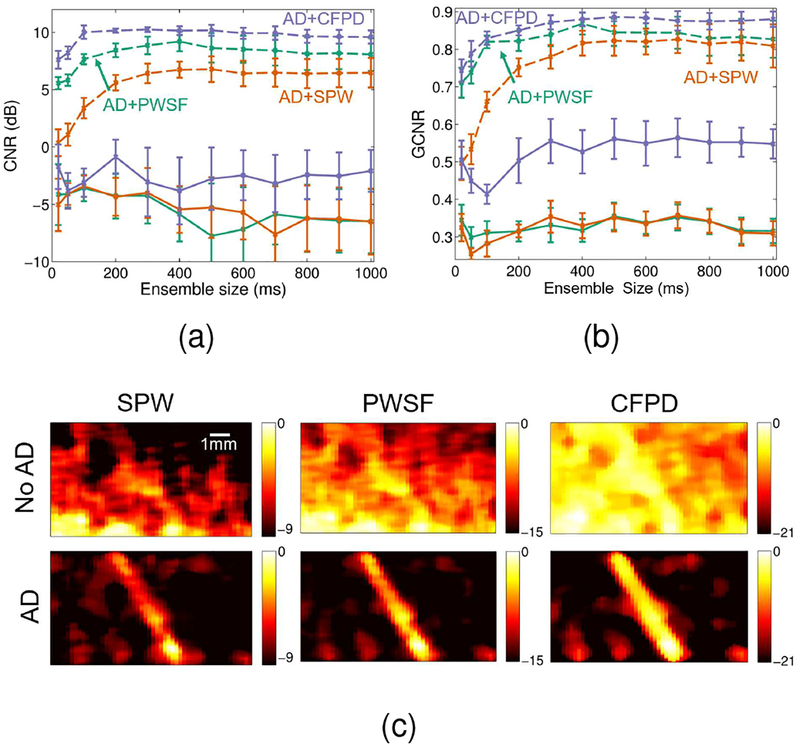
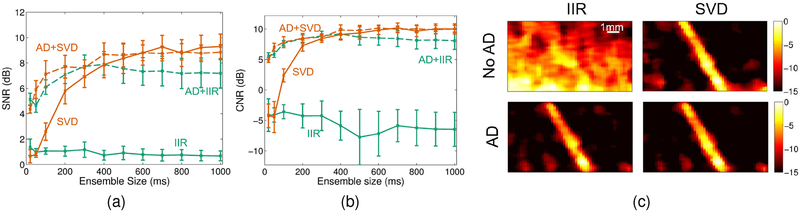
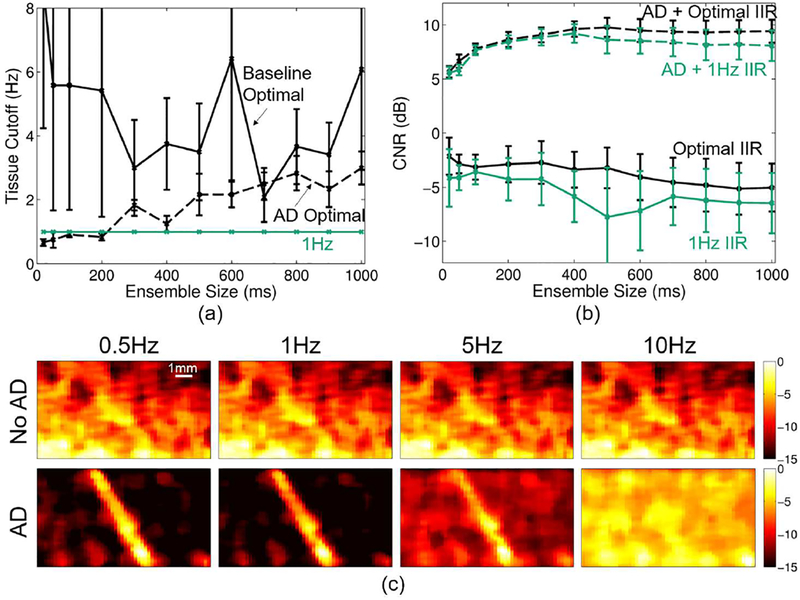
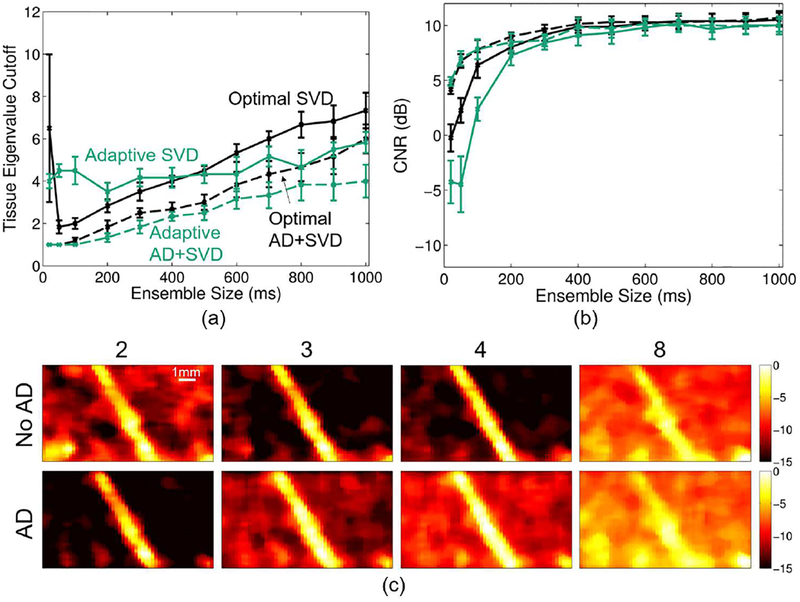
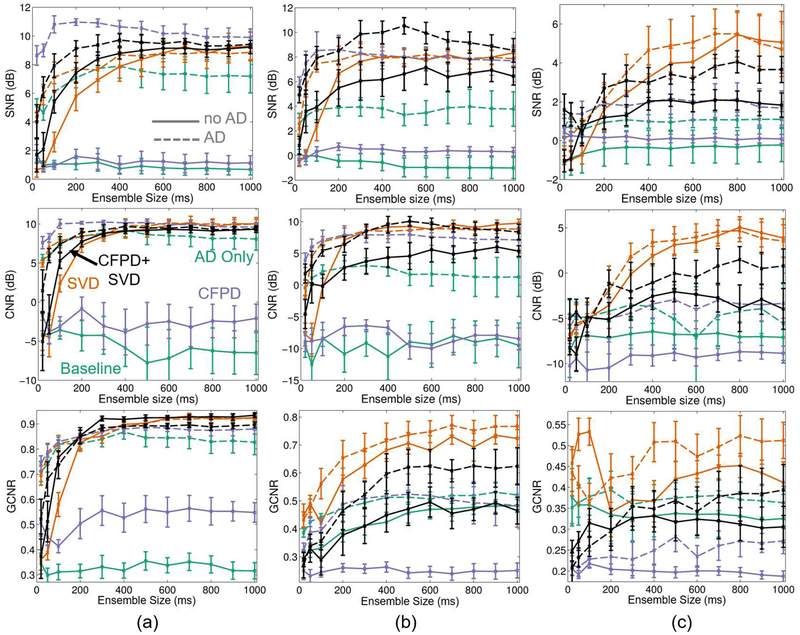
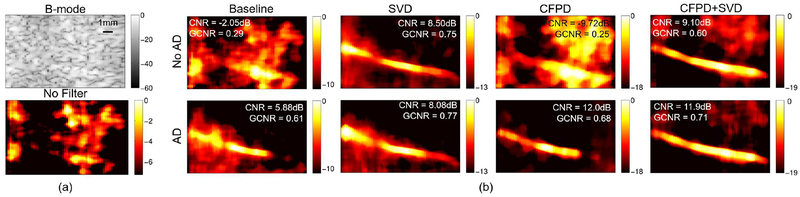
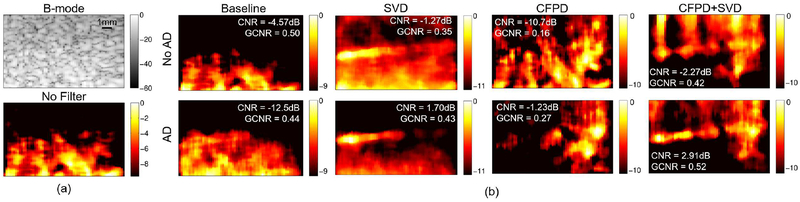
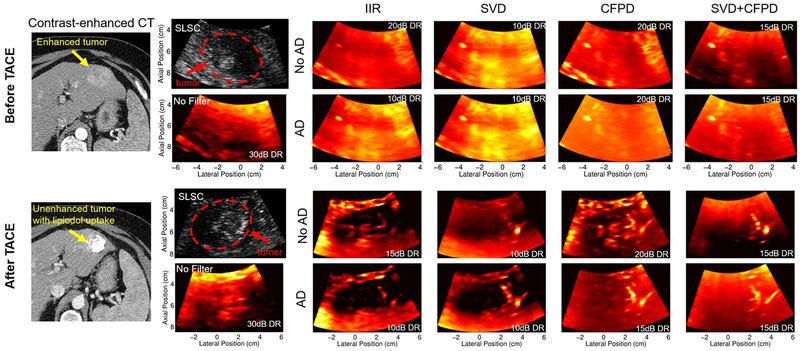
Noncontrast perfusion ultrasound imaging remains challenging due to spectral broadening of the tissue clutter signal caused by patient and sonographer hand motion. To address this problem, we previously introduced an adaptive demodulation scheme to suppress the bandwidth of tissue prior to high-pass filtering. Our initial implementation used single plane wave power Doppler imaging and a conventional tissue filter. Recent advancements in beamforming and tissue filtering have been proposed for improved slow flow imaging, including coherent flow power Doppler (CFPD) imaging and singular value decomposition (SVD) filtering. Here, we aim to evaluate adaptive demodulation in conjunction with improvements in beamforming and filtering using simulations, single-vessel phantoms, and an in vivo liver tumor embolization study. We show that simulated blood-to-background contrast-to-noise ratios are highest when using adaptive demodulation with CFPD and a 100-ms ensemble, which resulted in a 13.6-dB average increase in contrast-to-noise ratio compared to basic IIR filtering alone. We also show that combining adaptive demodulation with SVD and with CFPD + SVD results in 9.3- and 19-dB increases in contrast-to-noise ratios compared to IIR filtering alone at 700- and 500-ms ensembles for phantom data with 1- and 5-mm/s average flows, respectively. In general, combining techniques resulted in higher signal-to-noise, contrast-to-noise, and generalized contrast-to-noise ratios in both simulations and phantoms. Finally, adaptive demodulation with SVD resulted in the largest qualitative and quantitative changes in tumor-to-background contrast postembolization.


Figures

Fig. 1.
Fig. 1.
(a) Patient and sonographer motion causes spectral broadening of tissue clutter signal (black) causing it to overlap with low velocity blood flow or perfusion signal (dotted gray). Conventional high-pass tissue clutter filters (dotted black) preserve only high velocity blood signal (dashed gray). The full blood distribution is depicted as the solid gray curve. (b) Adaptive demodulation suppresses the tissue clutter bandwidth, allowing for perfusion signal to pass through the tissue clutter filter.
Fig. 2.
Fig. 2.
(a) Example realization of tissue (black) and blood (white) scatterers used for simulations. (b) Example simulated plane wave synthetic focused B-mode image. (c) Example simulated power Doppler image with no tissue motion. (d) Root mean square of hand motion velocities (mm/s) for each tissue clutter realization. (e) Histogram of velocities for an example pixel from an example tissue clutter realization.
Fig. 3.
Fig. 3.
Example tissue and noise eigenvalue cutoff selection. (a) Tissue cutoff 1 is selected by finding when the slope of the singular value magnitude curve goes below a certain threshold (e.g., 5). (b) Tissue cutoff 2 is selected by finding the first temporal eigenvector mean Doppler frequency to go above a certain threshold (e.g., 1Hz). (c) The noise cutoff is selected by fitting a line to the singular value magnitude curve and finding when the curve starts to deviate from the line by more than a certain threshold (e.g. 0.05).
Fig. 4.
Fig. 4.
Simulated blood-to-background SNR (± standard error) for (a) varying adaptive demodulation (AD) kernel sizes, (b) AD slow-time lag, (c) blood-to-noise ratio, (d) tissue-to-blood ratio, (e) peak blood velocity, and (f) imaging frequency. SNRs with and without AD are shown in gray and black, respectively. Plane wave synthetic focusing and IIR filtering were used for each case.
Fig. 5.
Fig. 5.
Simulated (a) CNR and (b) GCNR (± standard error) vs. ensemble size are plotted for single plane wave (SPW) (orange), plane wave synthetic focusing (PWSF) (teal), and CFPD (purple) beamforming methods with adaptive demodulation (AD) (dotted) and without (solid). (c) Simulated power Doppler images for an example tissue motion realization are shown for SPW (left), PWSF (middle), and CFPD (right) beamforming methods with AD (bottom) and without (top) for the 400ms ensemble. Images are on a dB scale.
Fig. 6.
Fig. 6.
Simulated blood-to-background (a) SNR and (b) CNR (± standard error) vs. ensemble size is plotted for IIR (teal) and SVD (orange) filtering methods with adaptive demodulation (AD) (dotted) and without (solid). (c) Simulated power Doppler images for an example tissue motion realization are shown for IIR (left) and SVD (right) filtering methods with AD (bottom) and without (top) for the 400ms ensemble. Images are on a dB scale.
Fig. 7.
Fig. 7.
(a) Average optimal IIR cutoff (± standard error) (black) vs. ensemble size for baseline (solid) and adaptively demodulated (AD) data (dashed). 1Hz cutoff is shown in teal. (b) Average CNR (± standard error) obtained with optimal cutoff (black) and with a 1Hz cutoff (teal) vs. ensemble size for baseline (solid) and AD (dashed). (c) Baseline (top) and AD (bottom) power Doppler images for a single realization made using a 400ms ensemble size and conventional high-pass IIR filter with the following cutoffs (imaged from left to right): 0.5, 1, 5, and 10Hz. Images are on a dB scale.
Fig. 8.
Fig. 8.
(a) Optimal (black) and adaptive (teal) SVD average tissue cutoff (± standard error) vs. ensemble size for baseline (solid) and adaptively demodulated (AD) data (dashed). (b) Average CNR (± standard error) obtained with optimal (black) and adaptively selected (teal) cutoffs vs. ensemble size for baseline (solid) and AD data (dashed). (c) Baseline (top) and AD (bottom) power Doppler images for a single realization made using a 400ms ensemble size and SVD filter (without noise filtering) with the following tissue eigenvalue cutoffs (imaged from left to right): 2, 3, 4, and 8. Images are on a dB scale.
Fig. 9.
Fig. 9.
Blood-to-background SNR (top), CNR (middle), and GCNR (bottom) (± standard error) vs. ensemble size is plotted for baseline (teal), SVD (orange), CFPD (purple), and CFPD+SVD (black) with adaptive demodulation (AD) (dotted) and without (solid) for (a) 1mm/s simulations (b) 5mm/s phantom and (c) 1mm/s phantom. Baseline is plane wave synthetic focusing beamforming with a conventional IIR filter and no AD. AD was applied for all cases using a 10λ kernel size and 1ms slow-time lag. Simulated data had a blood-to-noise ratio of 0dB and a tissue-to-blood ratio of 40dB. For both simulations and phantoms, a 7.8125MHz transmit frequency was used.
Fig. 10.
Fig. 10.
(a) B-mode and power Doppler images made without filtering of the single vessel phantom with 5mm/s average blood velocity. (b) Power Doppler images made with adaptive demodulation (AD) (bottom) and without (top) for baseline, SVD, CFPD, and CFPD+SVD. A 400ms ensemble was used for all power Doppler images. CNR and GCNR values are displayed on each image for reference. Images are on a dB scale.
Fig. 11.
Fig. 11.
(a) B-mode and power Doppler images made without filtering of the single vessel phantom with 1mm/s average blood velocity. (b) Power Doppler images made with adaptive demodulation (AD) (bottom) and without (top) for baseline, SVD, CFPD, and CFPD+SVD. A 400ms ensemble was used for all power Doppler images. CNR and GCNR values are displayed on each image for reference. Images are on a dB scale.
Fig. 12.
Fig. 12.
Gold-standard contrast-enhanced CT, anatomical SLSC and power Doppler images before (top) and after (bottom) TACE. Post-treatment CT and ultrasound were acquired 2 months and immediately after TACE, respectively. Power Doppler images are shown for each combination of adaptive demodulation (AD), SVD, and CFPD as well as for baseline IIR filtering and no tissue filtering. Dynamic ranges (DR) are displayed on each power Doppler image and were chosen to ensure qualitatively similar noise floors.
Fig. 13.
Fig. 13.
In vivo dynamic range evaluation. Power Doppler images are on a dB scale and are shown for the data before TACE made with conventional IIR filtering. Images without adaptive demodulation (AD) are shown in the top row with dynamic ranges of 10dB (left) and 20dB (right). The image with AD is shown in the bottom right and is made with a dynamic range of 10dB. The plot in the bottom left shows the histograms of the data (after log compression but before scaling to the maximums) with AD (gray) and without AD (black).

References

    1. Heimdal A and Torp H, “Ultrasound doppler measurements of low velocity blood flow: limitations due to clutter signals from vibrating muscles,” IEEE Transactions on Ultrasonics, Ferroelectrics and Frequency Control, vol. 44, pp. 873–881, 1997.
    1. Tremblay-Darveau C, Williams R, Milot L, Bruce M, and Burns PN, “Combined perfusion and doppler imaging using plane-wave nonlinear detection and microbubble contrast agents,” IEEE Transactions on Ultrasonics, Ferroelectrics and Frequency Control, vol. 61, pp. 1988–2000, 2014. - PubMed
    1. Jensen JA, Estimation of Blood Velocities Using Ultrasound: A Signal Processing Approach. Cambridge: Cambridge UP, 1996.
    1. Bjaerum S, Torp H, and Kristoffersen K, “Clutter filters adapted to tissue motion in ultrasound color flow imaging,” IEEE Transactions on Ultrasonics, Ferroelectrics, and Frequency Control, vol. 49, pp. 693–704, 2002. - PubMed
    1. Tierney J, Coolbaugh C, Towse T, and Byram B, “Adaptive clutter demodulation for non-contrast ultrasound perfusion imaging,” IEEE Transactions on Medical Imaging, vol. 36, pp. 1979–1991, 2017. - PMC - PubMed

Publication types

MeSH terms