. 2019 Feb 6;10(2):119.
doi: 10.3390/genes10020119.

Co-Expression Network Analysis and Hub Gene Selection for High-Quality Fiber in Upland Cotton (Gossypium hirsutum) Using RNA Sequencing Analysis

Affiliations

Co-Expression Network Analysis and Hub Gene Selection for High-Quality Fiber in Upland Cotton (Gossypium hirsutum) Using RNA Sequencing Analysis

Xianyan Zou et al. Genes (Basel). .

Abstract

Upland cotton (Gossypium hirsutum) is grown for its elite fiber. Understanding differential gene expression patterns during fiber development will help to identify genes associated with fiber quality. In this study, we used two recombinant inbred lines (RILs) differing in fiber quality derived from an intra-hirsutum population to explore expression profiling differences and identify genes associated with high-quality fiber or specific fiber-development stages using RNA sequencing. Overall, 72/27, 1137/1584, 437/393, 1019/184, and 2555/1479 differentially expressed genes were up-/down-regulated in an elite fiber line (L1) relative to a poor-quality fiber line (L2) at 10, 15, 20, 25, and 30 days post-anthesis, respectively. Three-hundred sixty-three differentially expressed genes (DEGs) between two lines were colocalized in fiber strength (FS) quantitative trait loci (QTL). Short Time-series Expression Miner (STEM) analysis discriminated seven expression profiles; gene ontology (GO) and Kyoto Encyclopedia of Genes and Genomes (KEGG) annotation were performed to identify difference in function between genes unique to L1 and L2. Co-expression network analysis detected five modules highly associated with specific fiber-development stages, especially for high-quality fiber tissues. The hub genes in each module were identified by weighted gene co-expression network analysis. Hub genes encoding actin 1, Rho GTPase-activating protein with PAK-box, TPX2 protein, bHLH transcription factor, and leucine-rich repeat receptor-like protein kinase were identified. Correlation networks revealed considerable interaction among the hub genes, transcription factors, and other genes.

Keywords: DEGs; Gossypium hirsutum; WGCNA; fiber development; transcriptomic analysis.


Conflict of interest statement

The authors declare no conflict of interest.

Figures

Figure 1
Figure 1
Statistics for transcript levels at each development stage, the numbers of genes and classification were divided by 0.5 < FPKM < 5, 5 < FPKM < 100, and 100 < FPKM in each sample. FPKM: fragments per kilobase of exon per million reads.
Figure 2
Figure 2
Vertical of L1 relative to L2 and horizontal comparisons of genes that showed differential expression levels between the two lines at the same developmental stage and between different stages of an individual line. Red numbers represent upregulated genes; black numbers indicate down-regulated genes. The differentially expressed genes were identified by the criteria FPKM > 0.5, |log2(FC)| > 1.
Figure 3
Figure 3
(a) Different gene expression profiles in the two recombinant inbred lines (RILs). Each square represents a profile of gene expression trend. The profile ID and gene number in the corresponding profile are shown in the top and bottom left corners, respectively. (b) and (c) Venn diagram showed the different genes set between L1 and L2 in profile 4 and profile 22, respectively. (d) and (e) Kyoto Encyclopedia of Genes and Genomes (KEGG) pathways of common genes between L1 and L2 in expression profile 4 and 22. The size of the ball represents the genes number enriched in the pathway; the depth of the color represents the size of the p-value.
Figure 4
Figure 4
Gene ontology (GO) enrichment of genes listed in expression profile 4. (a) and (b) show the top 30 terms of GO enrichment for 1112 and 1060 genes unique to L1 and L2, respectively. The main different terms are highlighted in red.
Figure 5
Figure 5
GO enrichment of genes listed in expression profile 22. (a) and (b) show the top 30 terms of GO enrichment for 1128 and 748 genes unique to L1 and L2, respectively. The main different terms names are highlighted in red.
Figure 6
Figure 6
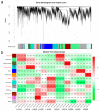
Weighted gene co-expression network analysis (WGCNA) of differentially expressed genes (DEGs) in L1 and L2 at five time points of fiber development. (a) Hierarchical dendrogram showing co-expression modules identified by WGCNA. Each leaf in the tree represents one gene. The major tree was divided into 13 modules based on calculation of eigengenes; each module is highlighted in a different color. (b) Module–sample relationships. Each row represents a module, and the correlation coefficient and the e-value are shown in each square. Each column corresponds to a sample tissue and replication (R). The number of genes and transcription factors enriched in the module are shown in the left module squares and parentheses, respectively. The modules names in red were highly associated with the high-quality fiber line (L1).
Figure 7
Figure 7
Heatmap comparison DEGs associated with fiber developmental stages. (a), (b), (c), and (d) show the DEGs associated to the overrepresented functional categories and transcription factors at 10, 15, 20, and 30 days post-anthesis (DPA), respectively.
Figure 8
Figure 8
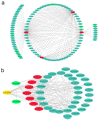
Correlation networks for the dark red and violet modules. Hub genes are indicated by red circles; green circles indicate transcription factors; yellow circles indicate both a hub gene and a transcription factor.

References

    1. Yoo M.-J., Wendel J.F. Comparative evolutionary and developmental dynamics of the cotton (Gossypium hirsutum) fiber transcriptome. PLoS Genet. 2014;10:e1004073. doi: 10.1371/journal.pgen.1004073. - DOI - PMC - PubMed
    1. Haigler C.H., Betancur L., Stiff M.R., Tuttle J.R. Cotton fiber: A powerful single-cell model for cell wall and cellulose research. Front. Plant Sci. 2012;3:104. doi: 10.3389/fpls.2012.00104. - DOI - PMC - PubMed
    1. Li X., Wu M., Liu G., Pei W., Zhai H., Yu J., Zhang J., Yu S. Identification of candidate genes for fiber length quantitative trait loci through RNA-Seq and linkage and physical mapping in cotton. BMC Genom. 2017;18:427. doi: 10.1186/s12864-017-3812-5. - DOI - PMC - PubMed
    1. Li P.-T., Wang M., Lu Q.-W., Ge Q., Rashid M.H.O., Liu A.-Y., Gong J.-W., Shang H.-H., Gong W.-K., Li J.-W., et al. Comparative transcriptome analysis of cotton fiber development of Upland cotton (Gossypium hirsutum) and Chromosome Segment Substitution Lines from G. hirsutum × G. barbadense. BMC Genom. 2017;18:705. doi: 10.1186/s12864-017-4077-8. - DOI - PMC - PubMed
    1. Lu Q., Shi Y., Xiao X., Li P., Gong J., Gong W., Liu A., Shang H., Li J., Ge Q., et al. Transcriptome analysis suggests that chromosome introgression fragments from sea island cotton (Gossypium barbadense) increase fiber strength in upland cotton (Gossypium hirsutum) G3 Genes|Genomes|Genet. 2017;7:3469–3479. doi: 10.1534/g3.117.300108. - DOI - PMC - PubMed

Publication types

LinkOut - more resources