. 2019 Feb 6;11(2):190.
doi: 10.3390/cancers11020190.

Intratumoural Heterogeneity Underlies Distinct Therapy Responses and Treatment Resistance in Glioblastoma

Affiliations

Intratumoural Heterogeneity Underlies Distinct Therapy Responses and Treatment Resistance in Glioblastoma

Seçkin Akgül et al. Cancers (Basel). .

Abstract

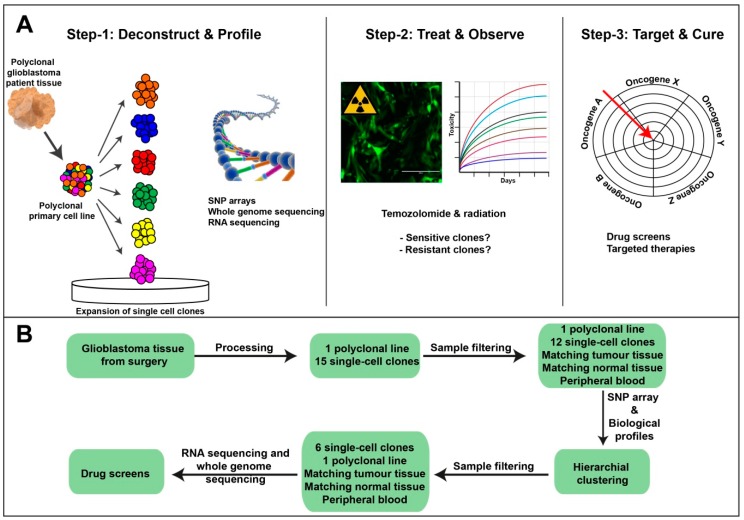
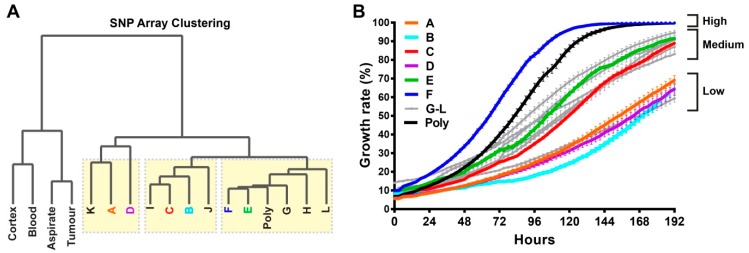
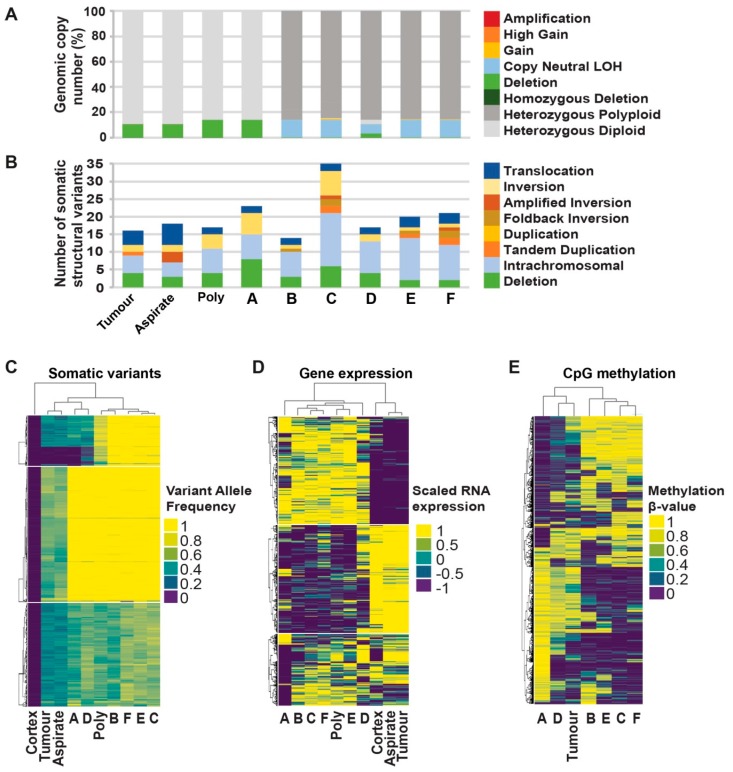
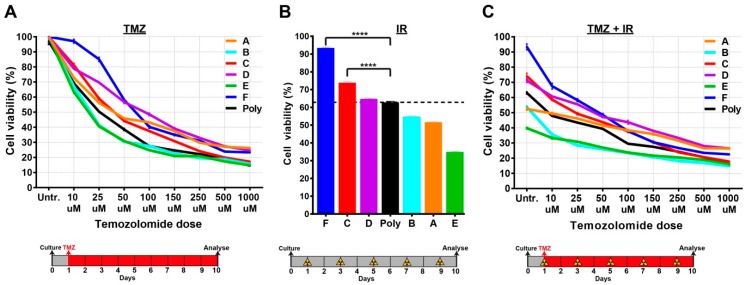
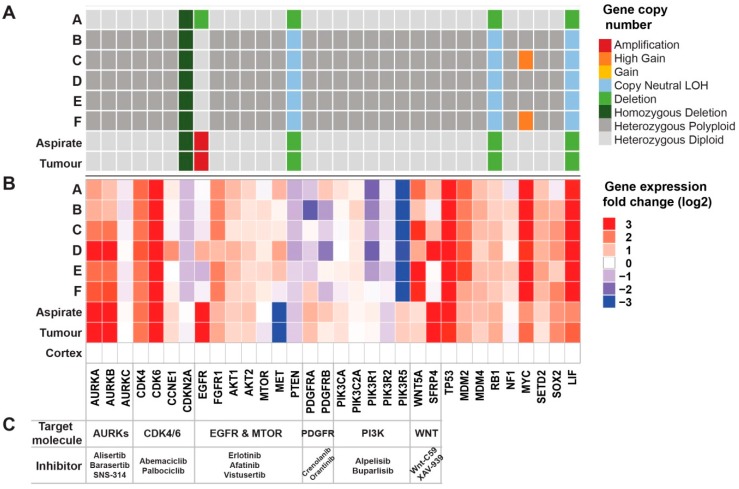
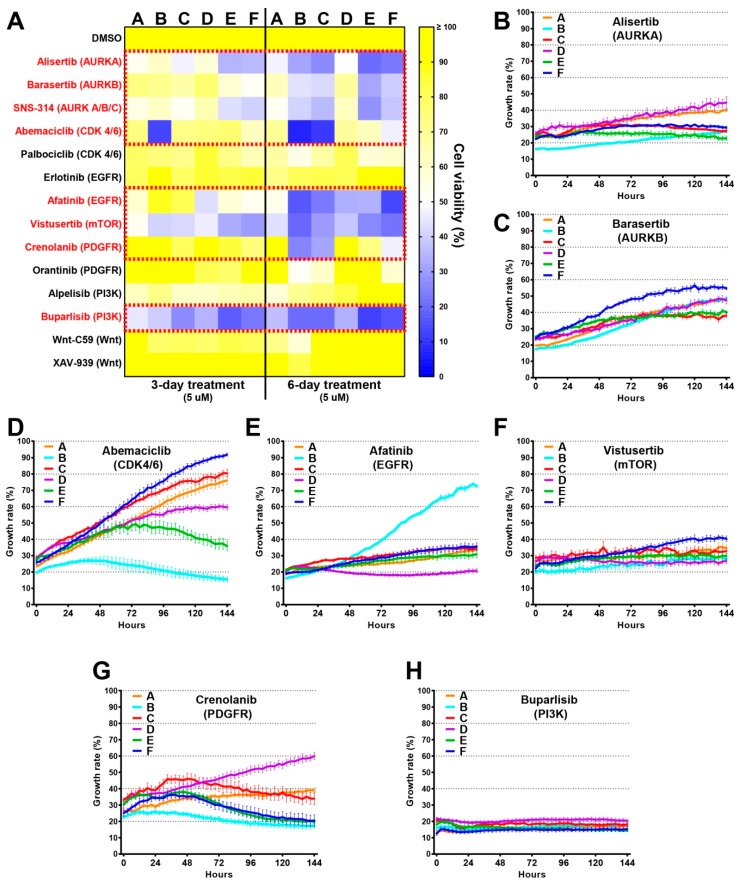
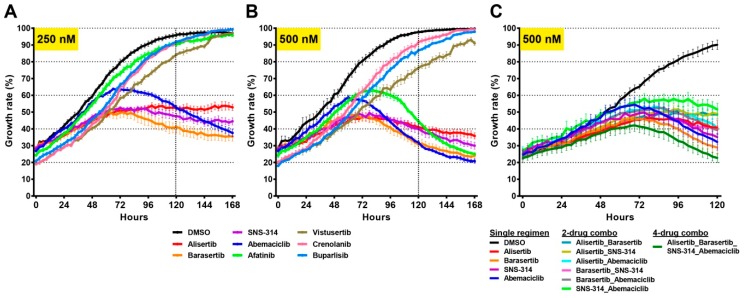
Glioblastomas are the most common and lethal neoplasms of the central nervous system. Neighbouring glioma cells maintain extreme degrees of genetic and phenotypic variation that form intratumoural heterogeneity. This genetic diversity allows the most adaptive tumour clones to develop treatment resistance, ultimately leading to disease recurrence. We aimed to model this phenomenon and test the effectiveness of several targeted therapeutic interventions to overcome therapy resistance. Heterogeneous tumour masses were first deconstructed into single tumour cells, which were expanded independently as single-cell clones. Single nucleotide polymorphism arrays, whole-genome and RNA sequencing, and CpG methylation analysis validated the unique molecular profile of each tumour clone, which displayed distinct pathologic features, including cell morphology, growth rate, and resistance to temozolomide and ionizing radiation. We also identified variable sensitivities to AURK, CDK, and EGFR inhibitors which were consistent with the heterogeneous molecular alterations that each clone harboured. These targeted therapies effectively eliminated the temozolomide- and/or irradiation-resistant clones and also parental polyclonal cells. Our findings indicate that polyclonal tumours create a dynamic environment that consists of diverse tumour elements and treatment responses. Designing targeted therapies based on a range of molecular profiles can be a more effective strategy to eradicate treatment resistance, recurrence, and metastasis.

Keywords: combination therapy; drug screens; glioblastoma; intratumoural heterogeneity; personalised therapy; targeted therapy; tumour resistance.


Conflict of interest statement

The authors declare no conflict of interest.

Figures

Figure 1
Figure 1
Modelling tumour heterogeneity. (A) Schematic representation of the three main steps used to investigate intratumoural heterogeneity in glioblastoma. Step 1, deconstructing a polyclonal tumour into single-cells that were expanded clonally prior to comprehensive genomics analyses. Step 2, assessment of individual clones’ responses to the current standards of care, including temozolomide (TMZ) and IR. Step 3, drug screen development and rationale target validation. (B) A schema of the workflow used to undertake this study.
Figure 2
Figure 2
Single-cell clones exhibit unique molecular relationships and growth rates. (A) single nucleotide polymorphism (SNP) array-based dendrogram of 12 single-cell clones (A–L), parental polyclonal line (Poly), normal cortex tissue (Cortex), peripheral blood (Blood), aspirated tumour tissue (Aspirate), and surgically resected tumour tissue (Tumour). Three subgroups were found among the tumour clones, which are indicated with yellow boxes. (B) Growth rates of the 12 single-cell clones (A–L) and polyclonal cell line were recorded every 3 h for a period of 8 days using an IncuCyte instrument. The cell growth was categorised as high, medium or low. Growth curves for each single-cell clone are labelled with a different colour, except for the grey curves, which represent the clones that were not subjected to further comprehensive genomics analyses.
Figure 3
Figure 3
Comprehensive genomic analyses of single-cell clones. (A) Genomic proportion of copy number alteration. For clonal samples B–F, >84% of their genome is between copy number 3 and 4 (ranging from 84.82% to 85.9%, shown as dark grey bars) as compared to ≤3% for the other samples. This global whole genome duplication typically affected both alleles, preserving heterozygosity in these samples. (B) Number of somatic structural variants identified per sample with the type indicated by colours. (C) Hierarchical clustering of somatic substitution variant allele frequencies across tumour and clonal samples. The absence of a variant in the normal control cortex sample is demonstrated by a variant allele frequency of zero (dark blue). (D) Hierarchical clustering of Log2-normalised and gene-scaled RNA seq gene expression of genes with most variable expression as identified as contributing to the first principle component. Positive values indicate a sample with the highest expression and negative values with the lowest expression. (E) Hierarchical clustering of 1000 most variable β-values from DNA methylation sequencing data. Β-value of 1 indicates completely methylated and 0 unmethylated CpGs.
Figure 4
Figure 4
Single-cell clones respond differently to TMZ and/or IR treatments. (A) Single-cell clones were grown in the presence of varying TMZ dosages for 10 days. (B) A total of 10 Gy IR (2 Gy every other day) was applied to single-cell clones which were analysed at the end of the 10-day period. (C) The combination therapy of 10 Gy IR and varying dosages of TMZ on single-cell clones. Cell viability was measured by the MTT cell proliferation assay at day 10. Treatment and analysis protocols are shown under each graph. The unpaired t-test was used for statistical comparisons. **** = p-value < 0.0001
Figure 5
Figure 5
Comprehensive genomics analyses identified targetable oncogenes. (A) Gene copy number analysis of tumour clones based on whole genome sequencing. (B) Gene expression fold change across the tumour clones along with the aspirated tumour tissue (Aspirate), and surgically resected tumour tissue (Tumour). Log2 expression values were normalised to normal cortex tissue (Cortex). (C) Target molecules and their inhibitors are identified based on gene copy number and expression changes.
Figure 6
Figure 6
Drug screens identify unique sensitivities of tumour cells. (A) Cells were treated with 14 different compounds at 5 µM concentration and cell viability was tested 3 or 6 days after the treatment using MTT assay. Red dashed squares indicate the drugs that are most effective. (BH) Effective seven drugs were tested at 5 µM concentration and the cell growth was examined using an IncuCyte instrument, which automatically took the pictures of the cells every 3 h for a period of 6 days.
Figure 7
Figure 7
Combination therapies inhibit tumour growth. The 8 most effective drugs were tested at (A) 250 nM concentration on a mixed-tumour clone and (B) 500 nM concentration on mixed-tumour clones. (C) Combination therapies were designed using two drugs (2-drug combo, 250 nM each) or four drugs (4-drug combo, 125 nM each) in comparison to single drugs (single regimen) at a total of 500 nM concentration. Cell growth rates were examined using an IncuCyte instrument. Vertical dashed lines in A and B indicates day 5.

References

    1. Noroxe D.S., Poulsen H.S., Lassen U. Hallmarks of glioblastoma: A systematic review. ESMO Open. 2016;1:e000144. doi: 10.1136/esmoopen-2016-000144. - DOI - PMC - PubMed
    1. Stupp R., Mason W.P., van den Bent M.J., Weller M., Fisher B., Taphoorn M.J., Belanger K., Brandes A.A., Marosi C., Bogdahn U., et al. Radiotherapy plus concomitant and adjuvant temozolomide for glioblastoma. N. Engl. J. Med. 2005;352:987–996. doi: 10.1056/NEJMoa043330. - DOI - PubMed
    1. Brennan C.W., Verhaak R.G., McKenna A., Campos B., Noushmehr H., Salama S.R., Zheng S., Chakravarty D., Sanborn J.Z., Berman S.H., et al. The somatic genomic landscape of glioblastoma. Cell. 2013;155:462–477. doi: 10.1016/j.cell.2013.09.034. - DOI - PMC - PubMed
    1. Verhaak R.G., Hoadley K.A., Purdom E., Wang V., Qi Y., Wilkerson M.D., Miller C.R., Ding L., Golub T., Mesirov J.P., et al. Integrated genomic analysis identifies clinically relevant subtypes of glioblastoma characterized by abnormalities in PDGFRA, IDH1, EGFR, and NF1. Cancer Cell. 2010;17:98–110. doi: 10.1016/j.ccr.2009.12.020. - DOI - PMC - PubMed
    1. Noushmehr H., Weisenberger D.J., Diefes K., Phillips H.S., Pujara K., Berman B.P., Pan F., Pelloski C.E., Sulman E.P., Bhat K.P., et al. Identification of a CpG island methylator phenotype that defines a distinct subgroup of glioma. Cancer Cell. 2010;17:510–522. doi: 10.1016/j.ccr.2010.03.017. - DOI - PMC - PubMed