. 2019 Feb 6;8(2):130.
doi: 10.3390/cells8020130.

Retroelement-Linked Transcription Factor Binding Patterns Point to Quickly Developing Molecular Pathways in Human Evolution

Affiliations

Retroelement-Linked Transcription Factor Binding Patterns Point to Quickly Developing Molecular Pathways in Human Evolution

Daniil Nikitin et al. Cells. .

Erratum in

Abstract

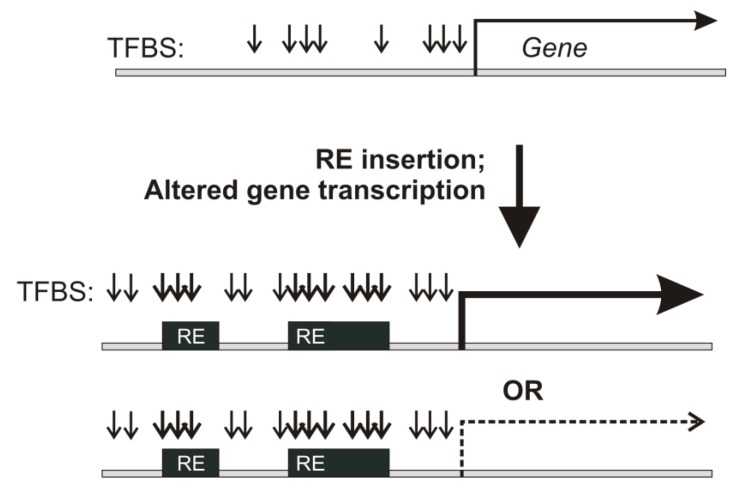
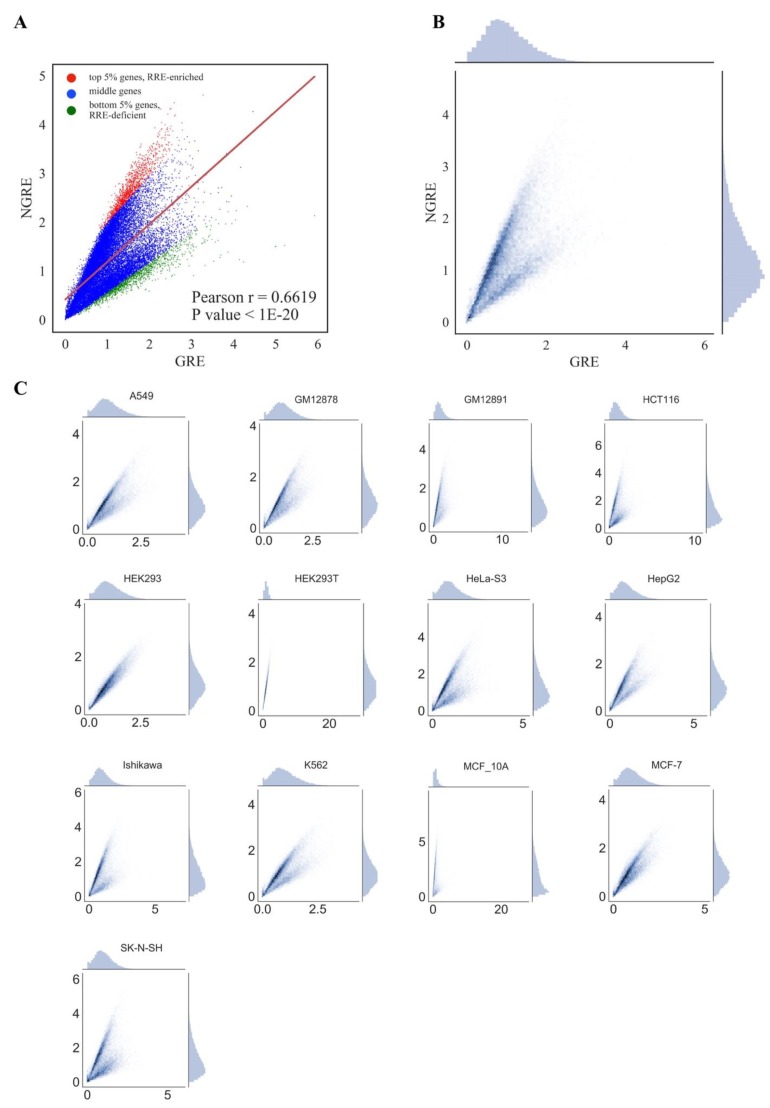
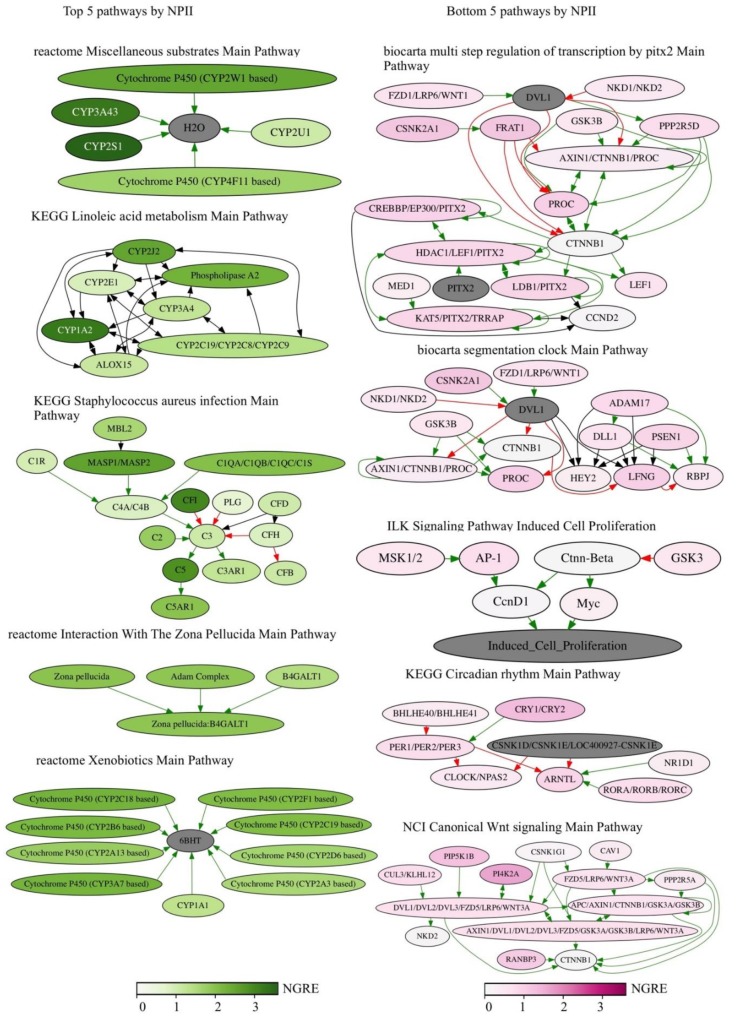
Retroelements (REs) are transposable elements occupying ~40% of the human genome that can regulate genes by providing transcription factor binding sites (TFBS). RE-linked TFBS profile can serve as a marker of gene transcriptional regulation evolution. This approach allows for interrogating the regulatory evolution of organisms with RE-rich genomes. We aimed to characterize the evolution of transcriptional regulation for human genes and molecular pathways using RE-linked TFBS accumulation as a metric. Methods: We characterized human genes and molecular pathways either enriched or deficient in RE-linked TFBS regulation. We used ENCODE database with mapped TFBS for 563 transcription factors in 13 human cell lines. For 24,389 genes and 3124 molecular pathways, we calculated the score of RE-linked TFBS regulation reflecting the regulatory evolution rate at the level of individual genes and molecular pathways. Results: The major groups enriched by RE regulation deal with gene regulation by microRNAs, olfaction, color vision, fertilization, cellular immune response, and amino acids and fatty acids metabolism and detoxication. The deficient groups were involved in translation, RNA transcription and processing, chromatin organization, and molecular signaling. Conclusion: We identified genes and molecular processes that have characteristics of especially high or low evolutionary rates at the level of RE-linked TFBS regulation in human lineage.

Keywords: ChIP-seq; Human genome evolution; gene ontology; molecular pathways; omics approach in genetics; retrotransposons; transcription factor.


Conflict of interest statement

The authors declare that they have no competing interests.

Figures

Figure 1
Figure 1
RE insertion in the proximity of transcription start sites can bring new TFBS and drastically alter gene expression.
Figure 2
Figure 2
Comparison of NGRE and NPII scores between different cell lines for all REs. Colors denote human organs of cell lines origin. (A) Anatomical map of cell line origins investigated in this study. (B) Distribution of Pearson correlation coefficients of NGRE score of K562 cell line with NGRE scores of the 12 other cell lines investigated. (C) Distribution of Pearson correlation coefficients of NPII score of K562 cell line with NGRE scores of the 12 other cell lines. (D) Distribution of all pairwise Pearson correlation coefficients of NGRE scores of all 13 cell lines. (E) Distribution of all pairwise Pearson correlation coefficients of NPII scores of all 13 cell lines.
Figure 3
Figure 3
Comparison of GRE and NGRE scores across cell lines for all REs. (A) Comparison of mean GRE and mean NGRE scores. Each dot represents a single gene; GRE and NGRE scores were averaged across all cell lines. Genes enriched in RRE (regulation by retroelements) are shown as red dots. Genes deficient in RRE are shown as green dots. (B) Comparison of mean GRE and mean NGRE scores. Both scores were averaged across cell lines. Color depth is congruent with the number of single dots (each dot represents a single gene) in one grain. Univariate distributions of GRE and NGRE are shown in plot margins. (C) Comparison of GRE and NGRE scores for individual cell lines.
Figure 4
Figure 4
Comparison of PII and NPII scores across cell lines for all REs. (A) Comparison of mean PII and mean NPII scores. Each dot represents a single pathway; PII and NPII scores were averaged across all cell lines. Pathways enriched in RRE (regulation by retroelements) are shown as red dots. Pathways deficient in RRE are shown as green dots. (B) Comparison of mean PII and mean NPII scores. Both scores were averaged across cell lines. Color depth is proportional to the number of single dots (each dot represents a single pathway) in one grain. Univariate distributions of PII and NPII are shown in plot margins. (C) Comparison of PII and NPII scores for individual cell lines.
Figure 5
Figure 5
Hierarchically ordered GO annotated terms detected by Gorilla software for RRE-enriched (A) and RRE-deficient (B) genes for all REs.
Figure 6
Figure 6
Top five RRE-enriched and deficient pathways sorted by NPII for all REs.
Figure 7
Figure 7
RRE-enriched and RRE-deficient molecular processes for all REs.
Figure 8
Figure 8
Random control of GO processes enrichment in RRE-enriched (A) and RRE-deficient (B) genes for all REs.
Figure 9
Figure 9
Hierarchically ordered GO annotated terms detected by Gorilla software for RRE-deficient genes for evolutionary young REs.
Figure 10
Figure 10
RRE-enriched and RRE-deficient molecular processes for evolutionary young Res.

References

    1. Lander E.S., Linton L.M., Birren B., Nusbaum C., Zody M.C., Baldwin J., Devon K., Dewar K., Doyle M., FitzHugh W., et al. Initial sequencing and analysis of the human genome. Nature. 2001;409:860–921. - PubMed
    1. Kazazian H.H., Jr., Moran J.V. Mobile DNA in Health and Disease. New Engl. J. Med. 2017;377:361–370. doi: 10.1056/NEJMra1510092. - DOI - PMC - PubMed
    1. Chuong E.B., Elde N.C., Feschotte C. Regulatory evolution of innate immunity through co-option of endogenous retroviruses. Science. 2016;351:1083–1087. doi: 10.1126/science.aad5497. - DOI - PMC - PubMed
    1. Feschotte C. Transposable elements and the evolution of regulatory networks. Nat. Rev. Genet. 2008;9:397–405. doi: 10.1038/nrg2337. - DOI - PMC - PubMed
    1. Suntsova M., Garazha A., Ivanova A., Kaminsky D., Zhavoronkov A., Buzdin A. Molecular functions of human endogenous retroviruses in health and disease. Cell. Mol. Life Sci. 2015;72:3653–3675. doi: 10.1007/s00018-015-1947-6. - DOI - PMC - PubMed

Publication types

LinkOut - more resources