. 2019 Feb 7;8(2):205.
doi: 10.3390/jcm8020205.

An Integrative Systems Biology and Experimental Approach Identifies Convergence of Epithelial Plasticity, Metabolism, and Autophagy to Promote Chemoresistance

Affiliations

An Integrative Systems Biology and Experimental Approach Identifies Convergence of Epithelial Plasticity, Metabolism, and Autophagy to Promote Chemoresistance

Shengnan Xu et al. J Clin Med. .

Abstract

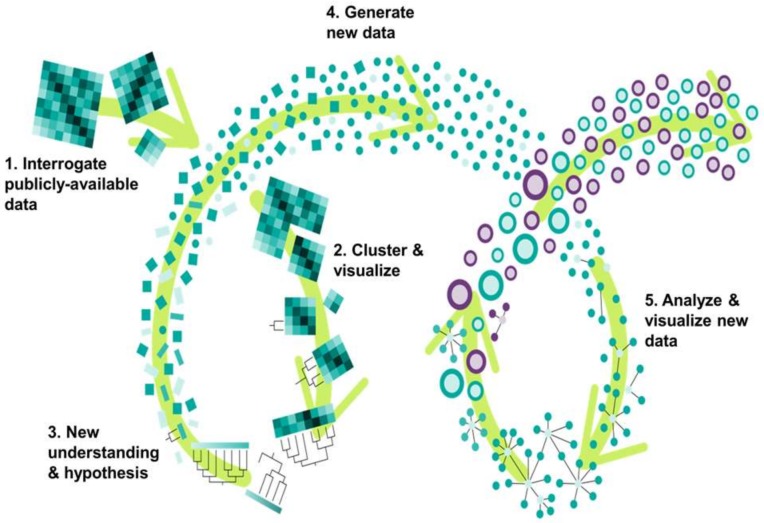
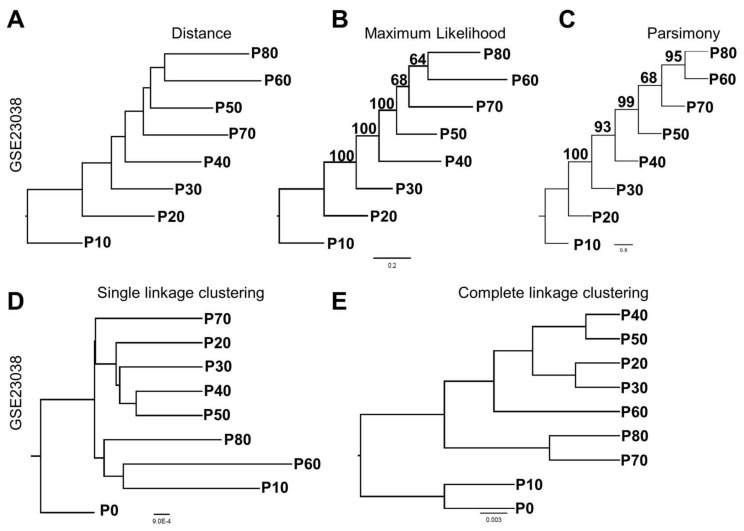
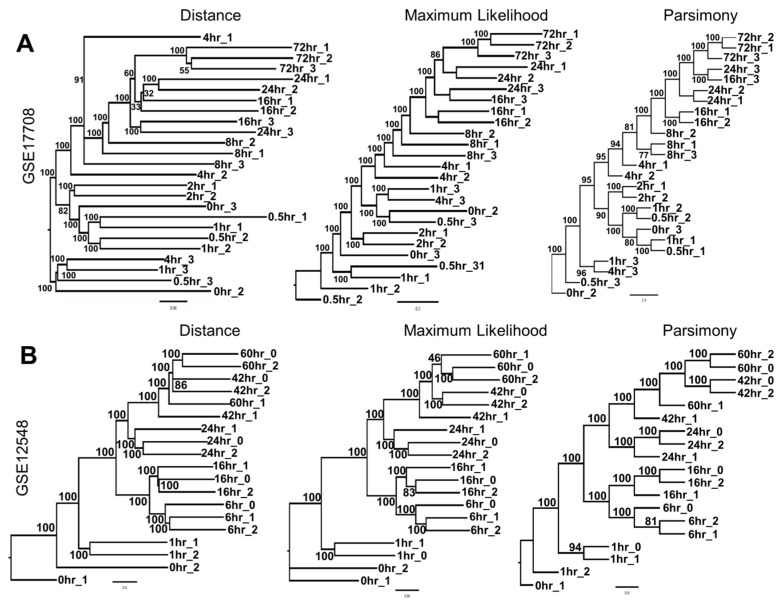
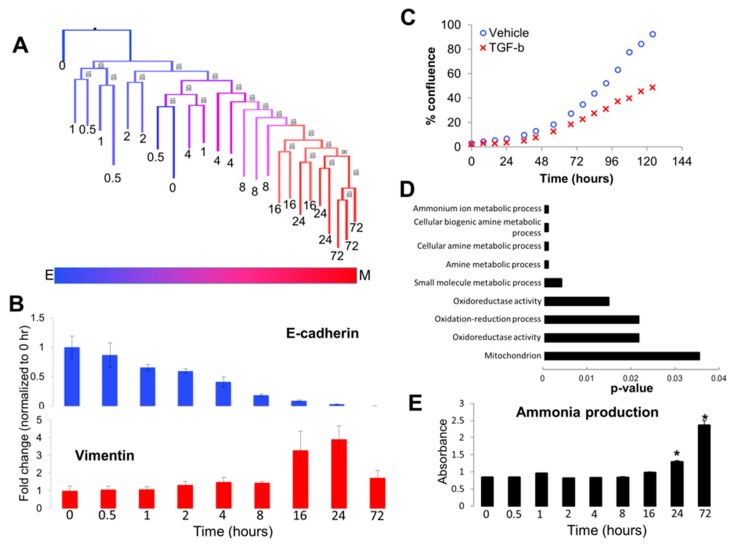
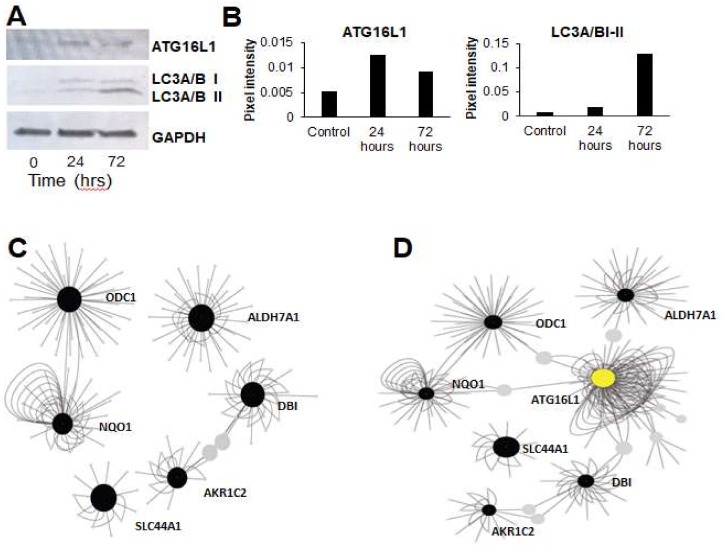
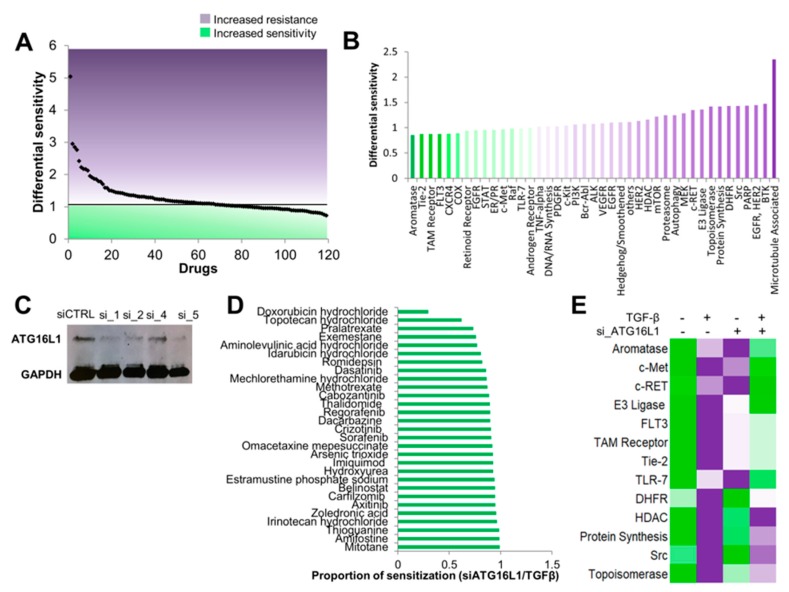
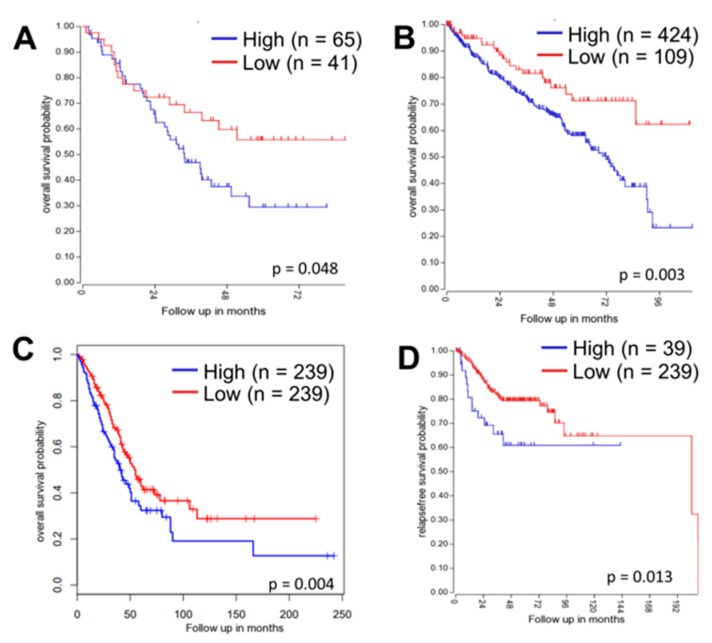
The evolution of therapeutic resistance is a major cause of death for cancer patients. The development of therapy resistance is shaped by the ecological dynamics within the tumor microenvironment and the selective pressure of the host immune system. These selective forces often lead to evolutionary convergence on pathways or hallmarks that drive progression. Thus, a deeper understanding of the evolutionary convergences that occur could reveal vulnerabilities to treat therapy-resistant cancer. To this end, we combined phylogenetic clustering, systems biology analyses, and molecular experimentation to identify convergences in gene expression data onto common signaling pathways. We applied these methods to derive new insights about the networks at play during transforming growth factor-β (TGF-β)-mediated epithelial⁻mesenchymal transition in lung cancer. Phylogenetic analyses of gene expression data from TGF-β-treated cells revealed convergence of cells toward amine metabolic pathways and autophagy during TGF-β treatment. Knockdown of the autophagy regulatory, ATG16L1, re-sensitized lung cancer cells to cancer therapies following TGF-β-induced resistance, implicating autophagy as a TGF-β-mediated chemoresistance mechanism. In addition, high ATG16L expression was found to be a poor prognostic marker in multiple cancer types. These analyses reveal the usefulness of combining evolutionary and systems biology methods with experimental validation to illuminate new therapeutic vulnerabilities for cancer.

Keywords: autophagy; epithelial–mesenchymal transition; evolution; lung cancer; metabolism; systems biology; tumor invasiveness.


Conflict of interest statement

The authors declare no conflict of interest.

Figures

Figure 1
Figure 1
An integrated framework of iterative, systems-level analysis and experimental validation provides new insights. Large amounts of raw data, generated by new experimentation or re-analyzed from public databases (1), are analyzed by clustering approaches to easily visualize data topology (2). This visualization fosters a new, deeper understanding that informs a new hypothesis (3). Experimental validation of the new hypothesis generates new data (4), which is analyzed and visualized as a system (5).
Figure 2
Figure 2
Phylogenetic reconstruction provides a simple visualization tool to view temporal changes in gene expression data. (A) Distance-based phylogeny of GSE23038; serial passage of normal prostate cells immortalized with hTERT using gene expression data as a continuous variable. (B) Maximum-likelihood and (C) maximum parsimony trees constructed based on gene expression data transformed to categorical variables. (D) Single and (E) complete linkage hierarchical clustering provides similar groupings of passage numbers, but lacks the temporal structure.
Figure 3
Figure 3
Phylogenetic clustering enables reconstruction of longitudinal data based on gene expression. (A) Distance, maximum parsimony, and maximum-likelihood dendograms of GSE17708; microarray analysis of A549 cells treated with TGF-β over 72 h. (B) Distance, maximum parsimony, and maximum-likelihood phylogeny construction of GSE12548; TGF-β and TNF-α treatment of human retinal pigment epithelium cells over 60 h.
Figure 4
Figure 4
Visualization of tree topology reveals altered metabolism during epithelial–mesenchymal transition (EMT). (A) The topology of the maximum-likelihood reconstruction of GSE17708 showed an admixed clade at early time points in A549 cells with TGF-β treatment, with a clearly-resolved clade of later time points after eight hours as the phenotypic signal switched from epithelial to mesenchymal. (B) Consistent with the tree topology, changes in EMT biomarkers E-cadherin and vimentin were not apparent until after eight hours of treatment. * indicate p < 0.05 as compared to the 0 h time point (C) Growth curves of A549 cells treated with vehicle (blue circles) or TGF-β (red ×) analyzed by IncuCyte time-lapse imaging revealed TGF-β-induced growth inhibition at 48–72 h. (D) Pathway analysis of genes contributing to the bifurcation of early (<8 h) and late (≥8 h) time point clades revealed TGF-β-induced changes in amine metabolism pathways at the later time points as compared to the early time points. (E) Ammonia production assays validated the prediction that TGF-β induces upregulation of ammonia production.
Figure 5
Figure 5
Epithelial-mesenchymal transition induces activation of autophagy and links to an amine production gene network. (A) TGF-β-induced epithelial-mesenchymal transition led to up-regulation of autophagy markers ATG16L1 and MAP1LC3A (LC3A/B). (B) Densitometric quantification of the western blotting data in A. (C) Cytoscape networks of amine production genes identified in Figure 4 showed few interactions between sub-networks. (D) Addition of the autophagy regulator, ATG16L1 (yellow circle), acted as a central hub to connect all amine metabolism sub-networks.
Figure 6
Figure 6
ATG16L1 knockdown rescues TGF-β-mediated chemoresistance. (A) A screen of 119 FDA-approved small molecule inhibitors demonstrated a broad increase in chemoresistance following TGF-β treatment. Each black dot represents one compound. Dots above the 1 were differentially resistant in TGF-β-treated cells as compared to vehicle-treated cells; dots below the 1 were more sensitive in the TGF-β-treated cells as compared to vehicle-treated cells. (B) Analysis of drug screen data by targets and pathways identified increased TGF-β-mediated resistance to several common chemotherapies, such as microtubule-associated and topoisomerase inhibitor therapies, and targeted therapies in lung cancer treatment, such as c-MET, VEGF, and EGFR (purple bars). (C) Knockdown of ATG16L1 by siRNAs was validated by western blotting. siCtrl = non-silencing siRNA; si_1, si_2, si_4, and si_5 are independent siRNAs targeting ATG16L1 (D) A549 lung adenocarcinoma cells −/+ TGF-β and −/+ siATG16_1 were screened against 119 FDA-approved compounds to identify drugs for which ATG16L1 rescued TGF-β-mediated therapy resistance. ATG16L1 knockdown re-sensitized cells to multiple therapeutic agents. (E) Pathway level analysis of compounds where TGF-β-mediated resistance was rescued by ATG16L1 knockdown.
Figure 7
Figure 7
ATG16L1 is a prognostic biomarker of survival and progression in carcinoma patients. (A) Low ATG16L1 expression is prognostic for improved overall survival in lung adenocarcinoma patients. (B) Low ATG16L1 expression significantly predicts improved overall survival in kidney renal clear cell carcinoma patients. (C) Lower ATG16L1 expression in lung adenocarcinoma from The Cancer Genome Atlas dataset is prognostic for improved overall survival; data analyzed using GEPIA—http://gepia.cancer-pku.cn/. (D) Low ATG16L1 expression trends with better relapse-free survival in colorectal carcinoma patients.

Similar articles

Cited by

References

    1. Chaiwanon J., Wang W., Zhu J.Y., Oh E., Wang Z.Y. Information integration and communication in plant growth regulation. Cell. 2016;164:1257–1268. doi: 10.1016/j.cell.2016.01.044. - DOI - PMC - PubMed
    1. Pawson C.T., Scott J.D. Signal integration through blending, bolstering and bifurcating of intracellular information. Nat. Struct. Mol. Biol. 2010;17:653–658. doi: 10.1038/nsmb.1843. - DOI - PMC - PubMed
    1. Hanahan D., Weinberg R.A. Hallmarks of cancer: The next generation. Cell. 2011;144:646–674. doi: 10.1016/j.cell.2011.02.013. - DOI - PubMed
    1. Janda E., Litos G., Grunert S., Downward J., Beug H. Oncogenic Ras/Her-2 mediate hyperproliferation of polarized epithelial cells in 3D cultures and rapid tumor growth via the PI3K pathway. Oncogene. 2002;21:5148–5159. doi: 10.1038/sj.onc.1205661. - DOI - PubMed
    1. Sever R., Brugge J.S. Signal transduction in cancer. Cold Spring Harb Perspect. Med. 2015;5 doi: 10.1101/cshperspect.a006098. - DOI - PMC - PubMed

LinkOut - more resources