. 2019 Feb 8;7(1):37.
doi: 10.1186/s40425-019-0518-z.

Characterization of immune responses to anti-PD-1 mono and combination immunotherapy in hematopoietic humanized mice implanted with tumor xenografts

Affiliations

Characterization of immune responses to anti-PD-1 mono and combination immunotherapy in hematopoietic humanized mice implanted with tumor xenografts

A Capasso et al. J Immunother Cancer. .

Abstract

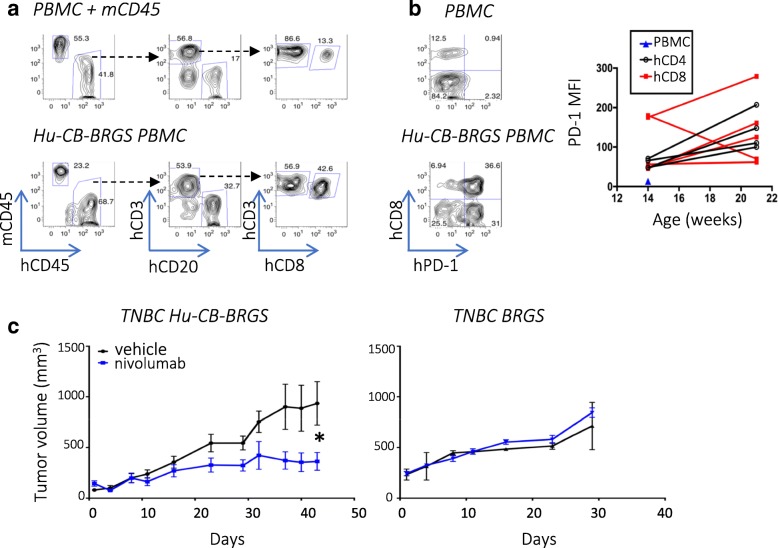
Background: The success of agents that reverse T-cell inhibitory signals, such as anti-PD-1/PD-L1 therapies, has reinvigorated cancer immunotherapy research. However, since only a minority of patients respond to single-agent therapies, methods to test the potential anti-tumor activity of rational combination therapies are still needed. Conventional murine xenograft models have been hampered by their immune-compromised status; thus, we developed a hematopoietic humanized mouse model, hu-CB-BRGS, and used it to study anti-tumor human immune responses to triple-negative breast cancer (TNBC) cell line and patient-derived colorectal cancer (CRC) xenografts (PDX).

Methods: BALB/c-Rag2nullIl2rγnullSIRPαNOD (BRGS) pups were humanized through transplantation of cord blood (CB)-derived CD34+ cells. Mice were evaluated for human chimerism in the blood and assigned into experimental untreated or nivolumab groups based on chimerism. TNBC cell lines or tumor tissue from established CRC PDX models were implanted into both flanks of humanized mice and treatments ensued once tumors reached a volume of ~150mm3. Tumors were measured twice weekly. At end of study, immune organs and tumors were collected for immunological assessment.

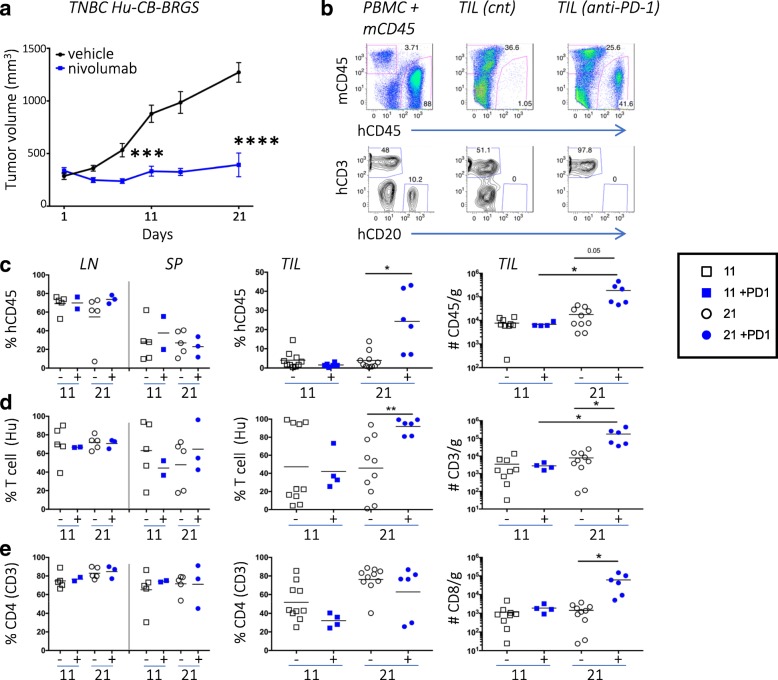
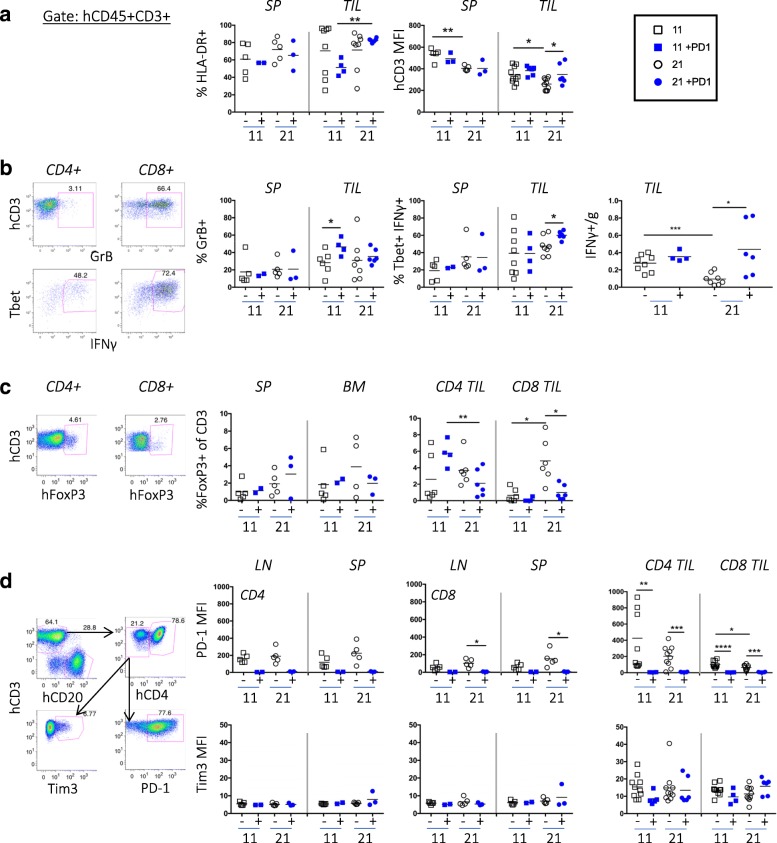
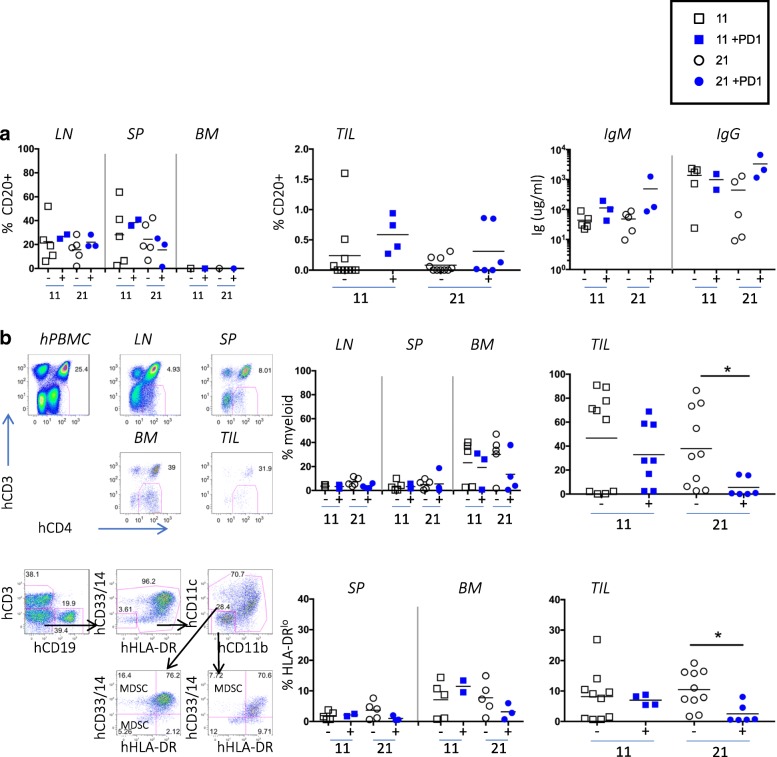
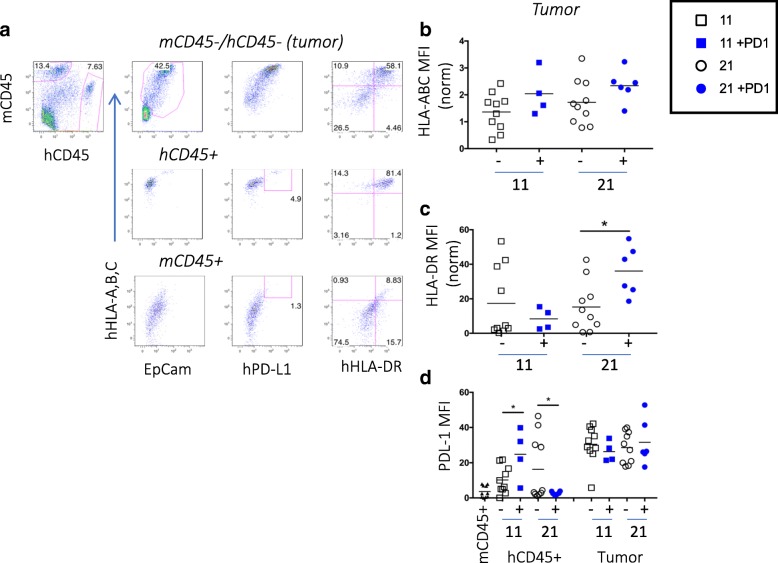
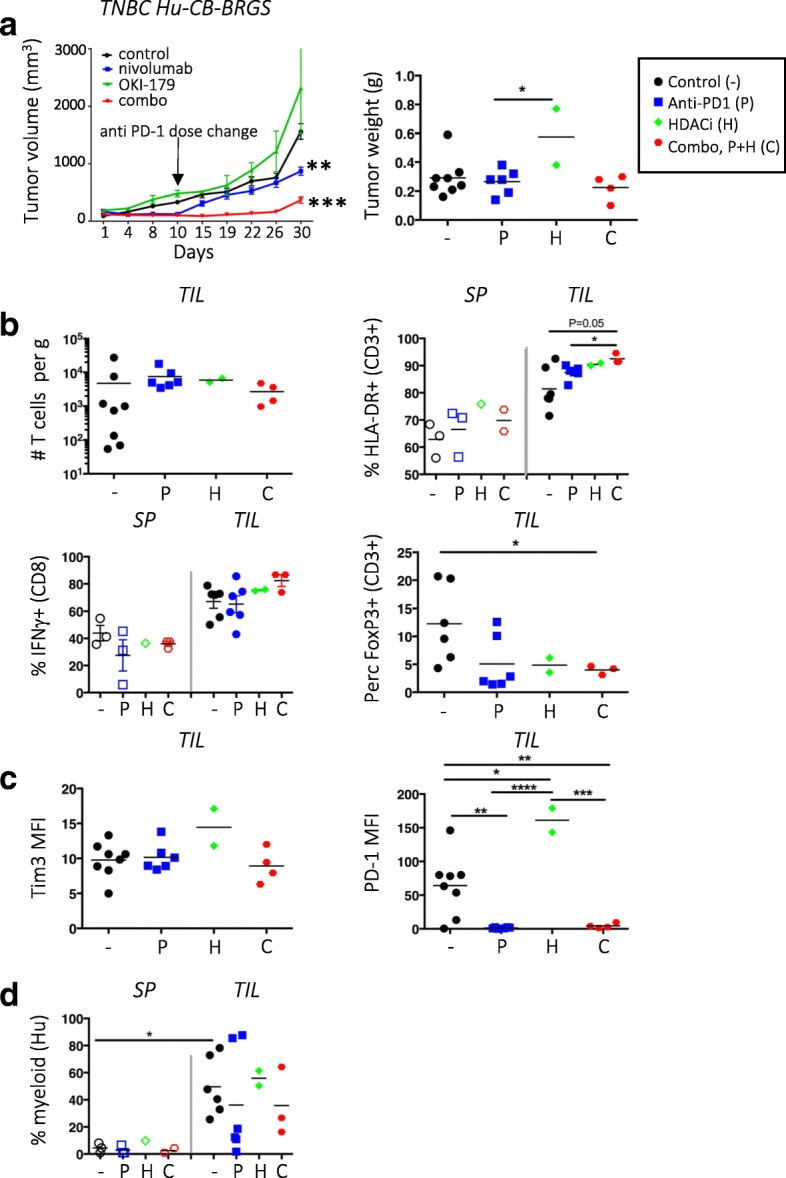
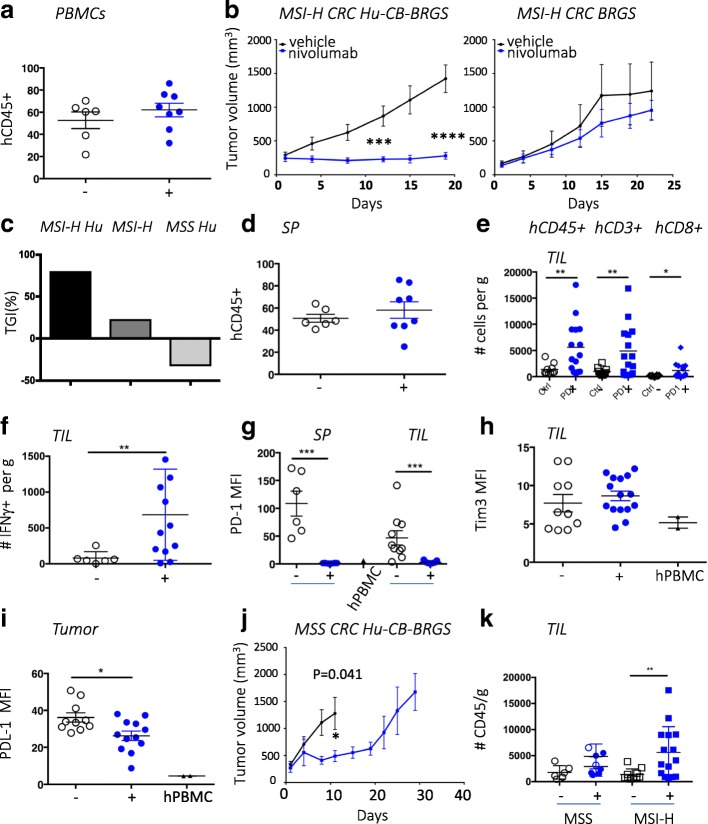
Results: Humanized PDX models were successfully established with a high frequency of tumor engraftment. Humanized mice treated with anti-PD-1 exhibited increased anti-tumor human T-cell responses coupled with decreased Treg and myeloid populations that correlated with tumor growth inhibition. Combination therapies with anti-PD-1 treatment in TNBC-bearing mice reduced tumor growth in multi-drug cohorts. Finally, as observed in human colorectal patients, anti-PD-1 therapy had a strong response to a microsatellite-high CRC PDX that correlated with a higher number of human CD8+ IFNγ+ T cells in the tumor.

Conclusion: Hu-CB-BRGS mice represent an in vivo model to study immune checkpoint blockade to human tumors. The human immune system in the mice is inherently suppressed, similar to a tumor microenvironment, and thus allows growth of human tumors. However, the suppression can be released by anti-PD-1 therapies and inhibit tumor growth of some tumors. The model offers ample access to lymph and tumor cells for in-depth immunological analysis. The tumor growth inhibition correlates with increased CD8 IFNγ+ tumor infiltrating T cells. These hu-CB-BRGS mice provide a relevant preclinical animal model to facilitate prioritization of hypothesis-driven combination immunotherapies.

Keywords: CRC; Combination; Humanized mice; Immunotherapy; Nivolumab; PDX; Pre-clinical; TNBC.


Conflict of interest statement

Ethics approval and consent to participate

All animal studies were conducted with prior approval from the University of Colorado Animal Care and Use Committee and in a facility accredited by the American Association for Accreditation of Laboratory Animal Care. For CB isolation, investigators were blinded from donor identities, and the studies were performed in compliance with University of Colorado Institutional Review Board. Patients undergoing either removal of a primary or metastatic tumor were consented in accordance with IRB-approved institutional protocols.

Consent for publication

Not Applicable.

Competing interests

The authors declare that they have no competing interests.

Publisher’s Note

Springer Nature remains neutral with regard to jurisdictional claims in published maps and institutional affiliations.

Figures

Fig. 1
Fig. 1
Anti-PD-1 therapy inhibits growth of TNBC xenograft in hu-CB-BRGS model. a, PBMCs of humanized mice were analyzed pre-tumor engraftment for expression of mouse (mCD45) and human (hCD45) hematopoietic markers (left panels). The hCD45+ cells were analyzed for expression of T-cell (CD3), B-cell (CD20), and CD8+ T-cell subsets (middle, right panels). A mixture of CB PBMCs and mouse spleen cells served as a positive staining control (top panels). b, Expression of PD-1 on T-cells (hCD45+ CD3+) in PBMCs from a control CB (top) and a 16-week old humanized mouse (bottom). The MFI of PD-1 on CD4+ (black) and most CD8+ (red) T-cells increase with age (right, CD4: P = 0.04; CD8: ns). Chimerism and PD-1 staining results represent > 100 hu-CB-BRGS mice. c, Growth curves of TNBC MDA-MB-231 tumors in nivolumab-treated (blue line) or untreated (black line) hu-CB-BRGS mice (left, n = 6 tumors/3 mice per group) and non-humanized BRGS mice (right, n = 2 tumors per group). P-values: * < 0.05
Fig. 2
Fig. 2
Human T-cell chimerism in lymph organs and tumors of TNBC mice model a, Growth of MDA-MB-231 tumors in hu-CB-BRGS mice treated (blue line) or untreated (black line) with nivolumab is shown. b, Representative flow plots illustrate gating strategy used to determine human T- and B-cell chimerism. Mouse (mCD45) and human (hCD45) Abs were used to detect species-specific hematopoietic cells (top panels) and hCD3 and hCD20 Abs identified T and B cells, respectively, among the hCD45+ gated cells (bottom panels). A mixture of CB (hPBMC) and mouse spleen cells served as positive staining controls and representative flow plots are from TILs of control or anti-PD-1 treated hu-CB-BRGS mice. 10 tumors were analyzed on d11 and d21 in the control group; 4 tumors on d11 and 6 tumors on d21 were analyzed in the anti-PD-1-treated group. Human immune cell (c), T-cell (d) and CD4 T-cell (e) chimerism in lymph organs and tumors of hu-CB-BRGS mice. CD4+ T-cells are gated on hCD45 + hCD3+. CD8 T-cells are calculated as CD4-negative T-cells. Left panels show percentages in lymph organs, middle panels show frequencies and right panels show relative cell numbers in TILs. Each point represents data from the indicated organ from an individual hu-CB-BRGS mouse that was either untreated (−, black) or treated with nivolumab (+, blue) for 11 or 21 days. P-values: * < 0.05, **** < 0.0001
Fig. 3
Fig. 3
T-cell activation and cytotoxic function in TILs from TNBC-bearing hu-CB-BRGS mice treated with nivolumab. a, Quantification of human T-cells (hCD45 + CD3+) that were stained for expression of activation-marker HLA-DR (left) or CD3 (right). b, Representative flow cytometric analyses showing gating strategy for identification of GrB and IFNγ secreting T-cells. Frequency of GrB+ (left), Tbet+IFNg+ (middle) and number of IFNγ+ (right) among human T-cells. c, Representative flow cytometric analyses (left) showing gating strategy for identification of Treg (FoxP3+) cells and data from each tissue is shown in graphs (right). d, Representative flow cytometric analyses showing gating strategy to measure expression levels of human PD-1 and Tim3 inhibitory receptors on T-cells from hu-CB-BRGS mice. The MFI expression of PD-1 and Tim3 is determined for both CD4 and CD8 T-cell subsets and graphed in top (PD-1) and bottom (Tim3) panels. Each dot represents data from the indicated organ from an individual hu-CB-BRGS mouse that was either untreated (−, black) or treated with nivolumab (+, blue) for 11 or 21 days, as indicated. P-values: * < 0.05, ** < 0.01, *** < 0.001, **** < 0.0001
Fig. 4
Fig. 4
Few B-cells and many myeloid human cells in TILs of TNBC-engrafted hu-CB-BRGS mice. a, No change observed in human B-cell frequencies (left, middle panels) or function (hIgM and IgG concentrations in serum, right panel) in tumor-bearing, humanized mice with nivolumab treatment. b, Decreased human myeloid cell frequencies in TNBC tumors treated with nivolumab. The upper plots depict the flow cytometry gating strategy for identification of the CD4 + CD3- myeloid population among hCD45+ cells from hPBMC (staining control), and indicated organs of a humanized mouse engrafted with TNBC cell line and data from each mouse is shown in upper right graphs. The lower plots show flow cytometry gating (left) for myeloid populations. The myeloid cells are also identified as hCD45+, CD3-, CD19-, (CD14+, CD33+, CD11b + or CD11c+) and the frequency of the HLA-DRlo/− population among these cells is shown. Each dot represents data from the indicated organ from an individual humanized mouse that was either untreated (−, black) or treated with nivolumab (+, blue) for 11 or 21 days, as indicated. P-values: * < 0.05
Fig. 5
Fig. 5
Human PD-L1, MHC class I and class II expression on MDA-MB-231 tumors excised from hu-CB-BRGS. a, Representative flow cytometric analyses for expression of HLA-A,B,C (MHC class I), HLA-DR (MHC class II) and hPD-L1 in digested tumor cell suspensions. The tumor cells are defined as mCD45-, hCD45-, HLA-A,B,C+, Epcam+. The mouse (mCD45) and human (hCD45) hematopoietic cells serve as negative and positive control, respectively. The MFI of HLA-A,B,C (b), HLA-DR (c) and PD-L1 (d) staining is plotted for each tumor. Expression of HLA molecules is normalized to the positive control stained at the same time. Each dot represents data from a tumor from a humanized mouse that was either untreated (−, black) or treated with nivolumab (+, blue) for 11 or 21 days, as indicated. P-values: * < 0.05
Fig. 6
Fig. 6
Combination therapy of HDAC inhibitor and nivolumab slows growth of TNBC xenograft in hu-CB-BRGS mice. a, Tumor growth curves of MDA-MB-231 TNBC xenografts implanted into hu-CB-BRGS mice that were treated with either control (black), nivolumab (blue), OKI-179 HDACi alone (green), or combination (red). Tumor weights from end of study mice at d30 harvest (control-4 mice/8 tumors; nivolumab-3 mice/6 tumors, OKI-179-1 mouse/2 tumors, combo-2 mice/4 tumors). b, T-cell (hCD45 + CD3+) number (top left), frequency of HLA-DR+ of CD3+ (top right), IFNγ+ of CD8+ (bottom left) and FoxP3+ of CD3+ (bottom right) in TILs or lymph organs of TNBC-implanted humanized mice. c, MFI of Tim3 (left) or PD-1 (right) on T-cells from TILs. d, Frequency of myeloid cells among the hCD45+ population in increased in TILs relative to spleens. Each point represents data from the indicated organ from an individual humanized mouse that was either untreated (−,black), treated with nivolumab (P, blue), OKI-179 (H, green) or both (C, red). P-values: * < 0.05, ** < 0.01, *** < 0.001, **** < 0.0001
Fig. 7
Fig. 7
Nivolumab inhibits growth of a MSI-H CRC PDX that correlates with increased human T cells in the tumor compared to the untreated MSI-H CRC PDX or a less-responsive MSS CRC-PDX in hu-CB-BRGS mice. a, Human hematopoietic (hCD45+) chimerism in the blood prior to CRC MSI-H PDX implantation. b, Tumor growth curves of MDA-C099–203 CRC-PDX (MSI-H) implanted into humanized (left) or non-humanized (right) BRGS mice. Hu-CB-BRGS control group: n = 6 mice/10 tumors; nivolumab group: n = 8 mice/15 tumors. BRGS control group: n = 2 mice/3 tumors; nivolumab group: 3 mice/6 tumors. c, Tumor growth inhibition comparison in the hu-CB-BRGS MSI-H, BRGS MSI-H and hu-CB-BRGS MSS mice. d, Human hematopoietic (hCD45+) chimerism in the spleen of CRC-MSI-H bearing hu-CB-BRGS mice. e-i, Immune measurements, as assessed using flow cytometry, of TILs or spleen from CRC MSI-H implanted humanized mice treated (+) or not (−) with nivolumab. e, The number of human (hCD45+), T (hCD3+) and CD8 (CD3 + CD8+) T-cells in the TILs. f, The numbers of IFNγ-producing T cells in the TILs (gate: hCD45 + CD3+). The MFI of inhibitory receptors PD-1 (g) and Tim3 (h) on human T cells (hCD45 + CD3+). Human PBMCs served as control. i, The MFIs of PD-L1 expression on the CRC MSI-H PDX tumors excised from the humanized mice were determined on the hCD45-mCD45-Epcam+HLA-A,B,C+ population in the TILs. j, Tumor growth curves of CRC172 MSS PDX in hu-CB-BRGS mice (n = 4 mice/8 tumors per group). k, The number of hCD45+ cells in the TILs of either the MSS CRC172 PDX or the MSI-H MDA-C099–203 PDX grown in the hu-CB-BRGS. Open circles in MSS nivolumab treated mice represent tumors from the nivolumab-treated hu-CB-BRGS mouse harvested d10 after start of treatment, with the control mice, while closed blue circles are from the 3 treated hu-CB-BRGS MSS mice harvested on d30. All MSI-H bearing hu-CB-BRGS mice were harvested d23–24 after start of nivolumab. Each point represents data from the indicated organ from an individual hu-CB-BRGS mouse that was either untreated (−, black) or treated with nivolumab (+, blue), as indicated. P-values: * < 0.05, ** < 0.01, *** < 0.001, **** < 0.0001

References

    1. Coffelt SB, de Visser KE. Immune-mediated mechanisms influencing the efficacy of anticancer therapies. Trends Immunol. 2015;36:198–216. doi: 10.1016/j.it.2015.02.006. - DOI - PubMed
    1. Ansell SM, et al. PD-1 blockade with nivolumab in relapsed or refractory Hodgkin's lymphoma. N Engl J Med. 2015;372:311–319. doi: 10.1056/NEJMoa1411087. - DOI - PMC - PubMed
    1. Herbst RS, et al. Predictive correlates of response to the anti-PD-L1 antibody MPDL3280A in cancer patients. Nature. 2014;515:563–567. doi: 10.1038/nature14011. - DOI - PMC - PubMed
    1. Topalian SL, et al. Survival, durable tumor remission, and long-term safety in patients with advanced melanoma receiving nivolumab. J Clin Oncol. 2014;32:1020–1030. doi: 10.1200/JCO.2013.53.0105. - DOI - PMC - PubMed
    1. Topalian SL, et al. Mechanism-driven biomarkers to guide immune checkpoint blockade in cancer therapy. Nat Rev Cancer. 2016;16:275–287. doi: 10.1038/nrc.2016.36. - DOI - PMC - PubMed

Publication types

MeSH terms

Substances