Comparison of Apnea Detection Using Oronasal Thermal Airflow Sensor, Nasal Pressure Transducer, Respiratory Inductance Plethysmography and Tracheal Sound Sensor
- PMID: 30736876
- PMCID: PMC6374099
- DOI: 10.5664/jcsm.7634
Comparison of Apnea Detection Using Oronasal Thermal Airflow Sensor, Nasal Pressure Transducer, Respiratory Inductance Plethysmography and Tracheal Sound Sensor
Abstract
Study objectives: Evaluation of apnea detection using a tracheal sound (TS) sensor during sleep in patients with obstructive sleep apnea.
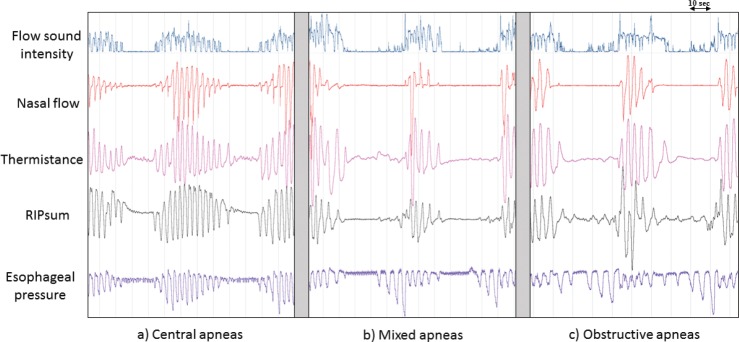
Methods: Polysomnographic recordings of 32 patients (25 male, mean age 66.7 ± 15.3 years, and mean body mass index 30.1 ± 4.5 kg/m2) were analyzed to compare the detection of apneas by four different methods of airflow signals: oronasal thermal airflow sensor (thermistor), nasal pressure transducer (NP), respiratory inductance plethysmography (RIPsum) and TS. The four used signals were scored randomly and independently from each other according to American Academy of Sleep Medicine rules. Results of apnea detection using NP, RIPsum and TS signals were compared to those obtained by thermistor as a reference signal.
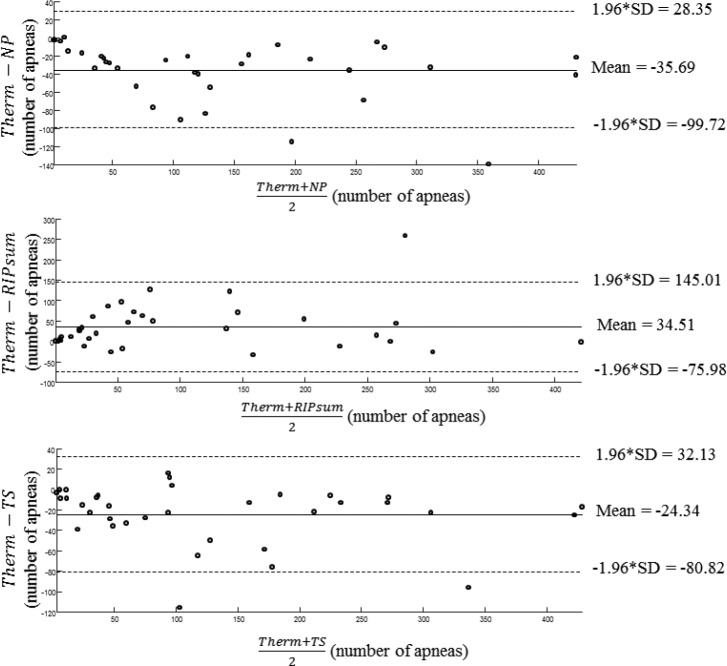
Results: The number of apneas detected by the thermistor was 4,167. The number of apneas detected using the NP was 5,416 (+29.97%), using the RIPsum was 2,959 (-29.71%) and using the TS was 5,019 (+20.45%). The kappa statistics (95% confidence interval) were 0.72 (0.71 to 0.74) for TS, 0.69 (0.67 to 0.70) for NP, and 0.57 (0.55 to 0.59) for RIPsum. The sensitivity/specificity (%) with respect to the thermistor were 99.23/69.27, 64.07/93.06 and 96.06/76.07 for the NP, RIPsum and TS respectively.
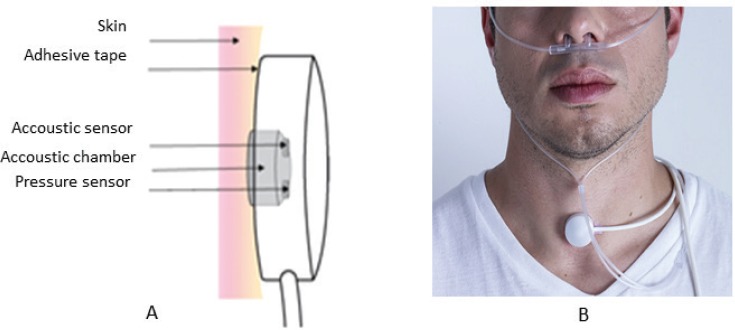
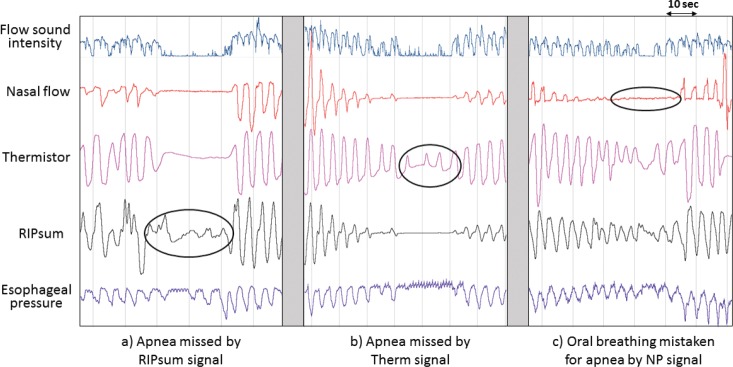
Conclusions: With the sensor placed properly on the suprasternal notch, tracheal sounds could help detecting apneas that are underscored by the RIPsum and identify apneas that may be overscored by the NP sensor due to mouth breathing. In the absence of thermistor, TS sensors can be used for apnea detection.
Clinical trial registration: Registry: German Clinical Trials Register (DRKS), Title: Using the tracheal sound probe of the polygraph CID102 to detect and differentiate obstructive, central, and mixed sleep apneas in patients with sleep disordered breathing, Identifier: DRKS00012795, URL: https://www.drks.de/drks_web/navigate.do?navigationId=trial.HTML&TRIAL_ID=DRKS00012795.
Keywords: flow measurement; home sleep apnea test; obstructive sleep apnea; polysomnography; sleep-disordered breathing; tracheal sound.
© 2019 American Academy of Sleep Medicine.
Figures
References
-
- Berry RB, Budhiraja R, Gottlieb DJ, et al. Rules for scoring respiratory events in sleep: update of the 2007 AASM Manual for the Scoring of Sleep and Associated Events. Deliberations of the Sleep Apnea Definitions Task Force of the American Academy of Sleep Medicine. J Clin Sleep Med. 2012;8(5):597–619. - PMC - PubMed
-
- Goodwin JL, Enright PL, Kaemingk KL, et al. Feasibility of using unattended polysomnography in children for research--report of the Tucson Children's Assessment of Sleep Apnea study (TuCASA) Sleep. 2001;24(8):937–944. - PubMed
-
- Redline S, Sanders MH, Lind BK, et al. Methods for obtaining and analyzing unattended polysomnography data for a multicenter study. Sleep Heart Health Research Group. Sleep. 1998;21(7):759–767. - PubMed
Publication types
MeSH terms
Associated data
LinkOut - more resources
Full Text Sources
Medical
Miscellaneous