. 2019 Mar 20;101(6):1099-1108.e6.
doi: 10.1016/j.neuron.2019.01.014. Epub 2019 Feb 5.

Fibrinogen Induces Microglia-Mediated Spine Elimination and Cognitive Impairment in an Alzheimer's Disease Model

Affiliations

Fibrinogen Induces Microglia-Mediated Spine Elimination and Cognitive Impairment in an Alzheimer's Disease Model

Mario Merlini et al. Neuron. .

Abstract

Cerebrovascular alterations are a key feature of Alzheimer's disease (AD) pathogenesis. However, whether vascular damage contributes to synaptic dysfunction and how it synergizes with amyloid pathology to cause neuroinflammation and cognitive decline remain poorly understood. Here, we show that the blood protein fibrinogen induces spine elimination and promotes cognitive deficits mediated by CD11b-CD18 microglia activation. 3D molecular labeling in cleared mouse and human AD brains combined with repetitive in vivo two-photon imaging showed focal fibrinogen deposits associated with loss of dendritic spines independent of amyloid plaques. Fibrinogen-induced spine elimination was prevented by inhibiting reactive oxygen species (ROS) generation or genetic ablation of CD11b. Genetic elimination of the fibrinogen binding motif to CD11b reduced neuroinflammation, synaptic deficits, and cognitive decline in the 5XFAD mouse model of AD. Thus, fibrinogen-induced spine elimination and cognitive decline via CD11b link cerebrovascular damage with immune-mediated neurodegeneration and may have important implications in AD and related conditions.

Keywords: blood-brain barrier; coagulation; complement; dementia; dendritic spines; fibrin; iDISCO; innate immunity; multiple sclerosis; neurovascular.


Conflict of interest statement

DECLARATION OF INTERESTS

H. Lundbeck A/S sponsored research in K.A.'s laboratory at the Gladstone Institutes. K.A. is a founder of MedaRed, Inc. Her interests are managed by the Gladstone Institutes in accordance with its conflict-of-interest policy. R.B.N. was an employee of Lundbeck during the time this work was performed.

Figures
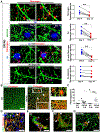
Figure 1.
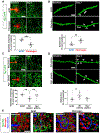
Figure 1.. Dendritic Spine Elimination around Fibrinogen Deposits in 5XFAD Mice
(A) Longitudinal in vivo 2P imaging of turnover of spines (AAV-synapsin:GFP, green), fibrinogen (Alexa594-labeled fibrinogen, red), and Aβ plaques (Methoxy-X04, blue) in the cortex of 7-08-month-old 5XFAD mice. Images were acquired in the same cortical area on Day 0 and Day 14. “Fibrinogen”: Spines in areas with fibrinogen deposits located >50 μm from Aβ plaques. “”: Spines located within 50 μm from Aβ plaques without fibrinogen deposits. “Aβ with fibrinogen”: Spines located within 50 μm from Aβ plaques with fibrinogen deposits. “No deposits”: Spines located >50 μm from either Aβ plaques or fibrinogen deposits. Arrowheads indicate stable (magenta) and lost (white) spines on day 14 as compared to day 0. Maximum z-projections are shown. Scale bar = 10 μm. Dendritic spine density was assessed on 30–36 dendrites for each mouse. Values are mean ± SEM. n = 6 mice. **p < 0.001 by two-tailed unpaired Student’s t-tests. (B) 3D immunolabeling of cleared brain of a 10-month-old 5XFAD mouse and WT littermate control for CD31 (green) and fibrinogen (red). Fibrinogen deposits (inset 1) and perivascular fibrinogen (arrows and inset 2) are shown in the 5XFAD hippocampus, but not in WT control mice. Scale bar = 100 μm. Quantification of hippocampal fibrinogen deposits in WT and 5XFAD mice at 5 and 10 months (M) of age. n = 5–7 mice per group. Values are mean ± SEM. *p < 0.05, **p < 0.01 by two-way ANOVA with Bonferroni post hoc test.. (C–F) 3D immunolabeling of cleared brains from patients with AD and NDCTRL subjects stained for CD31 (green), fibrinogen (red), and Aβ (blue). Arrows and asterisks indicate vessel-associated and parenchymal fibrinogen, respectively; # indicates intravascular fibrinogen. Magenta in (D) indicates Aβ-associated fibrinogen. (E) Vascular tortuosity observed in three out of the five AD brains. Representative images are shown. Scale bars = 75 μm (C), 25 μm (D), 25 μm (E), and 75 μm (F).
Figure 2.
Figure 2.. Fibrinogen is Sufficient to Induce Dendrite and Spine Loss in the Healthy Brain
(A) Longitudinal in vivo 2P imaging of dendrites (green) in the cortex of Thy1-YFP mice before (Baseline) and after local injection of vehicle (ACSF) or human fibrinogen (red) (Day 3). The injection electrode is indicated in red. Maximum z-projections are shown. Scale bar = 25 μm. All dendrites remaining over baseline were quantified per mouse. n = 6 mice per condition. Values are mean ± SEM. **p < 0.01, ***p < 0.001 by two-tailed unpaired Student’s t-test. (B) Longitudinal in vivo 2P imaging of spine turnover in the cortex of the Thy1-YFP mice shown in (A). Arrowheads indicate lost spines on day 3. Maximum z-projections are shown. Scale bar = 10 μm. Quantification of spines lost over baseline. 40–70 spines were followed per mouse. n = 6 mice per condition. Values are mean ± SEM. **p < 0.01, ***p < 0.001 by two-tailed unpaired Student’s t-test. (C) Longitudinal in vivo 2P imaging of dendrites (green) in the cortex of Thy1-YFP mice before (Baseline) and after local injection of plasma from WT or Fga−/− mice (Day 3). Injection electrode is indicated in red. Maximum z-projections are shown. Scale bar = 25 μm. All dendrites remaining over baseline were quantified per mouse. ACSF: n = 6, WT plasma: n = 8, Fga−/− plasma: n = 9 mice. Values are mean ± SEM. **p < 0.01 by one-way ANOVA and Bonferroni post hoc analysis. (D)Longitudinal in vivo 2P imaging of spine turnover in the cortex of the Thy1-YFP mice shown in (C). Injection electrode is indicated in red. Maximum z-projections are shown. Scale bar = 10 μm. Quantification of spines lost over baseline. 40–70 spines were followed per mouse. ACSF: n = 6 mice, WT plasma: n = 8 mice, Fga−/− plasma: n = 9 mice. Values are mean ± SEM. *p < 0.05 by one-way ANOVA and Bonferroni post hoc analysis. (E)Longitudinal in vivo 2P imaging of microglia (GFP, pseudo-colored in red), dendrites (YFP, yellow-green), and blood vessels (Cascade Blue 10kDa dextran, blue) in the cortex of a 12-week-old Thy1-YFP: Cx3cr1GFP/+ mouse before (Baseline) and after local injection of ACSF vehicle or fibrinogen (Day 3). Representative 3D volume z-projections are shown. Scale bar = 25 μm.
Figure 3.
Figure 3.. Fibrinogen induces Dendrite and Spine Loss through CD11b/CD18 Receptor and ROS Generation
(A) Longitudinal in vivo 2P imaging of dendrites (green) in the cortex of control Thy1-YFP mice and Thy1-YFP:Itgam−/− mice before (Baseline) and on day 3 after local injection of vehicle (ACSF) or fibrinogen. Injection electrode is indicated in red. Maximum z-projections are shown. Scale bar = 25 μm. All dendrites remaining over baseline were quantified per mouse. n = 6–7 mice per group. Values are mean ± SEM. **p < 0.01 by one-way ANOVA with Bonferroni post hoc analysis. (B) Longitudinal in vivo 2P imaging of spine turnover in the cortex of the Thy1-YFP and Thy1-YFP:ItgamT−/− mice shown in (A). Arrowheads indicate lost spines on day 3, compared to baseline. Maximum z-projections are shown. Scale bar = 10 μm. Quantification of spines lost over baseline. 40–70 spines were followed per mouse. n = 6–7 mice per group. Values are mean ± SEM. **p < 0.01 by one-way ANOVA with Bonferroni post hoc analysis. (C) Longitudinal in vivo 2P imaging of microglia (GFP, pseudo-colored in red), dendrites (yellow-green), and ROS (Amplex® Ultra Red, pseudo-colored in blue) in the cortex of a 10-week-old Thy1-YFP:Cx3cr1GFP/+ mouse before (Baseline) and after local injection of vehicle (ACSF) or fibrinogen (Day 3). 3D volume z projections are shown. Scale bar = 25 μm. Quantification of ROS signal. n = 5 mice per condition. Values are mean ± SEM. *p < 0.05 by two-tailed unpaired Student’s t-test. (D) Longitudinal in vivo 2P imaging of dendrites (green) in the cortex of Thy1-YFP mice before (Baseline) and after local injection of fibrinogen + vehicle (ACSF) or fibrinogen + apocynin (Day 3). Injection electrode is indicated in red. Maximum z-projections are shown. Scale bar = 25 μm. All dendrites remaining over baseline were quantified per mouse. Values are mean ± SEM. *p < 0.05, **p < 0.01 by one-way ANOVA and Bonferroni post hoc analysis. (E) Spine turnover in the cortex of the Thy1-YFP mice shown in (D). Arrowheads indicate lost spines at day 3. Injection electrode is indicated in red. Maximum z-projections are shown. Scale bar = 10 μm. Quantification of spines lost over baseline. 40–70 spines were followed per mouse. n = 6–7 mice per group. Values are mean ± SEM. *p < 0.05 by one-way ANOVA and Bonferroni post hoc analysis.
Figure 4.
Figure 4.. Mutation of the Fibrinogen Binding Site to CD11b Prevents Neurodegeneration and Cognitive Impairment
(A) Spatial learning and memory in 9–10-month-old mice of the indicated genotype with the active place avoidance test. Habituation to the apparatus (H) was followed by training trials 1–4, a probe trial (P), and a reinstatement trial (R). Number of entries into the aversive zone (left) and number of shocks received after entry into this zone (right) were used as the main outcome measures. WT: n = 14, 5XFAD: n = 8, 5XFAD:Fggγ390–396A: n = 16, Fggγ390–396A: n = 11 mice. Values are mean ± SEM. *p < 0.05 **, p < 0.01 by two-way ANOVA with Bonferroni’s post hoc test. (B) Maximum z-projections showing neuronal somata and dendrites (MAP2), presynaptic terminals (synaptophysin), lysosomes (LAMP-1), amyloid β Aβ; 6E10 antibody), and microglia (Iba1) in the dentate gyrus of the WT, 5XFAD, and 5XFAD:Fggγ390–396A mice tested behaviorally in (A). Arrow head in the merged MAP2–synaptophysin image of the WT mouse indicates close association of synaptophysin staining with MAP2-positive neuronal somata. Asterisks in the merged MAP2–synaptophysin images indicate loss of this association. Scale bar = 25 μm. Three brain sections were analyzed per mouse for staining quantification. ROI, region of interest. ND, not detected (large clusters of LAMP-1-positive structures). WT: n = 5, 5XFAD: n = 8, 5XFAD:Fggγ390–396A: n = 13 mice. Values are mean ± SEM. *p < 0.05, **p < 0.01, ***p < 0.001 by one-way ANOVA and Bonferroni post hoc test or two-tailed unpaired Student’s t-test.

Comment in

References

    1. Adams RA, Bauer J, Flick MJ, Sikorski SL, Nuriel T, Lassmann H, Degen JL, and Akassoglou K (2007). The fibrin-derived gamma377-395 peptide inhibits microglia activation and suppresses relapsing paralysis in central nervous system autoimmune disease. J Exp Med 204, 571–582. - PMC - PubMed
    1. Akoudad S, Wolters FJ, Viswanathan A, de Bruijn RF, van der Lugt A, Hofman A, Koudstaal PJ., Ikram MA, and Vernooij MW (2016). Association of cerebral microbleeds with cognitive decline and dementia. JAMA Neurol 73, 934–943. - PMC - PubMed
    1. Barker R, Ashby EL, Wellington D, Barrow VM., Palmer JC, Kehoe PG, Esiri MM, and Love S (2014). Pathophysiology of white matter perfusion in Alzheimer's disease and vascular dementia. Brain 137, 1524–1532. - PMC - PubMed
    1. Bien-Ly N, Boswell CA, Jeet S, Beach TG, Hoyte K, Luk W, Shihadeh V, Ulufatu S, Foreman O, Lu Y, et al. (2015). Lack of widespread BBB disruption in Alzheimer's disease models: Focus on therapeutic antibodies. Neuron 88, 289–297. - PubMed
    1. Bittner T, Burgold S, Dorostkar MM, Fuhrmann M, Wegenast-Braun BM, Schmidt B, Kretzschmar H, and Herms J (2012). Amyloid plaque formation precedes dendritic spine loss. Acta Neuropathol 124, 797–807. - PMC - PubMed

Publication types

MeSH terms