

Defining multistep cell fate decision pathways during pancreatic development at single-cell resolution
- PMID: 30737258
- PMCID: PMC6463266
- DOI: 10.15252/embj.2018100164
Defining multistep cell fate decision pathways during pancreatic development at single-cell resolution
Abstract
The generation of terminally differentiated cell lineages during organogenesis requires multiple, coordinated cell fate choice steps. However, this process has not been clearly delineated, especially in complex solid organs such as the pancreas. Here, we performed single-cell RNA-sequencing in pancreatic cells sorted from multiple genetically modified reporter mouse strains at embryonic stages E9.5-E17.5. We deciphered the developmental trajectories and regulatory strategies of the exocrine and endocrine pancreatic lineages as well as intermediate progenitor populations along the developmental pathways. Notably, we discovered previously undefined programs representing the earliest events in islet α- and β-cell lineage allocation as well as the developmental pathway of the "first wave" of α-cell generation. Furthermore, we demonstrated that repressing ERK pathway activity is essential for inducing both α- and β-lineage differentiation. This study provides key insights into the regulatory mechanisms underlying cell fate choice and stepwise cell fate commitment and can be used as a resource to guide the induction of functional islet lineage cells from stem cells in vitro.
Keywords: MAPK/ERK; cell fate choice; fate map; pancreatic lineage; single‐cell RNA‐seq.
© 2019 The Authors.
Conflict of interest statement
The authors declare that they have no conflict of interest.
Figures
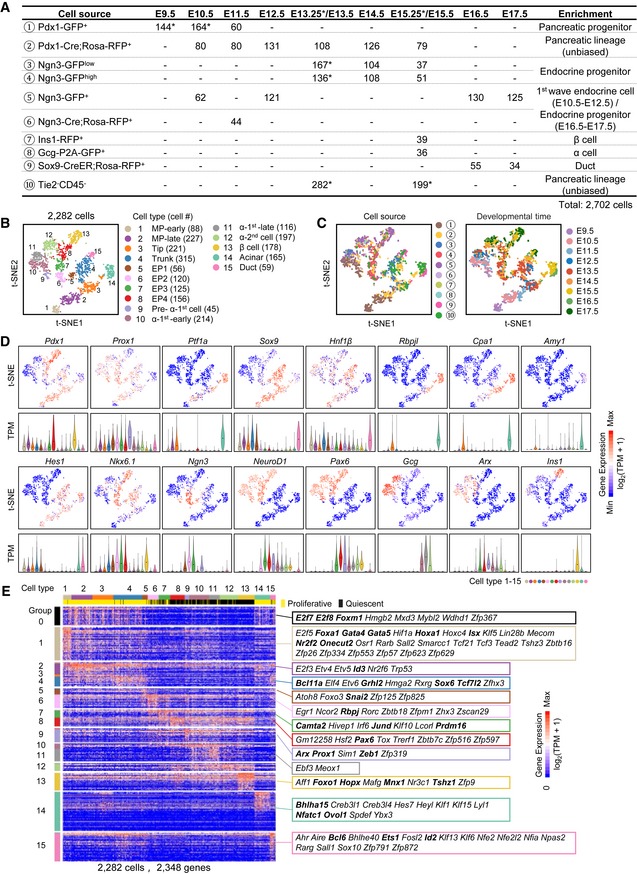
Overview of the 2,702 fetal pancreatic cells analyzed in this study. The numbers show the cell counts from the indicated mouse strains at different developmental time points. The mouse strains (cell sources) are numbered with the circled numbers. * represents the indicated population including the cells from published resources (see Fig EV1A for details).
The t‐SNE plot shows 15 distinct cell types. Each dot represents a single cell. Cell counts are labeled in brackets.
The t‐SNE plots show the enriched cell source (left), the circled number indicating the cell source labeled in (A), and developmental time (right).
Expression levels of marker genes are projected onto t‐SNE plots. The colors ranging from blue to red indicate low to high relative gene expression levels. The violin plot under the t‐SNE plot shows the expression level (TPM) of the indicated gene in each cell type. The dot within each violin plot indicates the median of expression levels.
Heat map of cell type‐enriched genes. Each column represents a single cell, and each row represents one gene. Cell cycle‐related genes were extracted as group‐0. TFs of each gene group are labeled. The bolded TFs are known to be important for pancreas development. The colors ranging from blue to red indicate low to high relative gene expression levels.
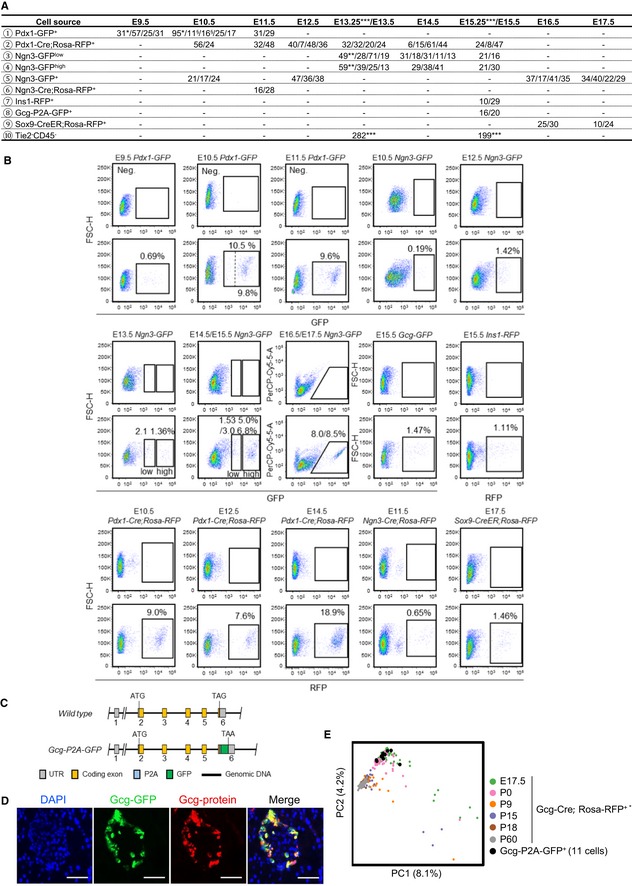
Overview of the 2,702 fetal pancreatic cells analyzed in this study. The numbers separated by slashes represent the number of cells produced in each experiment. § represents the cells from Pdx1‐GFP highly expressing cells, *represents the single‐cell datasets from published resources (GEO: GSE86225; Li et al, 2018), **represents the single‐cell datasets from published resources (GEO: GSE84324; Yu et al, 2018), and ***represents the single‐cell datasets from published resources (GEO: GSE89798; Sznurkowska et al, 2018).
FACS gating strategies for purifying pancreatic cells at multiple developmental stages from various mouse strains. The pancreatic tissues from WT embryos were used as negative controls (upper panel). The dashed line in the “E10.5 Pdx1‐GFP” gating plot separates the cells with higher GFP expression from cells with lower expression.
Generation of the Gcg‐P2A‐GFP strain by inserting P2A and GFP DNA sequences before the stop codon.
Immunofluorescence staining of the GCG in 8‐week‐old mouse islets verified the high quality of the Gcg‐P2A‐GFP strain. Scale bars: 50 μm.
PCA plot of single‐cell transcriptomes of E17.5 GFP+ cells from the Gcg‐P2A‐GFP mouse strain and α cells from published data (GEO: GSE87375; Qiu et al, 2017a). Each dot represents a single cell.
- A
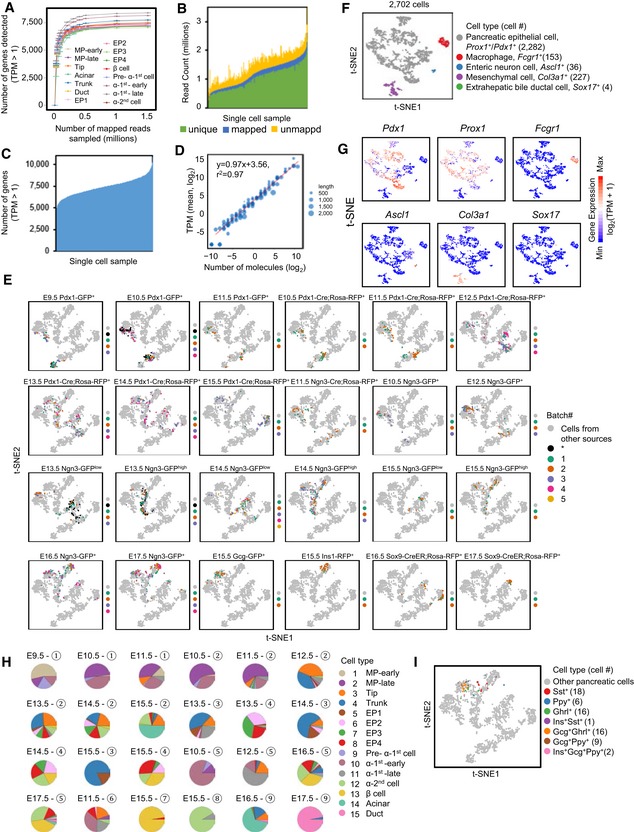
Saturation analysis indicated that 0.2 million mapped reads were sufficient to cover most of the genes detected in a single cell. Each point represents the mean of four independent subsamplings. Error bars: SEM.
- B, C
Statistical analysis of the alignment (B) and detected genes (C) for available single‐cell samples. Each bar represents one sample.
- D
Correlations between the number of mRNA molecules and TPM values. Each point represents an ERCC spike‐in. Point size reflects transcript length.
- E
The t‐SNE plots showed no obvious batch effects of replicated experiments. * indicates cells from our recently published work (Li et al, 2018; Yu et al, 2018).
- F
t‐SNE analysis identified nonpancreatic and pancreatic epithelial lineage cells. The color code, marker gene, and cell count for each cell type are provided next to the t‐SNE plot.
- G
Expression patterns of marker genes in (F).
- H
The overview of cell type distribution in certain mouse strains at various time points. The circled number indicates the cell source labeled in Fig 1A. The colors denote the cell types shown in Fig 1B.
- I
Cells expressing Sst, Ghrl and Ppy (TPM > 10,000) are projected onto the t‐SNE plot of Fig 1B.
- A
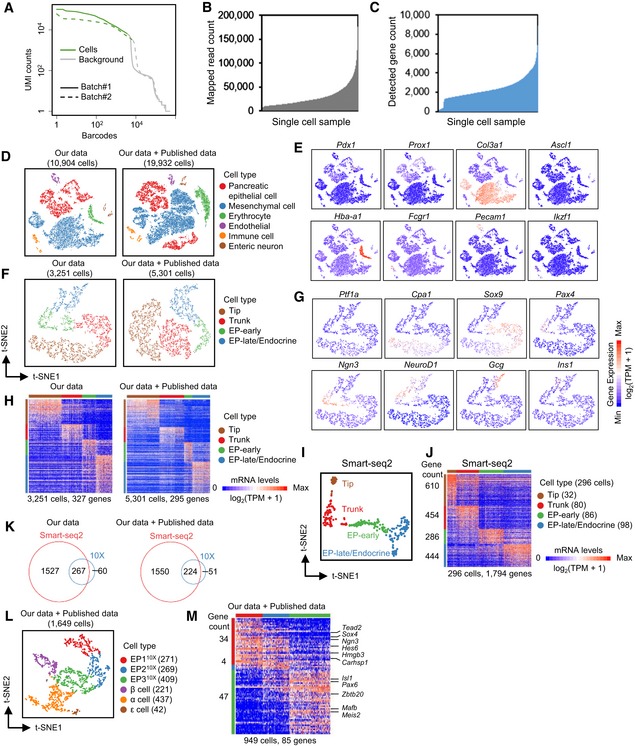
Barcode‐labeled cells (green) were identified using the cellranger program (10X Genomics). The y‐axis represents the count of UMI (unique molecular identifiers) associated with each individual barcode.
- B, C
Statistical analyses of mapped reads (B) and detected genes (C) for available 10X Genomics samples.
- D
t‐SNE analysis identified pancreatic epithelial cells and nonpancreatic lineage cells. The published data are from (GEO: GSE101099; Byrnes et al, 2018).
- E
Expression pattern of marker genes of various lineages in our data in (D).
- F
t‐SNE analysis of the 10X Genomics data identified four pancreatic cell groups in E14.5 pancreas. The published data are from (GEO: GSE101099; Byrnes et al, 2018).
- G
Expression patterns of marker genes in different groups in (F).
- H
Heat maps showing the expression of the group‐enriched genes identified from the 10X Genomics data. Each column represents a single cell, and each row represents one gene. The published data are from (GEO: GSE101099; Byrnes et al, 2018).
- I
Smart‐seq2 data identified four pancreatic cell groups in E14.5 pancreas.
- J
Heat map showing the expression of the group‐enriched genes identified from Smart‐seq2 data. Each column represents a single cell, and each row represents one gene. Gene counts are on the left.
- K
Venn diagrams showing the overlapped gene counts of differentially expressed genes in (H) and (J).
- L
t‐SNE analysis of the 10X Genomics data identified subpopulations in the EP‐early and EP‐late/endocrine populations in (F). The published data are from (GEO: GSE101099; Byrnes et al, 2018).
- M
Heat map showing the expression of the EP subgroup‐enriched genes from the 10X Genomics data. TFs are listed on the right. Gene counts are on the left.
- A, B
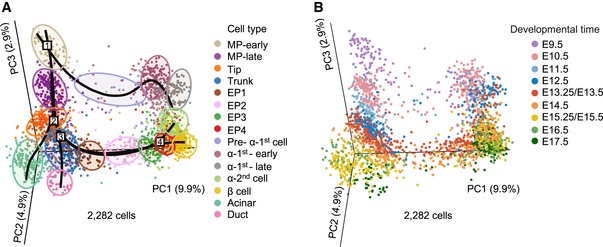
3D PCA plots of pancreatic cells. Each dot represents a single cell. The colors denote cell types (A) and developmental time (B). The simultaneous principal curves in (A) indicate the pathways of pancreatic lineage development. The numbers on the curves in (A) indicate a series of branching nodes during pancreas development. The shadows in (A) represent each cell population.
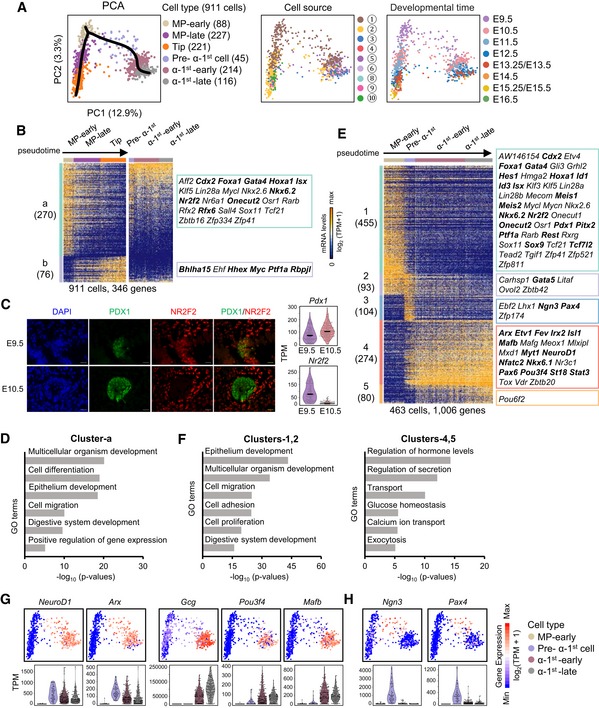
- A
PCA plots of MP‐early, MP‐late, tip, and various stages of α‐1st cells. The colors denote cell types (left) and cell source (middle), the circled number indicating the cell source labeled in Fig 1A, and the developmental time (right). The simultaneous principal curves indicate the developmental pathways of MP‐early cells (left).
- B
Hierarchical clustering of pseudotemporally ordered cells plotted in PCA (A). High‐loading genes in the PCA of MP‐early, MP‐late, and tip cells were employed for hierarchical clustering (PC1, P < 10−20). TFs are listed on the right. The bolded TFs are known to be important for pancreas development. Gene counts are labeled in brackets.
- C
Immunofluorescence staining of PDX1 and NR2F2 in paraffin sections of E9.5 and E10.5 pancreatic tissues. Scale bars: 20 μm. The expression levels (TPM) of Pdx1 and Nr2f2 are shown on the right. The line within each violin plot indicates the median of expression levels.
- D
Selected GO terms of gene cluster‐a in (B).
- E
Hierarchical clustering of pseudotemporally ordered MP‐early and various stages of α‐1st cells plotted in PCA (A). High‐loading genes of the corresponding PCA were used for hierarchical clustering (PC1 and PC2, P < 10−12). TFs are listed on the right. The bolded TFs are known to be important for pancreas development. Gene counts are labeled in brackets.
- F
Selected GO terms of gene clusters‐1, 2 and clusters‐4, 5 in (E).
- G, H
Expression levels of marker genes are projected onto the PCA plot in (A) (upper). The violin plot shows the expression level (TPM) of the indicated gene in each cell type (down).
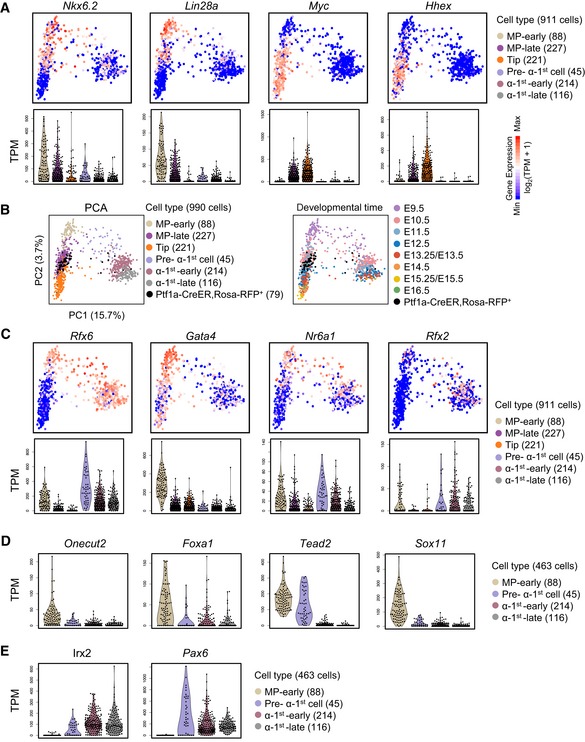
- A
Expression levels (TPM) of selected genes listed in Fig 3B are projected onto the PCA plot (upper) shown in Fig 3A or presented as violin plots of each cell population (down).
- B
E11.5 Ptf1a‐CreER; Rosa‐RFP+ cells were intermingled with E11.5 Pdx1‐Cre; Rosa‐RFP+ or Pdx1‐GFP+ cells.
- C
Expression levels (TPM) of selected genes listed in Fig 3B are projected onto the PCA plot (upper) shown in Fig 3A or presented as violin plots of each cell population (down).
- D, E
Violin plots showing the expression levels (TPM) of selected genes in clusters‐1, 2 (D) and clusters‐4, 5 (E) described in Fig 3E in MP‐early and various stages of α‐1st cells.
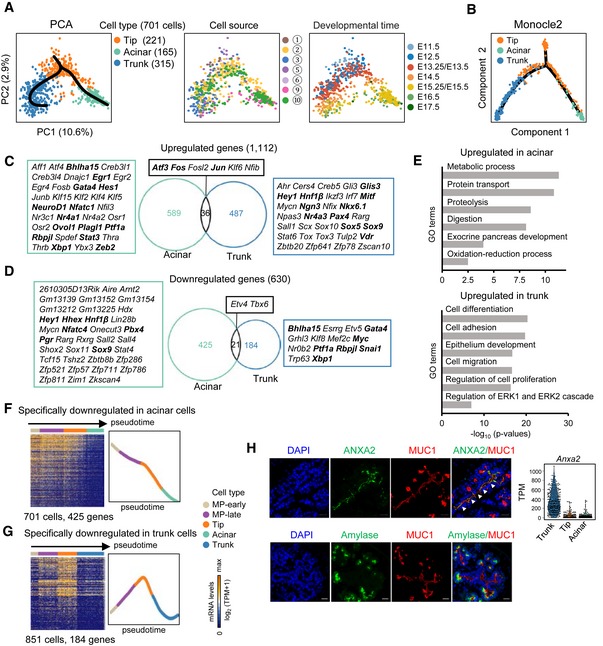
- A
PCA plots of tip, acinar, and trunk cells. The colors denote the cell types (left) and cell source (middle), the circled number indicating the cell source labeled in Fig 1A, and the developmental time (right). The simultaneous principal curves indicate the developmental pathways of tip cell differentiation (left).
- B
Developmental trajectory of tip, acinar, and trunk cells produced by Monocle2 analysis. The colors denote cell types.
- C, D
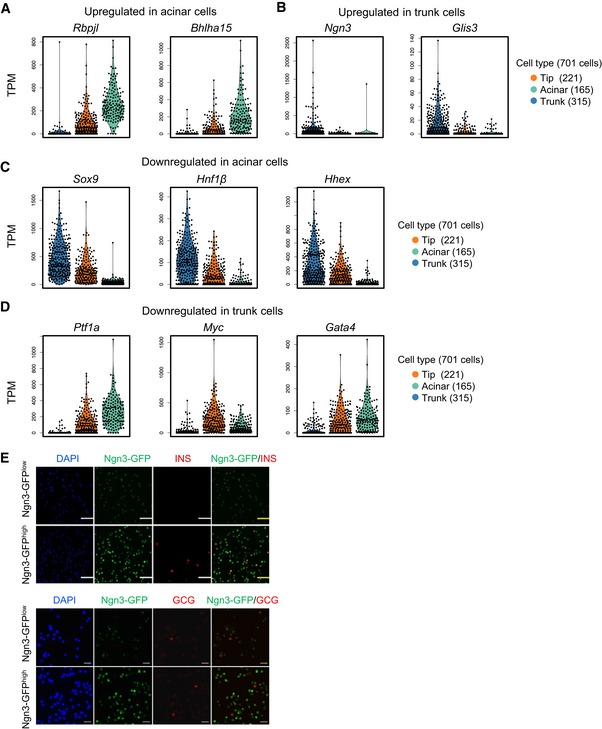
Upregulated (C) and downregulated (D) genes in acinar and trunk cells compared with tip cells. The numbers indicate gene counts. TFs are listed next to the Venn diagrams. The bolded TFs are known to be important for pancreas development.
- E
Selected GO terms of upregulated genes in acinar or trunk cells.
- F, G
Heat maps showing the expression of acinar‐ (F) or trunk‐ (G) specifically downregulated genes in pseudotemporally ordered cells. The mean relative expression levels of the genes are shown on the right.
- H
Immunofluorescence staining of MUC1 and ANXA2 or amylase in paraffin sections of E14.5 pancreatic tissues. Scale bars: 20 μm. The gene expression level (TPM) of Anxa2 is shown on the right. The arrowheads indicate the trunk domain.
- A, B
Violin plots showing the expression levels (TPM) of selected upregulated genes in acinar (A) and trunk (B) cells.
- C, D
Violin plots showing the expression levels (TPM) of selected downregulated genes in acinar (C) and trunk (D) cells.
- E
Immunofluorescence staining of insulin and glucagon in sorted Ngn3‐GFPlow and Ngn3‐GFPhigh cells at E14.5. Scale bars: 50 μm (upper), 20 μm (down).
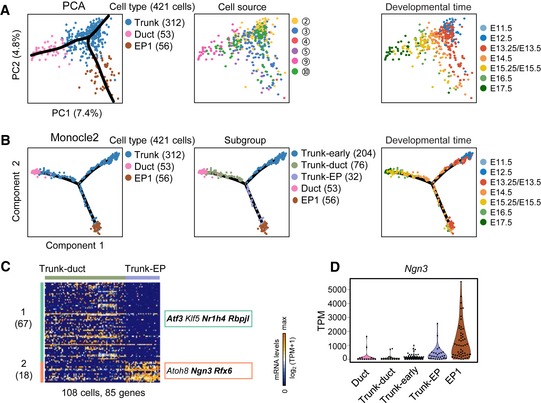
PCA plots of trunk, ductal, and EP1 cells. The colors denote cell types (left) and the cell source (middle), the circled number indicating the cell source labeled in Fig 1A, and the developmental time (right). The simultaneous principal curves indicate the developmental pathways of trunk cell differentiation (left). Cell counts are labeled in brackets.
Developmental trajectory of trunk, ductal, and EP1 cells produced by Monocle2 analysis. The colors denote cell types (left), subgroups (middle), and developmental time (right).
Differential expression analysis between trunk‐duct and trunk‐EP cells. TFs are listed on the right. The bolded TFs are known to be important for pancreas development. Gene counts are shown in brackets.
The violin plot shows the Ngn3 expression level (TPM) in each of the subgroups in (B, middle).
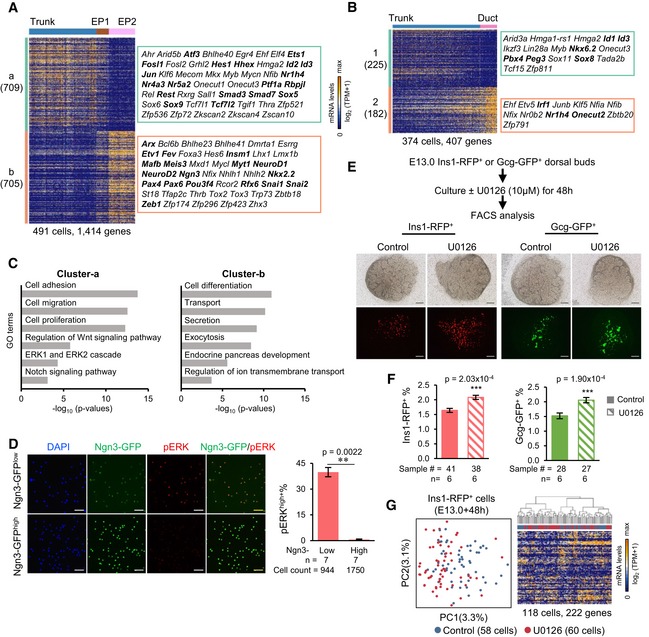
- A, B
Differential expression analysis between trunk and EP (1 and 2) cells (A) or between trunk and ductal cells (B). TFs are listed on the right. The bolded TFs are known to be important for pancreas development. Gene counts are labeled in brackets.
- C
Selected GO terms of gene cluster‐a and cluster‐b in (A).
- D
Immunofluorescence staining of pERK and DAPI in sorted Ngn3‐GFPlow and Ngn3‐GFPhigh cells at E14.5. Scale bars: 50 μm. Statistical analysis of the percentage of pERK+ cells within Ngn3‐GFPlow and Ngn3‐GFPhigh cells (right). The data are presented as the mean ± SEM. n: number of biological replicates. **P‐value < 0.01, two‐sided t‐test.
- E
Schematic workflow of E13.0 dorsal pancreatic explant cultures (upper). Pancreata from Ins1‐RFP or Gcg‐GFP mice were or were not treated with U0126 for 48 h. Images of explants after treatment (down). Scale bars: 200 μm.
- F
Statistical analysis of the percentage of Ins1‐RFP+ or Gcg‐GFP+ cells after treatment. The data are presented as the mean ± SEM. n: number of independent biological replicates. Sample #: total number of samples (pancreatic dorsal buds) in all biological replicates. ***P‐value < 0.001, two‐sided t‐test.
- G
PCA (left) of E13.0 Ins1‐RFP+ cells after 48 h of treatment and the corresponding hierarchical clustering (right). High‐loading genes in PCA were used for hierarchical clustering (PC1 and PC2, P < 5 × 10⁻²).
- A
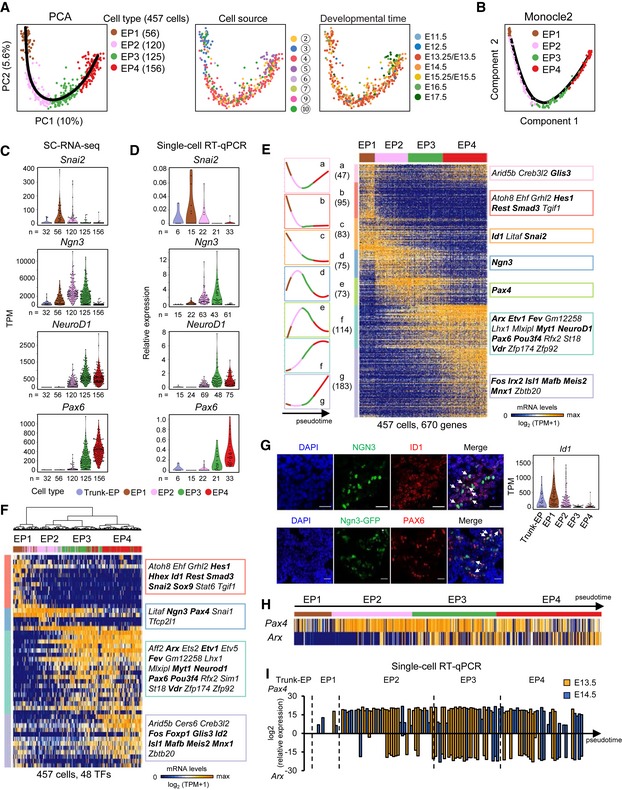
PCA plots of EP cells. The colors denote cell types (left) and the cell source (middle), the circled number indicating the cell source labeled in Fig 1A, and the developmental time (right). The simultaneous principal curve indicates the developmental pathway of EP cells.
- B
Developmental trajectory of EP cells produced by Monocle2 analysis.
- C, D
The violin plots show the gene expression levels (TPM) in trunk‐EP and four stages of EP cells (C). The expression levels were verified via single‐cell RT–qPCR with normalization to Gapdh expression (D). n: cell counts.
- E
Hierarchical clustering of the pseudotemporally ordered cells plotted in the PCA (A) (PC1 and PC2, P < 10−15). The mean relative expression level and TF list of each gene cluster are shown on the left and right of the heat map, respectively. The bolded TFs are known to be important for pancreas development. Gene counts are shown in brackets.
- F
Hierarchical clustering of EP cells with TFs. The TFs listed on the right were high‐loading genes (PC1 and PC2, P < 10−13) in the PCA (see Materials and Methods).
- G
Immunofluorescence staining of ID1, Ngn3, and DAPI in paraffin sections of E14.5 WT pancreas (upper) or of PAX6 and DAPI in cryosections of E14.5 Ngn3‐GFP pancreas. Scale bars: 20 μm. The arrows indicate the Ngn3+ID1+ or Ngn3+PAX6+ cells. The violin plots show the Id1 expression levels (TPM) in trunk‐EP and four stages of EP cells. The expression pattern of Pax6 is shown in (C).
- H
Arx and Pax4 expression patterns in EP cells. Individual cells are arranged in the same order as in (E).
- I
Single‐cell RT–qPCR verified the expression levels of Pax4 and Arx in trunk‐EP cells and in four stages of EP cells at E13.5 (yellow) and E14.5 (blue) with normalization to Gapdh expression. Individual cells are arranged by pseudotime. The dashed lines indicate the boundaries of stages.

- A
PCA plots of EP4, α‐2nd, and β cells. The colors denote cell types (left) and the cell source (middle), the circled number indicating the cell source labeled in Fig 1A, and the developmental time (right). The simultaneous principal curves indicate the developmental pathways of EP4, α‐2nd, and β cells. * and ** indicate the E17.5 Ins1‐RFP+ and Gcg‐Cre;Rosa‐RFP+ cells, respectively, from our previously published work (Qiu et al, 2017a).
- B
Developmental trajectory of EP4 cell differentiation produced by Monocle2 analysis.
- C, D
Upregulated (C) and downregulated (D) genes in β cells and α‐2nd cells compared with EP4 cells. The numbers indicate the gene counts. TFs are listed next to the Venn diagrams. The bolded TFs are known to be important for pancreas development.
- E
3D PCA plot of EP4, β, and α cells. The simultaneous principal curves indicate the developmental pathways of these cells. Data on E17.5‐P60 quiescent β and α cells from our published study (Qiu et al, 2017a) were integrated into this PCA.
- F
The heat map shows the transcriptomic differences between α‐1st and α‐2nd cells. TFs are listed on the right. The bolded TFs are known to be important for pancreas development. Gene counts are labeled in brackets.
- G
Summary of pancreatic lineage developmental pathways.
Comment in
-
Pancreatic development: one cell at a (pseudo)time.EMBO J. 2019 Apr 15;38(8):e101891. doi: 10.15252/embj.2019101891. Epub 2019 Mar 26. EMBO J. 2019. PMID: 30914428 Free PMC article.
References
-
- Adler D, Murdoch D, Nenadic O, Urbanek S, Chen M, Gebhardt A, Bolker B, Csardi G, Strzelecki A, Senger A (2016) rgl: 3D visualization using OpenGL. R package version 096. https://CRAN.R-project.org/package=rgl
-
- Apelqvist A, Li H, Sommer L, Beatus P, Anderson DJ, Honjo T, Hrabe de Angelis M, Lendahl U, Edlund H (1999) Notch signalling controls pancreatic cell differentiation. Nature 400: 877–881 - PubMed
-
- Azzarelli R, Hurley C, Sznurkowska MK, Rulands S, Hardwick L, Gamper I, Ali F, McCracken L, Hindley C, McDuff F, Nestorowa S, Kemp R, Jones K, Gottgens B, Huch M, Evan G, Simons BD, Winton D, Philpott A (2017) Multi‐site Neurogenin3 phosphorylation controls pancreatic endocrine differentiation. Dev Cell 41: 274–286.e5 - PMC - PubMed
-
- Bastidas‐Ponce A, Scheibner K, Lickert H, Bakhti M (2017) Cellular and molecular mechanisms coordinating pancreas development. Development 144: 2873–2888 - PubMed
Publication types
MeSH terms
LinkOut - more resources
Full Text Sources
Molecular Biology Databases
Research Materials
Miscellaneous
