. 2019 Apr 10;39(15):2810-2822.
doi: 10.1523/JNEUROSCI.2730-18.2019. Epub 2019 Feb 8.

Cell Kinetics in the Adult Neurogenic Niche and Impact of Diet-Induced Accelerated Aging

Affiliations

Cell Kinetics in the Adult Neurogenic Niche and Impact of Diet-Induced Accelerated Aging

Alexander J Stankiewicz et al. J Neurosci. .

Abstract

Neurogenesis in the adult brain, a powerful mechanism for neuronal plasticity and brain repair, is altered by aging and pathological conditions, including metabolic disorders. The search for mechanisms and therapeutic solutions to alter neurogenesis requires understanding of cell kinetics within neurogenic niches using a high-throughput quantitative approach. The challenge is in the dynamic nature of the process and multiple cell types involved, each having several potential modes of division or cell fate. Here we show that cell kinetics can be revealed through a combination of the BrdU/EdU pulse-chase, based on the circadian pattern of DNA replication, and a differential equations model that describes time-dependent cell densities. The model is validated through the analysis of cell kinetics in the cerebellar neurogenic niche of normal young adult male zebrafish, with cells quantified in 2D (sections), and with neuronal fate and reactivation of stem cells confirmed in 3D whole-brain images (CLARITY). We then reveal complex alterations in cell kinetics associated with accelerated aging due to chronic high caloric intake. Low activity of neuronal stem cells in this condition persists 2 months after reverting to normal diet, and is accompanied by overproduction of transient amplifying cells, their accelerated cell death, and slow migration of postmitotic progeny. This combined experimental and mathematical approach should allow for relatively high-throughput analysis of early signs of pathological and age-related changes in neurogenesis, evaluation of specific therapeutic targets, and drug efficacy.SIGNIFICANCE STATEMENT Understanding normal cell kinetics of adult neurogenesis and the type of cells affected by a pathological process is needed to develop effective prophylactic and therapeutic measures directed at specific cell targets. Complex time-dependent mechanisms involved in the kinetics of multiple cell types require a combination of experimental and mathematical modeling approaches. This study demonstrates such a combined approach by comparing normal neurogenesis with that altered by diet-induced accelerated aging in adult zebrafish.

Keywords: adult neurogenesis; aging; cell kinetics; mathematical modeling; neurogenesis; zebrafish.


Figures

Figure 1.
Figure 1.
Different modes of cell division or conversion for NSCs and transient NPCs can lead to expansion, homeostasis, or depletion of their pool. A, Modes of division/conversion for NSCs (circle). B, Modes of division/conversion for transient NPCs (square). Postmitotic daughter cells (PMCs, triangle). For NSCs and NPCs, q and p are the probabilities of the mode of division, respectively.
Figure 2.
Figure 2.
The pulse-chase BrdU-EdU protocol reveals proliferating cells and newly developing neurons in young adult zebrafish brain. A, Experimental protocol involving BrdU pulse and EdU chase 1–5 d thereafter. Arrows indicate BrdU administration (red), BrdU washout (blue), EdU injection (green), and sample collection (black). BrdU and EdU exposure at ZT9–11, with ZT0 = lights-on time; 14:10 light-dark cycle. White area represents light. Gray area represents dark. N = 5 or 6 fish per time point. B, Cleared zebrafish brain following a 15 d pulse-chase. Scale bar, 150 μm. C, Labeled cells within cerebellar neurogenic niche, following 15 d chase. Arrows indicate BrdU/EdU colocalization (yellow), EdU-only (green), BrdU-only (red), and BrdU/HuC/D colocalization (magenta). Scale bar, 10 μm. D, Single-channel images for the colabeled yellow stem cell in C, BrdU (red) and EdU (green) representing NSCs. E, Single-channel images for cells colabeled for BrdU (red) and HuC/D (blue), representing immature neurons. Scale bar, 10 μm.
Figure 3.
Figure 3.
Daily proliferative activity in the brain of normal 1-year-old zebrafish. Cell proliferation in the cerebellum over a 1 to 3 d BrdU/EdU pulse-chase. A, Schematics of representative cell division modes and cell color on the day of BrdU pulse (day 0) and EdU chase (day 1). RV, Rhombencephalic ventricle. B, Representative image of labeled cells in the cerebellar niche and outside parenchyma on day 3 of BrdU/EdU pulse-chase, and corresponding schematics. Arrows indicate posterior mesencephalic layer (PML). Scale bar, 50 μm. C, Number of labeled cells in the cerebellar neurogenic niche. D, Number of labeled cells in the whole cerebellum. E, Percentage of labeled cells in the neurogenic niche versus whole cerebellum. Cell counts conducted in brain sections. Red represents BrdU-only. Green represents EdU-only. Yellow represents BrdU/EdU colocalized. N = 5 or 6 fish per time point. Data are mean ± SEM. *p < 0.05, relative to day 1.
Figure 4.
Figure 4.
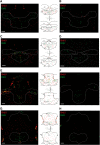
Chronic HCI alters proliferative capacity of zebrafish brain. Representative cerebellar images and corresponding schematics in 1-year-old Control (left column, top) and HCI (right column, bottom) zebrafish on day 3 of BrdU-EdU pulse-chase. A, B, Rostral valvula cerebelli (corresponding to Wulliman et al., 1996, atlas section 179). C, D, Valvula cerebelli (corresponding to Wulliman et al., 1996, atlas section 196). E, F, Caudal valvula cerebelli and rostral corpus cerebelli (corresponding to Wulliman et al., 1996, atlas sections 201–204). G, H, End of valvula cerebelli and mid corpus cerebelli (corresponding to Wulliman et al., 1996, atlas sections 213–219). TeO, Optic tectum; Ctec, commissura tecti; TeV, tectal ventricle; PML, posterior mesencephalic layer; RV, rhombencephalic ventricle; TL, torus longitudinalis. Dashed line indicates neurogenic cerebellar niche regions. Red represents BrdU-only. Green represents EdU-only. Yellow represents BrdU/EdU colocalized. Scale bar, 50 μm.
Figure 5.
Figure 5.
Daily proliferative activity in the brain of 1-year-old zebrafish with chronic HCI. Quantitative evaluation of cell proliferation in the cerebellum over a 1–5 d of BrdU-EdU pulse-chase. A, B, Number of cells in S-phase on consecutive days, at daily peak time (following 2 h EdU exposure at ZT 9–11) in Control (A) and HCI (B) fish. C, Body weight (grams) in Control (white) and HCI (black) fish. D, Brain volume (mm3) in Control (white) and HCI (black) fish. E, Number of labeled cells in the cerebellar neurogenic niche. F, Number of labeled cells in the whole cerebellum. G, Percentage of labeled cells in the neurogenic niche versus whole cerebellum. Cell counts conducted in brain sections. Red represents BrdU-only. Green represents EdU-only. Yellow represents BrdU/EdU colocalized. N = 5 or 6 fish per time point. Data are mean ± SEM. *p < 0.05, relative to day 1.
Figure 6.
Figure 6.
The kinetics of cell proliferation in adult cerebellum under normal and accelerated aging conditions. Comparison between the model predictions and the experimental data in Control zebrafish (A–C) and HCI animals with accelerated aging (D–F). A, D, Colocalized BrdU/EdU cells: NPCs. B, E, BrdU-only cells: stem cells active during initial pulse (day 0) and PMCs that are progeny of cells replicating on day 0. C, F, EdU-only cells that are in S-phase on the day of chase and sample collection (days 1–5). y axis indicates percentage cells with specific label in the whole cerebellum.

References

    1. Adolf B, Chapouton P, Lam CS, Topp S, Tannhäuser B, Strähle U, Götz M, Bally-Cuif L (2006) Conserved and acquired features of adult neurogenesis in the zebrafish telencephalon. Dev Biol 295:278–293. 10.1016/j.ydbio.2006.03.023 - DOI - PubMed
    1. Aggarwal V, Dickinson RB, Lele TP (2016) Concentration sensing by the moving nucleus in cell fate determination: a computational analysis. PLoS One 11:e0149213. 10.1371/journal.pone.0149213 - DOI - PMC - PubMed
    1. Akle V, Stankiewicz AJ, Kharchenko V, Yu L, Kharchenko PV, Zhdanova IV (2017) Circadian kinetics of cell cycle progression in adult neurogenic niches of a diurnal vertebrate. J Neurosci 37:1900–1909. 10.1523/JNEUROSCI.3222-16.2017 - DOI - PMC - PubMed
    1. Arslan-Ergul A, Ozdemir AT, Adams MM (2013) Aging, neurogenesis, and caloric restriction in different model organisms. Aging Dis 4:221–232. - PMC - PubMed
    1. Arslan-Ergul A, Erbaba B, Karoglu ET, Halim DO, Adams MM (2016) Short-term dietary restriction in old zebrafish changes cell senescence mechanisms. Neuroscience 334:64–75. 10.1016/j.neuroscience.2016.07.033 - DOI - PubMed

Publication types

LinkOut - more resources