. 2019 Apr 3;39(14):2686-2697.
doi: 10.1523/JNEUROSCI.2298-18.2019. Epub 2019 Feb 8.

Regional Delta Waves In Human Rapid Eye Movement Sleep

Affiliations

Regional Delta Waves In Human Rapid Eye Movement Sleep

Giulio Bernardi et al. J Neurosci. .

Abstract

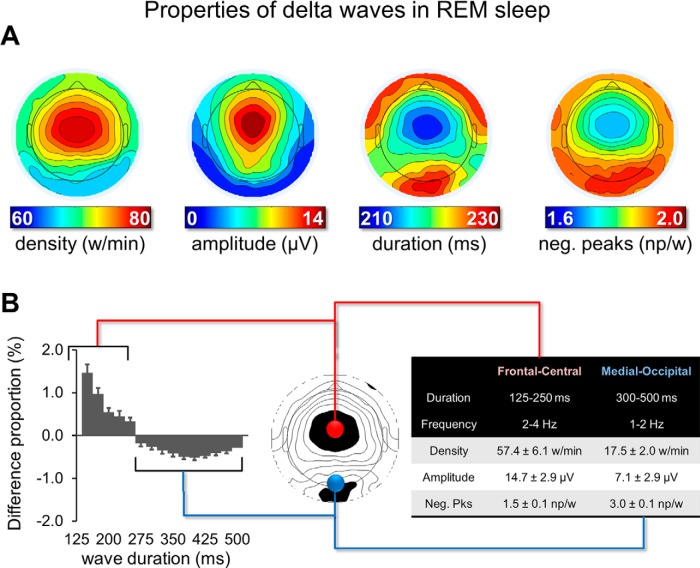
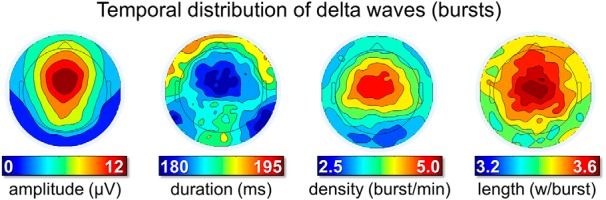
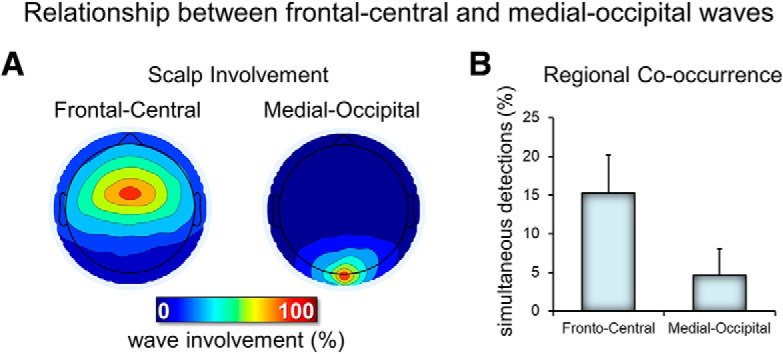
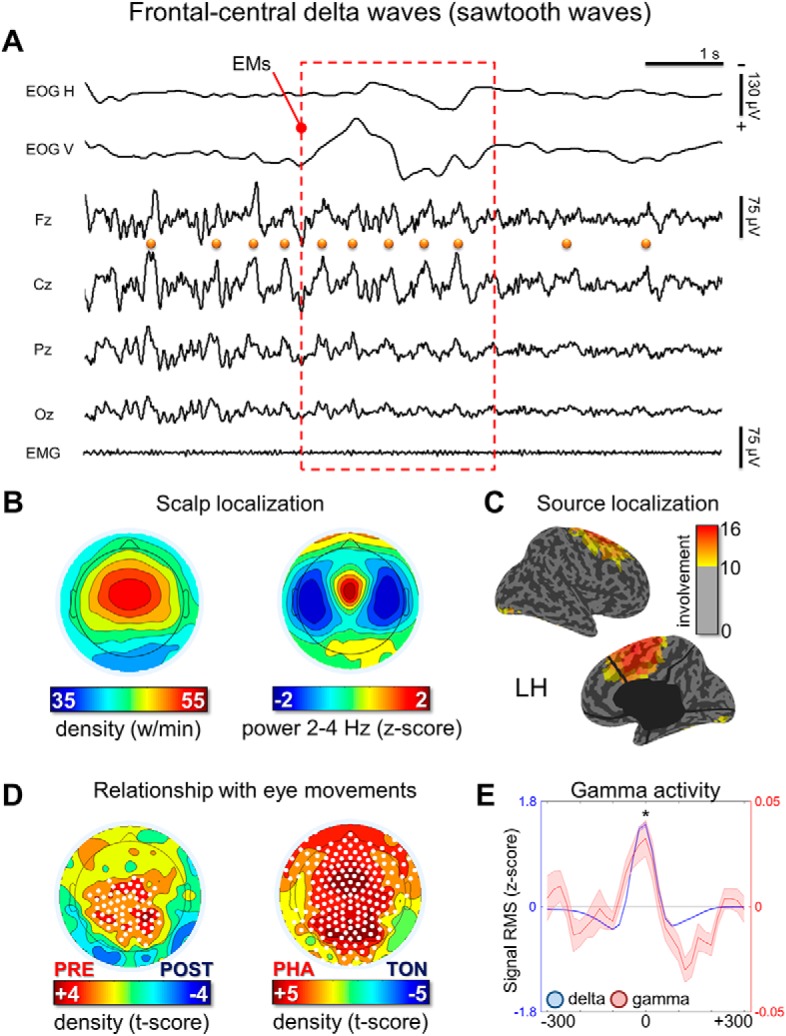
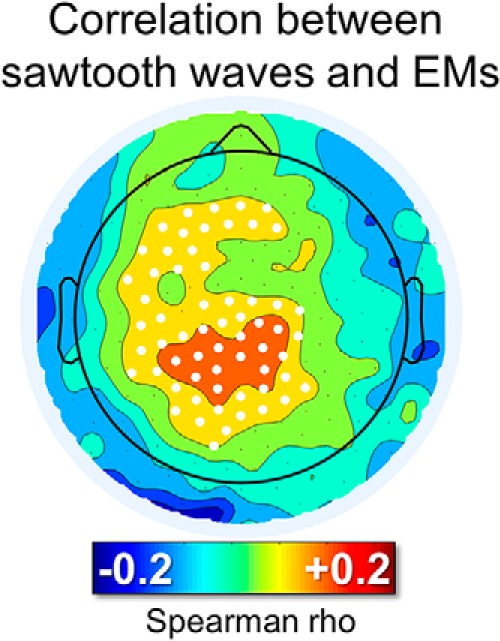
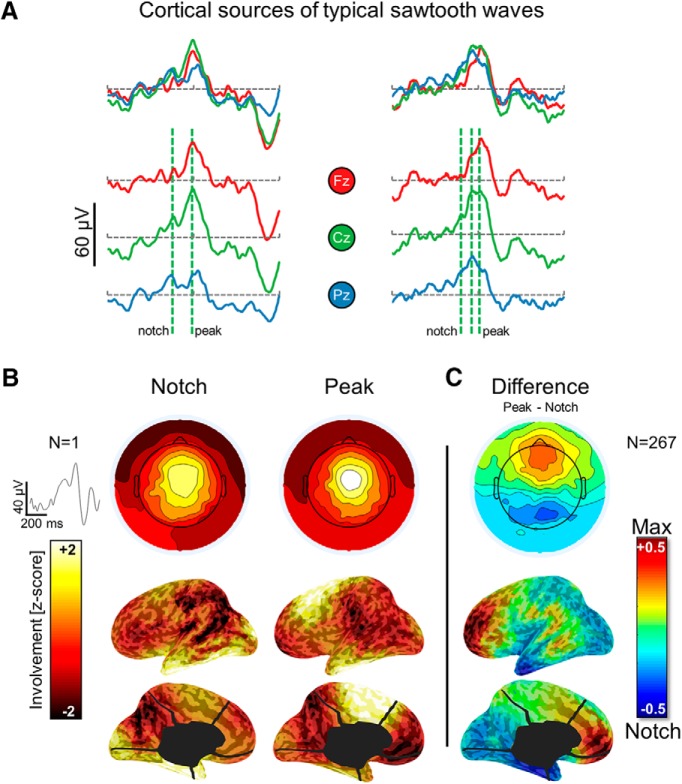
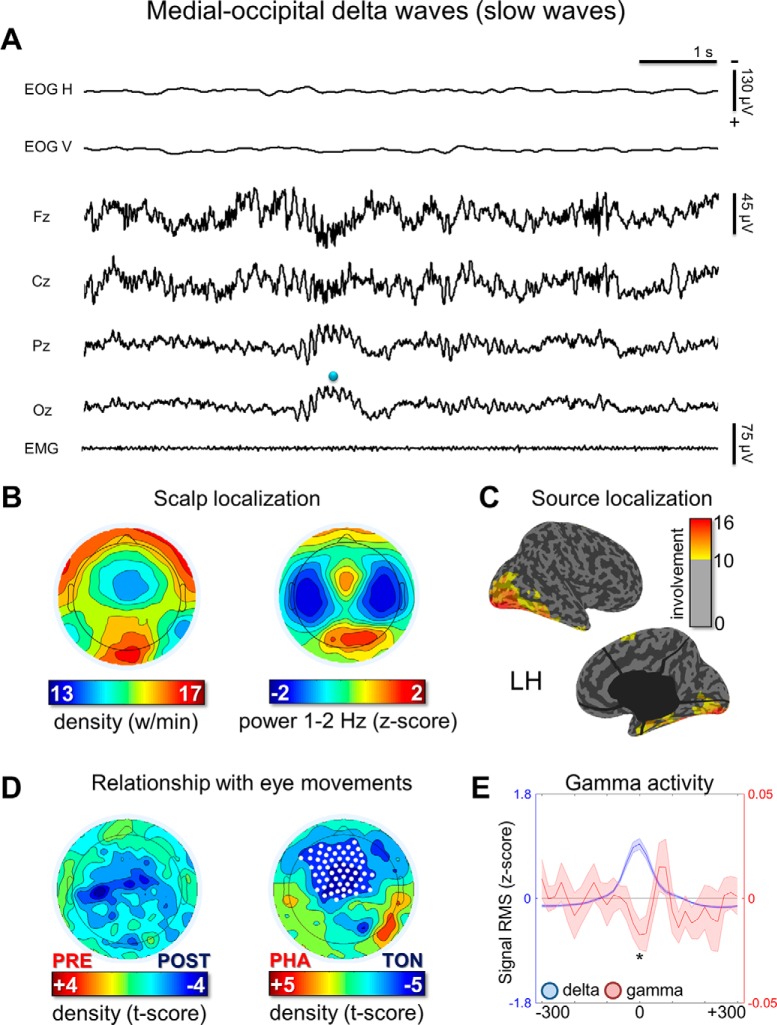
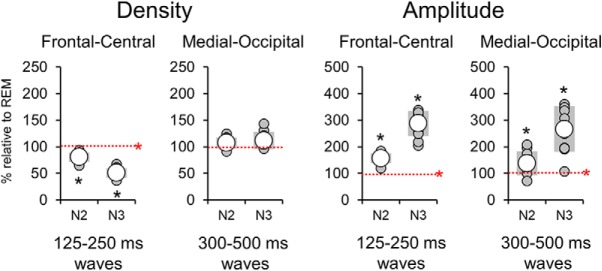
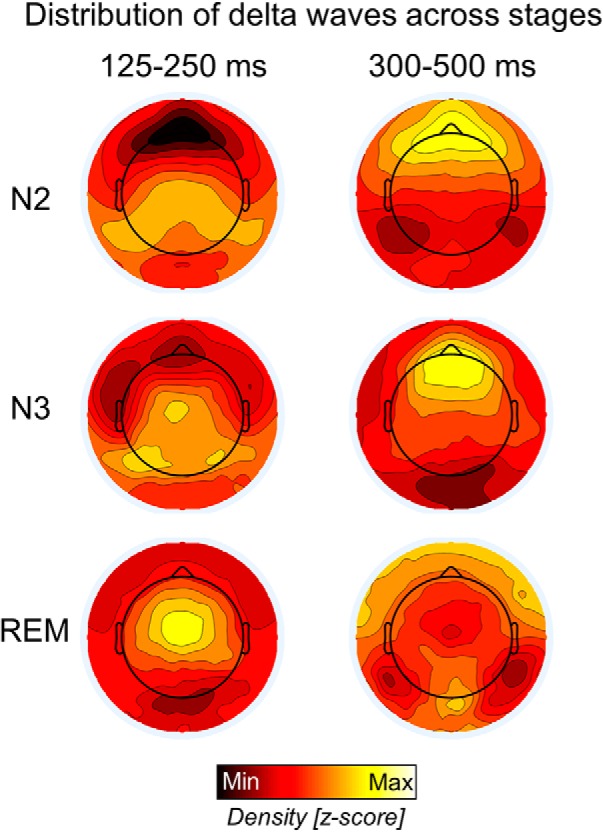
Although the EEG slow wave of sleep is typically considered to be a hallmark of nonrapid eye movement (NREM) sleep, recent work in mice has shown that slow waves can also occur in REM sleep. Here, we investigated the presence and cortical distribution of negative delta (1-4 Hz) waves in human REM sleep by analyzing high-density EEG sleep recordings obtained in 28 healthy subjects. We identified two clusters of delta waves with distinctive properties: (1) a frontal-central cluster characterized by ∼2.5-3.0 Hz, relatively large, notched delta waves (so-called "sawtooth waves") that tended to occur in bursts, were associated with increased gamma activity and rapid eye movements (EMs), and upon source modeling displayed an occipital-temporal and a frontal-central component and (2) a medial-occipital cluster characterized by more isolated, slower (<2 Hz), and smaller waves that were not associated with rapid EMs, displayed a negative correlation with gamma activity, and were also found in NREM sleep. Therefore, delta waves are an integral part of REM sleep in humans and the two identified subtypes (sawtooth and medial-occipital slow waves) may reflect distinct generation mechanisms and functional roles. Sawtooth waves, which are exclusive to REM sleep, share many characteristics with ponto-geniculo-occipital waves described in animals and may represent the human equivalent or a closely related event, whereas medial-occipital slow waves appear similar to NREM sleep slow waves.SIGNIFICANCE STATEMENT The EEG slow wave is typically considered a hallmark of nonrapid eye movement (NREM) sleep, but recent work in mice has shown that it can also occur in REM sleep. By analyzing high-density EEG recordings collected in healthy adult individuals, we show that REM sleep is characterized by prominent delta waves also in humans. In particular, we identified two distinctive clusters of delta waves with different properties: a frontal-central cluster characterized by faster, activating "sawtooth waves" that share many characteristics with ponto-geniculo-occipital waves described in animals and a medial-occipital cluster containing slow waves that are more similar to NREM sleep slow waves. These findings indicate that REM sleep is a spatially and temporally heterogeneous state and may contribute to explaining its known functional and phenomenological properties.

Keywords: PGO wave; REM sleep; hd-EEG; sawtooth wave; slow wave.


Figures

Figure 1.
Figure 1.
Properties of delta waves in REM sleep. An automatic detection algorithm was applied to the EEG signal of each electrode to identify negative half-waves with a duration of 125–500 ms (≤4 Hz). Different wave properties were extracted and analyzed (A), including density (number of waves per minute; w/min), negative amplitude (μV), duration (ms), and number of negative peaks (np/w). A similar distribution was obtained for negative peaks when values were expressed per second instead of per wave, although the highest values were found in more lateral posterior rather than medial posterior regions. B, Left, For a frontal-central and a medial-occipital electrode, the difference (%) in the relative proportion of waves for durations between 125 and 500 ms (25 ms bins). The relative difference between the two electrodes in percentage was calculated for each duration bin. Vertical bars indicate 1 SD from the group mean (SD). The table on the right side displays mean values and SD for density, amplitude and negative peaks (neg. pks) for the faster frontal-central and the slower medial-occipital delta waves.
Figure 2.
Figure 2.
Temporal distribution of delta waves (occurrence in bursts). Bursts were defined as series of at least 3 consecutive waves (1–5 Hz) with maximum negative peaks separated by <750 ms. From left to right, the plots display the density of delta wave bursts (number of bursts per minute), the mean amplitude (μV), and duration (ms) of waves included in a burst and the number of waves included in the burst (expressed as waves per burst).
Figure 3.
Figure 3.
Relationship between frontal-central and medial occipital delta waves. A, Typical scalp involvement for the two types of delta waves. For each delta wave detected in the two electrodes of interest (frontal-central and medial-occipital), the number of concurrent detections (in a window of 200 ms, centered on the wave negative peak) in other electrodes was computed. Therefore, each map shows the number of cases in which each electrode showed a co-occurring delta wave (the electrode of interest has 100% value in each map). B, Relative occurrence of simultaneous detections (of the same type/duration) across the two electrodes of interest.
Figure 4.
Figure 4.
Frontal-central delta waves. A, Representative REM sleep EEG traces (negative-up on the y-scale) containing frontal-central delta waves with a duration of 125–250 ms (half-wave). The orange dots indicate waves identified by the automatic detection algorithm in the Cz electrode and the red box marks the occurrence of EMs. Most waves corresponded to typical notched sawtooth waves of REM sleep. B, Density- and power-based maps indicating their topographic distribution. Power spectral density (PSD) was calculated in 6 s epochs and across all REM cycles using the Welch's method (8 sections, 50% overlap) and integrated in the frequency range of interest. C, Typical peak of activity of frontal-central waves in source space (overlap between subjects). D, Comparison between wave density before and after isolated EMs and between phasic and tonic REM periods. E, Relationship between delta and gamma activity (RMS of band-limited signal). RMS traces were aligned using the maximum negative peak of each wave as a reference. Asterisk marks a significant increase of gamma activity at the wave peak with respect to baseline (p < 0.05).
Figure 5.
Figure 5.
Correlation between the number of sawtooth waves preceding rapid EMs and the number of subsequent rapid EMs. For each isolated group of EMs, the burst of the 125–250 ms half-waves (amplitude > 10 μV, interwave distance < 1 s) closest to the beginning of the first EM (maximum distance < 600 ms) was identified. White dots mark significant effects at the group level (p < 0.05, corrected).
Figure 6.
Figure 6.
Cortical sources of typical sawtooth waves. A, EEG traces (three electrodes, corresponding to Fz, Cz, and Pz; negative-up on the y-scale) of two representative notched sawtooth waves (±250 ms around the negative peak of the algorithm detection). B, Scalp and cortical involvement corresponding to the notch and the maximal negative peak of a single sawtooth wave. C, Difference in average involvement between the notch and maximal negative peak (computed across 267 sawtooth waves in one representative subject; similar results were obtained in other participants). For this evaluation, all detections in one subject were visually inspected to identify typical sawtooth waves with a negative amplitude >20 μV and a well recognizable notched, triangular shape. The timing of the notch and the maximal negative peak were marked manually. Differences shown in C are statistically significant over all voxels (p < 0.05, corrected).
Figure 7.
Figure 7.
Medial-occipital delta waves. A, Representative REM sleep EEG traces (negative-up on the y-scale) containing medial-occipital delta waves with a duration of 300–500 ms (half-wave). The blue dot indicates a wave identified by the automatic detection algorithm in the Oz electrode. B, Density- and power-based maps indicating their topographic distribution. Power spectral density (PSD) was calculated in 6 s epochs and across all REM cycles using the Welch's method (8 sections, 50% overlap) and integrated in the frequency-range of interest. C, Typical peak of activity of medial-occipital waves in source space (overlap between subjects). D, Comparison between medial-occipital wave density before and after isolated EMs and between phasic and tonic REM-periods. E, Relationship between delta and gamma activity (RMS of band-limited signal). RMS traces were aligned using the maximum negative peak of each wave as a reference. Asterisk marks a significant decrease of gamma activity at the wave peak with respect to baseline (p < 0.05).
Figure 8.
Figure 8.
Overnight changes in the amplitude of delta waves in REM sleep for the sawtooth frequency range (125–250 ms) and the medial-occipital wave range (300–500 ms). A diffuse decrease in amplitude was observed for both frequency ranges. White dots mark significant effects at the group level (p < 0.05, corrected).
Figure 9.
Figure 9.
Relative variations in the density and amplitude of frontal-central and medial-occipital delta waves in N2 and N3 with respect to REM sleep. The dashed red line corresponds to the level observed in REM sleep (100%). Asterisk denotes significant effects at p < 0.05 (red for Friedman test for stage-effect, black for post hoc Wilcoxon signed rank tests).
Figure 10.
Figure 10.
Relative topographic distribution of EEG waves with durations of 125–250 ms (left) and 300–500 ms (right) in N2, N3, and REM sleep. Density values were z-scored to facilitate comparison across stages. The strong frontal slow-wave activity in NREM sleep likely masks the smaller delta waves in posterior regions.

Comment in

References

    1. Abe T, Ogawa K, Nittono H, Hori T (2008) Neural generators of brain potentials before rapid eye movements during human REM sleep: a study using sLORETA. Clin Neurophysiol 119:2044–2053. 10.1016/j.clinph.2008.05.008 - DOI - PubMed
    1. Andrillon T, Nir Y, Cirelli C, Tononi G, Fried I (2015) Single-neuron activity and eye movements during human REM sleep and awake vision. Nat Commun 6:7884. 10.1038/ncomms8884 - DOI - PMC - PubMed
    1. Aserinsky E, Kleitman N (1953) Regularly occurring periods of eye motility, and concomitant phenomena, during sleep. Science 118:273–274. 10.1126/science.118.3062.273 - DOI - PubMed
    1. Baird B, Castelnovo A, Riedner BA, Lutz A, Ferrarelli F, Boly M, Davidson RJ, Tononi G (2018) Human rapid eye movement sleep shows local increases in low-frequency oscillations and global decreases in high-frequency oscillations compared to resting wakefulness. eNeuro 5:ENEURO.0293–18.2018. 10.1523/ENEURO.0293-18.2018 - DOI - PMC - PubMed
    1. Berger RJ, Olley P, Oswald I (1962) The EEG, eye-movements and dreams of the blind. Q J Exp Psychol 14:183–186. 10.1080/17470216208416534 - DOI

Publication types

LinkOut - more resources