. 2019 Mar 12;92(11):e1225-e1237.
doi: 10.1212/WNL.0000000000007098. Epub 2019 Feb 8.

Biallelic variants in LARS2 and KARS cause deafness and (ovario)leukodystrophy

Affiliations

Biallelic variants in LARS2 and KARS cause deafness and (ovario)leukodystrophy

Marjo S van der Knaap et al. Neurology. .

Erratum in

Abstract

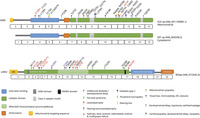
Objective: To describe the leukodystrophy caused by pathogenic variants in LARS2 and KARS, encoding mitochondrial leucyl transfer RNA (tRNA) synthase and mitochondrial and cytoplasmic lysyl tRNA synthase, respectively.

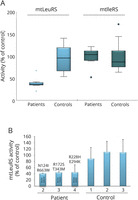
Methods: We composed a group of 5 patients with leukodystrophy, in whom whole-genome or whole-exome sequencing revealed pathogenic variants in LARS2 or KARS. Clinical information, brain MRIs, and postmortem brain autopsy data were collected. We assessed aminoacylation activities of purified mutant recombinant mitochondrial leucyl tRNA synthase and performed aminoacylation assays on patients' lymphoblasts and fibroblasts.

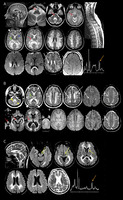
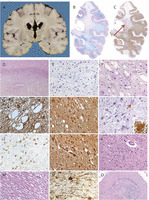
Results: Patients had a combination of early-onset deafness and later-onset neurologic deterioration caused by progressive brain white matter abnormalities on MRI. Female patients with LARS2 pathogenic variants had premature ovarian failure. In 2 patients, MRI showed additional signs of early-onset vascular abnormalities. In 2 other patients with LARS2 and KARS pathogenic variants, magnetic resonance spectroscopy revealed elevated white matter lactate, suggesting mitochondrial disease. Pathology in one patient with LARS2 pathogenic variants displayed evidence of primary disease of oligodendrocytes and astrocytes with lack of myelin and deficient astrogliosis. Aminoacylation activities of purified recombinant mutant leucyl tRNA synthase showed a 3-fold loss of catalytic efficiency. Aminoacylation assays on patients' lymphoblasts and fibroblasts showed about 50% reduction of enzyme activity.

Conclusion: This study adds LARS2 and KARS pathogenic variants as gene defects that may underlie deafness, ovarian failure, and leukodystrophy with mitochondrial signature. We discuss the specific MRI characteristics shared by leukodystrophies caused by mitochondrial tRNA synthase defects. We propose to add aminoacylation assays as biochemical diagnostic tools for leukodystrophies.


Figures

Figure 1
Figure 1. MRI of patients with LARS2 and KARS pathogenic variants
(A) MRI in patient 1 at age 33 years shows extensive cerebral white matter abnormalities with partial sparing of directly subcortical white matter, especially in the frontal region (white arrowheads). Areas of abnormal signal are present in the thalamus (green arrowhead) and to a lesser degree the basal nuclei (blue arrowhead). Pyramidal tracts in the posterior limb of the internal capsule, midbrain, pons, and medulla are affected, right (red arrows) more than left. Spinal cord is normal; cerebellum is slightly atrophic. Diffusion restriction is observed in the pyramidal tract, right (white arrow) more than left, and splenium of the corpus callosum. Some contrast enhancement is present in the right pyramidal tract in the centrum semiovale (white open arrow). MRS reveals highly elevated lactate (doublet at 1.33 ppm, orange arrow) in the abnormal white matter. (B) MRIs in patient 2 at 36 (upper row) and 37 (lower row) years of age. The earlier MRI shows extensive cerebral white matter abnormalities, sparing frontal and directly subcortical white matter (white arrowheads). Thalamus (green arrowhead), hilum of the dentate nucleus, and peridentate white matter (yellow arrowheads) are affected. Small cystic lesions with elongated shape are present, suggesting enlarged perivascular spaces (white arrows). A few foci of diffusion restriction are seen in the centrum semiovale (white open arrows). The later MRI reveals small cystic spaces in the same areas (white open arrows), compatible with lacunar infarctions. The white matter abnormalities have progressed and involve the frontal white matter and entire pyramidal tracts (red arrows). Numerous microbleeds are seen as black dots in the area of the dentate nucleus, thalamus, basal nuclei, and cerebral white matter. (C) MRI of patient 5 at 36 years. Sagittal T2-weighted image shows involvement of the genu and splenium of the corpus callosum (white arrows) and cerebellar atrophy. The axial images show abnormal signal in the frontal and parieto-occipito-temporal white matter, sparing the segment in between. The anterior limb of the internal capsule (yellow arrow), fronto-pontine tracts (yellow arrows) and parieto-occipito-temporo-pontine tracts (green arrows) are affected. Areas of diffusion restriction are present within the abnormal white matter. MRS reveals highly elevated lactate (doublet at 1.33 ppm, orange arrow) in the abnormal white matter. N-acetyl aspartate (2.02 ppm) is close to zero. MRS = magnetic resonance spectroscopy.
Figure 2
Figure 2. Neuropathology of LARS2 leukodystrophy
(A) Whole coronal brain slice shows mild dilatation of the lateral ventricles, indicating mild white matter atrophy, and discoloration of the hemispheric white matter with better preservation of the U-fibers. (B and C) Luxol fast blue periodic acid–Schiff (LFB-PAS, B) and stain against the major myelin protein proteolipid protein (PLP, C) of whole mounts of the right cerebral hemisphere show lack of myelin most evident in the deep white matter with relative sparing of the U-fibers. The PLP stain also shows that the lack of myelin has a patchy appearance (arrow). (D) Hematoxylin & eosin (H&E) stain of the frontal lobe confirms that the U-fibers are better preserved. (E and F) LFB-PAS and H&E stains of the deep frontal white matter show variable degrees of tissue rarefaction and microcystic degeneration of the tissue. Note the relatively low numbers of oligodendrocytes, as identified by their small, deeply basophilic, round nucleus. (G) The vacuoles are crossed by PLP-immunopositive strands, indicative of intramyelinic edema. (H and I) Stain against the astrocytic glial fibrillary acidic protein (GFAP) (H) and LFB-PAS (I) demonstrate that the degree of reactive gliosis is meagre compared to the tissue damage and that astrocytes contain GFAP-positive intracytoplasmic inclusions (H and I, inset). (J) Stain against CD68 of the deep parietal white matter shows absence of macrophages and scanty microglial reaction. (K) Stain against neurofilaments 200 KDa (NF) of the frontal lobe shows an axonal spheroid. (L) H&E stain of the capsula externa shows relative preservation of the tissue with near-normal amounts of myelin and oligodendrocyte numbers. (M) H&E stain of the midbrain shows microcystic appearance of the white matter of the corticospinal tracts with myelin pallor and reduced oligodendrocytes numbers. (N) In the same region, NF-positive axonal spheroids are numerous. (O) H&E stain of cerebellar folium shows loss of cells in the cortical granular layer and of Purkinje cells. The cell density in the molecular layer is near to normal. Original magnifications: D and O, ×50; E–N, ×200.
Figure 3
Figure 3. LARS2 and KARS variants
Schematic representation of the variants identified in this study (in red) or in the literature (in black) on the KARS and LARS2 genes and proteins, and their corresponding phenotypes. Variants identified in this study and previously reported,,,, appear in purple. The mutation nomenclature for KARS variants is based on the mitochondrial isoform (NM_001130089.1). DD = developmental delay.
Figure 4
Figure 4. Aminoacylation assay
(A) MtLeuRS activity normalized to average control cells at 100% of patients (n = 3) and controls (n = 3) as a group in mitochondria isolated from lymphoblast cell lines. MtIleRS activity is shown as simultaneously measured control enzyme. (B) MtLeuRS activity normalized to average control cells at 100% of individual patients and controls in mitochondria isolated from lymphoblast cell lines. Samples were measured in triplicate; error bars represent SEM.
Figure 5
Figure 5. Immunoblot
Immunoblot analysis of LARS2 and the respiratory chain complexes (I–V) in patient 2 (P2) and age-matched control (C) muscle. VDAC1 was used as a loading control.

References

    1. van der Knaap MS, Bugiani M. Leukodystrophies: a proposed classification system based on pathological changes and pathogenetic mechanisms. Acta Neuropathol 2017;134:351–382. - PMC - PubMed
    1. Vanderver A, Prust M, Tonduti D, et al. Case definition and classification of leukodystrophies and leukoencephalopathies. Mol Genet Metab 2015;114:494–500. - PMC - PubMed
    1. Kevelam SH, Steenweg ME, Srivastava S, et al. Update on leukodystrophies: a historical perspective and adapted definition. Neuropediatrics 2016;47:349–354. - PubMed
    1. Vanderver A, Simons C, Helman G, et al. Whole exome sequencing in patients with white matter abnormalities. Ann Neurol 2016;79:1031–1037. - PMC - PubMed
    1. Yao P, Fox PL. Aminoacyl-tRNA synthetases in medicine and disease. EMBO Mol Med 2013;5:332–343. - PMC - PubMed

Publication types

MeSH terms

Supplementary concepts