. 2019 Feb 8;4(32):eaau9079.
doi: 10.1126/sciimmunol.aau9079.

Diet modulates colonic T cell responses by regulating the expression of a Bacteroides thetaiotaomicron antigen

Affiliations

Diet modulates colonic T cell responses by regulating the expression of a Bacteroides thetaiotaomicron antigen

Marta M Wegorzewska et al. Sci Immunol. .

Abstract

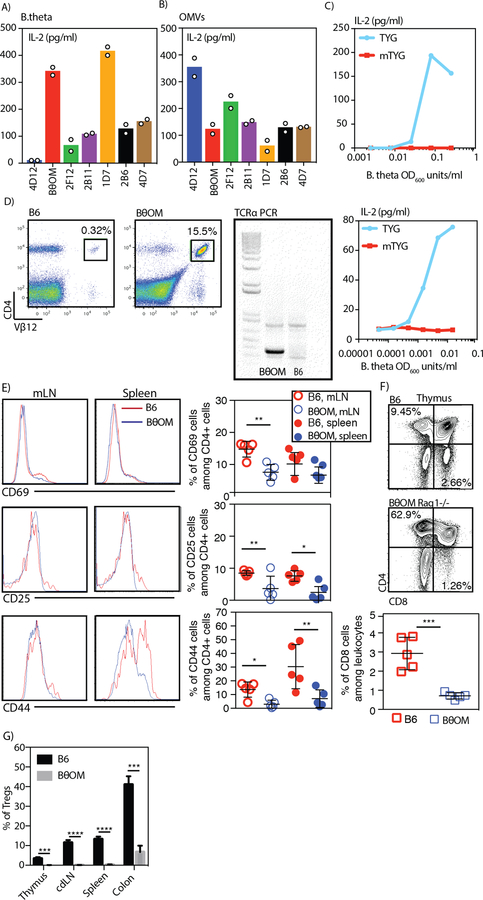
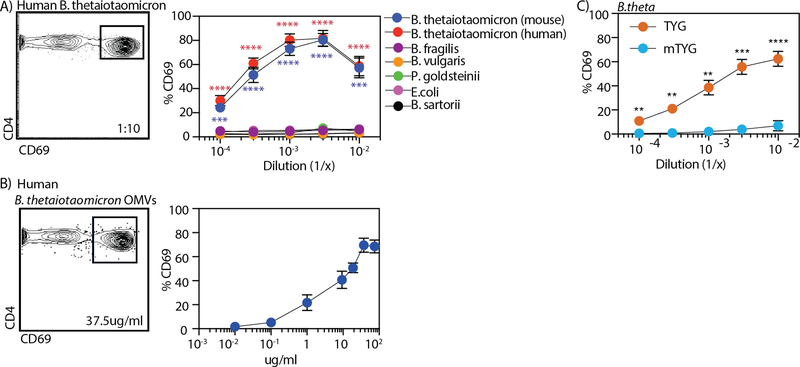
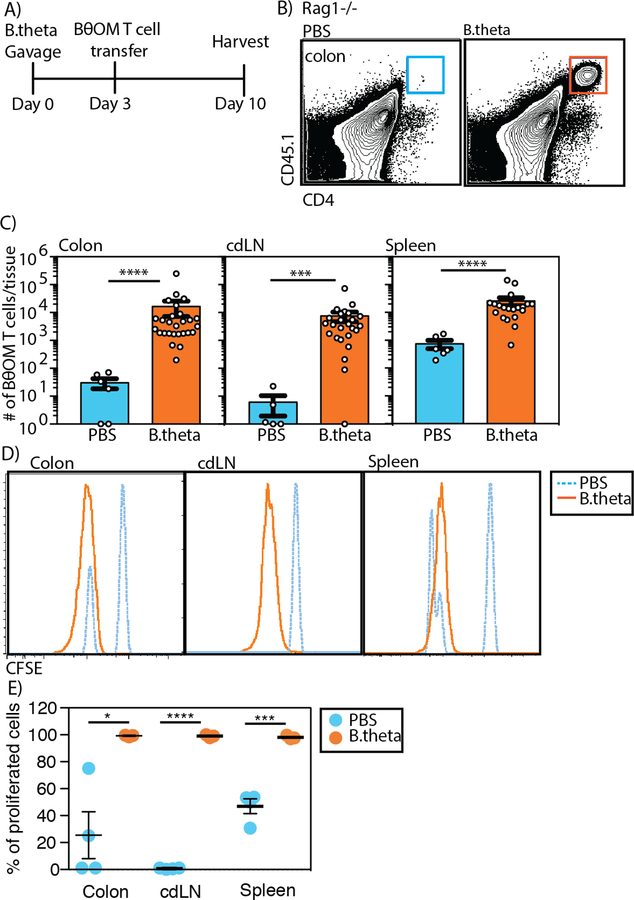
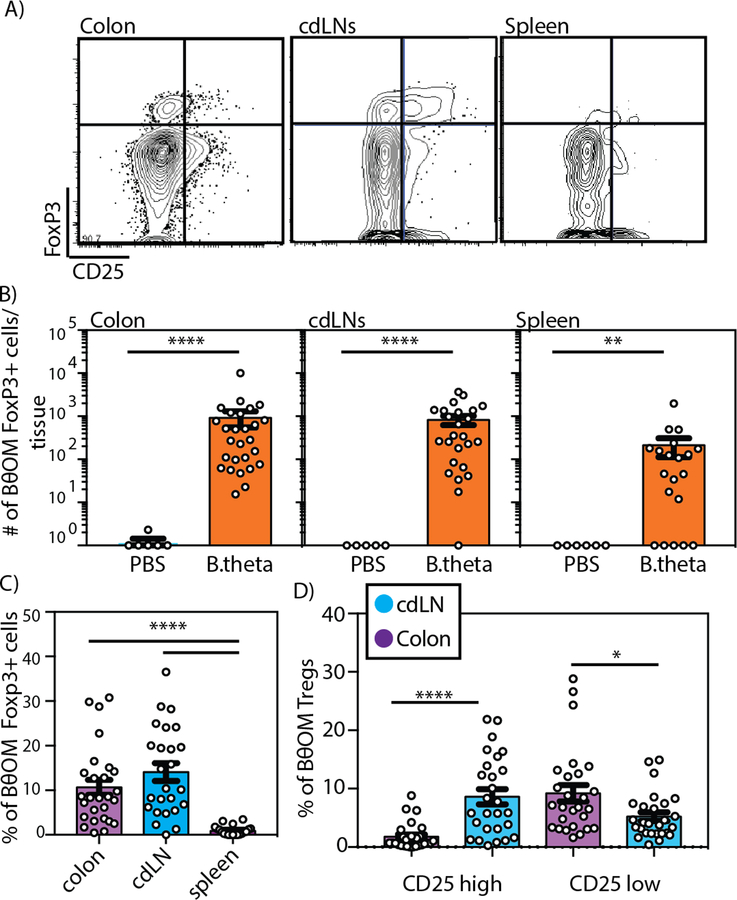
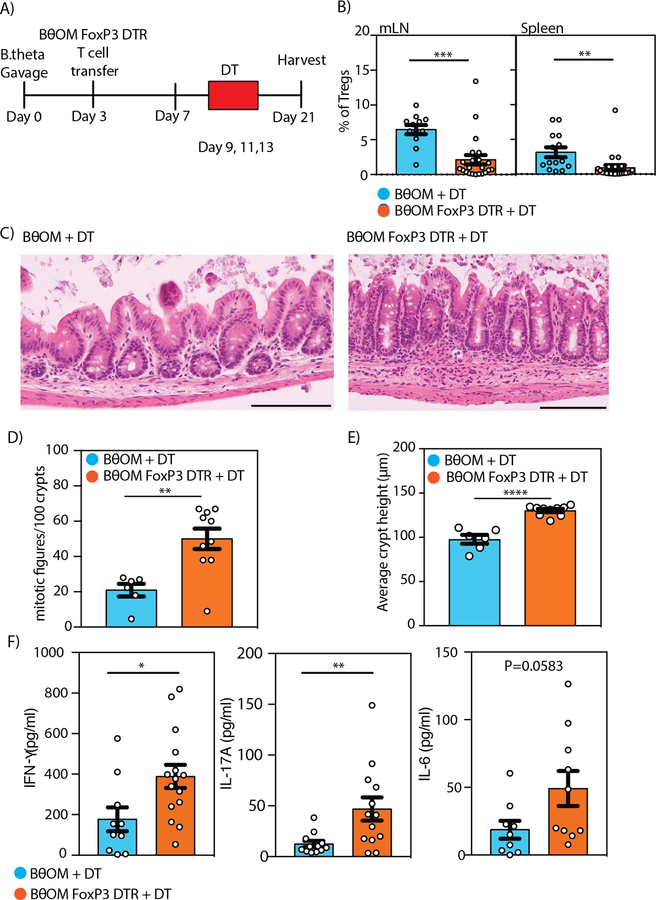
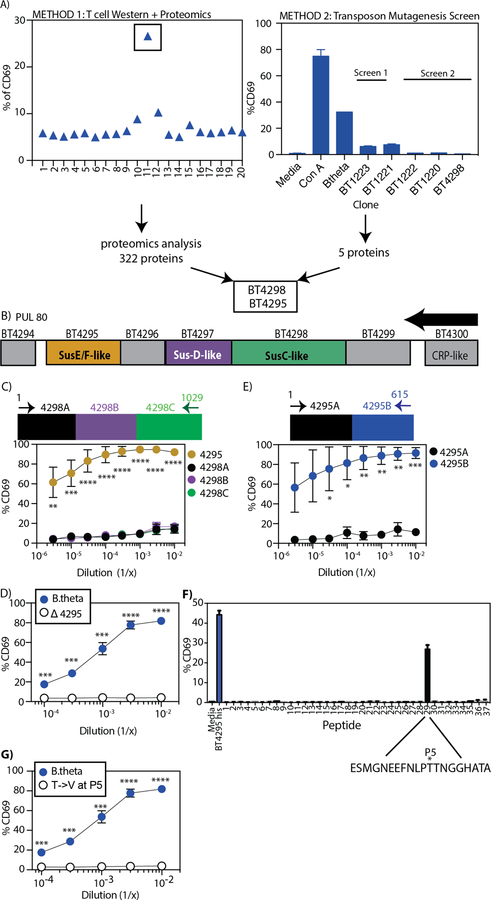
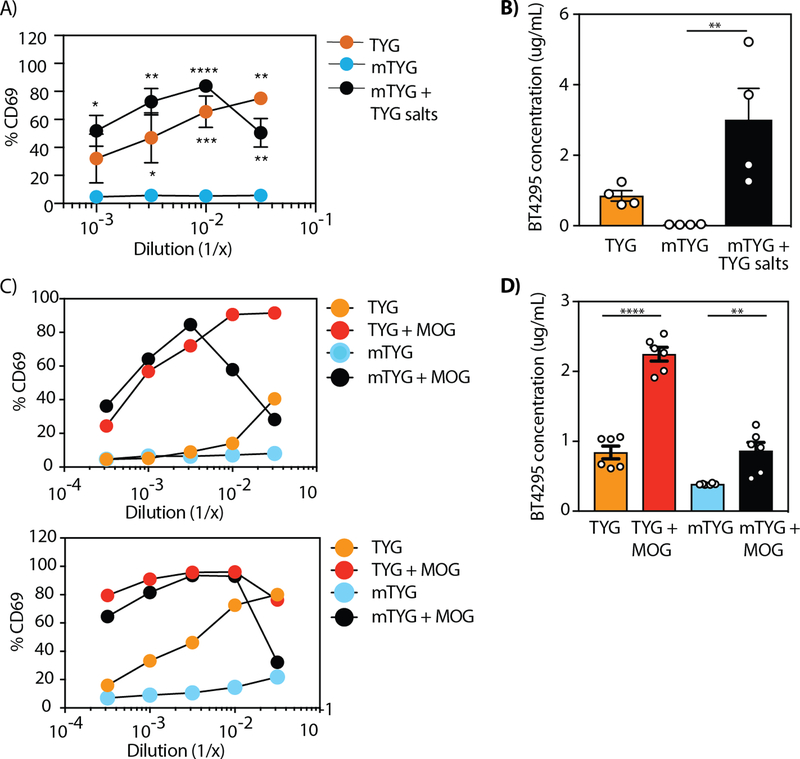
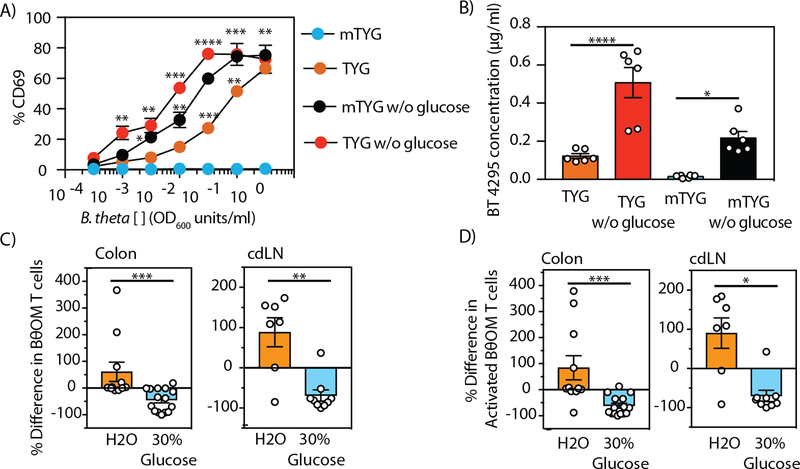
T cell responses to symbionts in the intestine drive tolerance or inflammation depending on the genetic background of the host. These symbionts in the gut sense the available nutrients and adapt their metabolic programs to use these nutrients efficiently. Here, we ask whether diet can alter the expression of a bacterial antigen to modulate adaptive immune responses. We generated a CD4+ T cell hybridoma, BθOM, specific for Bacteroides thetaiotaomicron (B. theta). Adoptively transferred transgenic T cells expressing the BθOM TCR proliferated in the colon, colon-draining lymph node, and spleen in B. theta-colonized healthy mice and differentiated into regulatory T cells (Tregs) and effector T cells (Teffs). Depletion of B. theta-specific Tregs resulted in colitis, showing that a single protein expressed by B. theta can drive differentiation of Tregs that self-regulate Teffs to prevent disease. We found that BθOM T cells recognized a peptide derived from a single B. theta protein, BT4295, whose expression is regulated by nutrients, with glucose being a strong catabolite repressor. Mice fed a high-glucose diet had a greatly reduced activation of BθOM T cells in the colon. These studies establish that the immune response to specific bacterial antigens can be modified by changes in the diet by altering antigen expression in the microbe.


Conflict of interest statement

Competing interests: The authors declare that they have no competing interests.

Figures

Fig. 1
Fig. 1. Generation and characterization of the BθOM TCR transgenic mouse.
(A-B) IL-2 levels in pg/ml after generated T cell hybrid clones were cultured with BMDMs loaded with (A) B. theta (n=2, 1 experiment) or (B) OMVs (n=2, 1 experiment). (C) IL-2 levels in pg/ml after the BθOM T cell hybrid was cultured with BMDMs loaded with B. theta grown in TYG or mTYG (n=2, both replicates are shown). (D) Representative flow cytometry plot with Vβ12 staining on blood leukocytes of C57BL/6J mice (left) or BθOM transgenic mice (middle) (n=3, 3 experiments). Representative TCRα1 PCR on DNA isolated from tails of C57BL/6J mice and BθOM transgenic mice (right) (x=3, 3 experiments). (E) Representative histograms of CD69, CD25 and CD44 expression (left) and quantification of the percentage of CD69, CD25 and CD44 cells among all CD4 cells (right) isolated from the mLNs and spleen of C57BL/6J mice (red) or BθOM transgenic mice (blue) (x=5, 3 experiments). (F) Representative flow cytometry plots of CD4 and CD8 staining of thymic cells isolated from C57BL/6J mice or BθOM transgenic mice (x=5, 3 experiments) and quantification of the percentage of CD8 T cells among the thymic leukocyte population. (G) The percentage of Tregs in the thymus (n≥6, n=3 experiments), colon-draining lymph node (cdLN) (n≥10, n=6 experiments), spleen (n≥10, n=6 experiments), and colon (n=4, n=4 experiments) of C57BL/6J mice (black) or BθOM transgenic mice (gray). Student’s t test: (E) *P<0.1, **P<0.01 (F) ***P=0.0004 (G) **** P<0.0001, ***P=0.0001.
Fig. 2
Fig. 2. B. theta activates BθOM T cells in a nutrient-dependent manner.
(A-B) The percentage of CD69 expressing BθOM T cells after a 24-hour culture with BMDM loaded with (A) Bacteroidaceae family (human: B. thetaiotaomicron (n=4, 4 experiments); mouse: B. fragilis, B. vulgaris, P. goldsteinii, E.coli, B. sartorii (n=3, 3 experiments), or (B) human B. theta OMVs (75µg/ml: n=7, 6 experiments; 37.5µg/ml: n=6, 6 experiments; 18.75µg/ml: n=5, 4 experiments; 10µg/ml: n=8, 6 experiments; 1µg/ml: n=3, 3 experiments; 0.1µg/ml: n=4, 4 experiments; 0.01µg/ml: n=3, 3 experiments). Flow cytometry plots are gated on CD4+ CD45.1+ leukocytes. (C) the percentage of CD69 expressing BθOM hybridoma T cells after a 24-hour culture with BMDM loaded with human B. theta grown in TYG (n=13, 5 experiments) or mTYG media (n=5, 5 experiments). One-way ANOVA analysis: (A) ***P<0.001, ****P < 0.0001. Means with asterisks are significantly different by Tukey’s multiple comparisons test. Student’s t test: (C) **** P<0.0001, ***P=0.0001, **P<0.01.
Fig. 3
Fig. 3. BθOM T cells proliferate in the colon in B. theta colonized mice.
(A) Schematic of adoptive transfer of BθOM T cells into Rag1−/− mice gavaged with PBS or B. theta. (B) Representative flow cytometry plots of CD45.1+CD4+ BθOM T cells in the colon of B. theta gavaged mice compared to PBS gavaged mice. (C) Number of BθOM T cells among live leukocytes that are CD45.2-CD45.1+CD4+ in PBS or B. theta gavaged mice in the colon (n≥6, ≥5 experiments), cdLN (n≥5, ≥3 experiments), and spleen (n≥6, ≥4 experiments). (D) Representative histograms of adoptively transferred CFSE-labeled BθOM T cells in the colon (n≥3, ≥3 experiments), cdLN (n≥3, 3 experiments), and spleen (n≥3, ≥3 experiments) of B. theta gavaged mice compared to PBS gavaged mice. (E) Quantification of the percentage of proliferated CFSE low CD45.2-CD45.1+CD4+ T cells in the colon (n≥3, ≥3 experiments), cdLN (n≥3, 3 experiments) and spleen (n≥3, ≥3 experiments). Mann-Whitney test for non-normally distributed data: (C)****P < 0.0001, ***P=0.0006. Student’s t test: (E) ****P < 0.0001, ***P=0.0005, *P=0.0160
Fig. 4
Fig. 4. BθOM T cells in the colon differentiate into Tregs.
(A) Flow cytometry plots of CD45.1+CD4+ BθOM T cells in the colon, cdLN, and spleen of PBS or B. theta gavaged Rag1−/− mice transferred with naive CD25- BθOM T cells. (B) The number of CD4+ CD45.1+FoxP3+ BθOM Tregs cells in the colon (n≥6, ≥5 experiments), cdLN (n≥5, ≥3 experiments), and spleen (n≥6, ≥4 experiments) of PBS or B. theta gavaged Rag1−/− mice after CD25- BθOM T cell transfer. (C) The percentage of FoxP3+ Tregs in the colon (n=27, 9 experiments), cdLNs (n=25, 7 experiments), and spleen (n=20, 7 experiments) of Rag1−/− mice that received naive CD25- BθOM T cells and were gavaged with B. theta. (D) The percentage of CD25high versus CD25low CD4+FoxP3+ Tregs in the colon (n=27, 9 experiments) and cdLNs (n=25, 7 experiments) of Rag1−/− mice gavaged with B. theta and injected with naive BθOM T cells. Mann-Whitney test for non-normally distributed data: (B)****P<0.0001, **P=0.004. Kruskal–Wallis with Dunn’s posttest, for non-normally distributed data: (C) ****P<0.0001. Two-way ANOVA analysis: (D) ****P<0.0001, *P=0.0161.
Fig. 5
Fig. 5. Depletion of BθOM Tregs drives BθOM CD4+ Teff to cause colitis.
(A) Schematic of adoptive transfer of BθOM or BθOM-FoxP3-DTR T cells into Rag1−/− mice gavaged with PBS or B. theta and treated with diphtheria toxin (31) to deplete BθOM Tregs. (B) Percentage of BθOM Tregs after depletion in the mLN (n≥12, 5 experiments) or spleen (n≥14, 5 experiments). (C-E) (C) Histology, (D) quantification of the number of mitotic figures/10 crypts, and (E) average crypt height in cecal sections from Rag1−/− mice given BθOM T cells and DT (n=6, 3 experiments) compared to those given BθOM-FoxP3-DTR T cells and DT (n=10, 3 experiments). Bars: 120 μm. (F) Cytometric bead array used to quantify IFNγ (n≥10, 3 experiments), IL-17A (n≥10, 3 experiments), and IL-6 (n≥10, 3 experiments) after cells isolated from the mLN were stimulated with PMA for 5 hours. Student’s t test: (B) ***P=0.0002, **P=0.0055, (D) **P=0.0029, (E) ****P<0.0001, (F) *P=0.0205, **P=0.098.
Fig. 6
Fig. 6. BθOM T cells specifically recognize the BT4295(541–554) epitope.
(A) Two parallel methods, T cell Western with Proteomics (left) and Transposon Mutagenesis (TM) (20) Screen (right), used to identify the antigen that stimulates BθOM T cells. (B) Schematic of the polysaccharide utilization locus (PUL80) affected by BT4298 disruption by TM. The arrow represents the direction of transcription. (C-G) The percentage of CD69 expressing BθOM T cells after culture with BMDM loaded with (C) E. coli expressing the full length BT4295 (n=3, 3 experiments for each dilution) or three consecutive segments of BT4298 (BT4298A, B, C) (n=3, 3 experiments for each dilution), (D) B. theta (n=4, 4 experiments) or Δ4295 (n=4, 4 experiments), or (E) E. coli expressing two consecutive segments of BT4295 (BT4295A and B) (n=3, 3 experiments for each dilution). (F) Synthetic 20-amino acid peptides overlapping by 12 amino acids. The asterisks represent the P5 position. (G) B. theta (n=4, 4 experiments, same data as Fig. 2E) or Δ4295 (n=3, 3 experiments). One-way ANOVA analysis: (C) **P<0.01, ***P<0.001, ****P<0.0001. Means with asterisks are significantly different by Tukey’s multiple comparisons test. Student’s t test: (D) ***P<0.001, ****P<0.0001, (E) *P<0.1, **P<0.01, ***P<0.001, (G) ***P<0.001, ****P<0.0001.
Fig. 7
Fig. 7. Salt and glycan regulate BT4295 expression and alter BθOM T cell activation.
(A) The percentage of CD69 expressing BθOM T cells after a 24-hour culture with BMDM loaded with B. theta grown in mTYG (n=4, 4 experiments), TYG (n=2, 2 experiments), and mTYG supplemented with TYG salts (n=4, 4 experiments). (B) The concentration in µg/mL of BT4295 protein expressed in B. theta grown in TYG, mTYG, and mTYG supplemented with TYG salts (n=4, 4 experiments) as determined by a quantitative ELISA. (C) The percentage of CD69 expressing BθOM T cells after a 24-hour culture with BMDM loaded with B. theta grown in mTYG, TYG, mTYG supplemented with MOG, and TYG supplemented with MOG (n=2, 2 experiments). (D) The concentration in µg/mL of BT4295 protein expressed in B. theta grown in mTYG, TYG, mTYG supplemented with MOG, and TYG supplemented with MOG (n=3, 3 experiments) as determined by a quantitative ELISA. One-way ANOVA analysis: (A) *P<0.1, **P<0.01, ***P<0.001, ****P<0.0001, (B) ** P=0.0093, (D) ****P<0.0001, **P=0.0065. Means with asterisks are significantly different by Tukey’s multiple comparisons test.
Fig. 8
Fig. 8. Dietary glucose represses BT4295 expression, decreasing the activation of BθOM T cells in vivo.
(A) Representative plot of the percentage of CD69 expressing BθOM T cells after culture with BMDM loaded with B. theta grown in TYG and mTYG media with or without glucose (n=6, 3 experiments). (B) The concentration in µg/mL of BT4295 protein expressed in B. theta grown in TYG and mTYG media with or without glucose (n=6, 3 experiments). The percent difference in the number of (C) CD4+CD45.1+ BθOM T cells or (D) CD4+CD45.1+CD44+CD62L- activated BθOM T cells in the colon (n=26, x=3 experiments) and cdLN (n=16, 2 experiments) of B. theta colonized mice given water or 30% glucose water and adoptively transferred with 200,000 CD4-enriched BθOM T cells. (C-D) The percent difference was calculated from the mean of each experiment. ANOVA-multiple comparison analysis: (A) *P<0.05, **P<0.01, ***P<0.001, ****P<0.0001, (B)****P<0.0001, *P=0.0190. Means with asterisks are significantly different by Tukey’s multiple comparisons test. Mann-Whitney test for non-normally distributed data: (C) ***P=0.0002, **P=0.0052, (D) ***P=0.0002, *P=0.0115.

Comment in

References

    1. Khalili H, Chan SSM, Lochhead P, Ananthakrishnan AN, Hart AR, Chan AT, The role of diet in the aetiopathogenesis of inflammatory bowel disease. Nat. Rev. Gastroenterol. Hepatol 10.1038/s41575-018-0022-9, (2018). - DOI - PMC - PubMed
    1. Kleinewietfeld M, Manzel A, Titze J, Kvakan H, Yosef N, Linker RA, Muller DN, Hafler DA, Sodium chloride drives autoimmune disease by the induction of pathogenic TH17 cells. Nature 496, 518–522 (2013). - PMC - PubMed
    1. Smith PM, Howitt MR, Panikov N, Michaud M, Gallini CA, Bohlooly YM, Glickman JN, Garrett WS, The microbial metabolites, short-chain fatty acids, regulate colonic Treg cell homeostasis. Science 341, 569–573 (2013). - PMC - PubMed
    1. Hooper LV, Littman DR, Macpherson AJ, Interactions between the microbiota and the immune system. Science 336, 1268–1273 (2012). - PMC - PubMed
    1. MacIver NJ, Michalek RD, Rathmell JC, Metabolic regulation of T lymphocytes. Annu. Rev. Immunol 31, 259–283 (2013). - PMC - PubMed

Publication types

MeSH terms