. 2019 Feb 8;10(1):650.
doi: 10.1038/s41467-018-08247-x.

Single-cell analysis reveals fibroblast heterogeneity and myeloid-derived adipocyte progenitors in murine skin wounds

Affiliations

Single-cell analysis reveals fibroblast heterogeneity and myeloid-derived adipocyte progenitors in murine skin wounds

Christian F Guerrero-Juarez et al. Nat Commun. .

Abstract

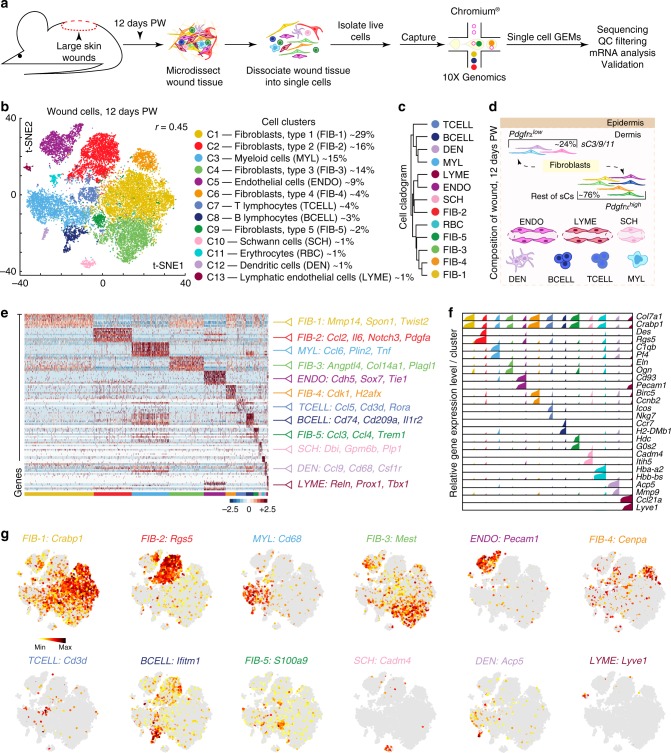
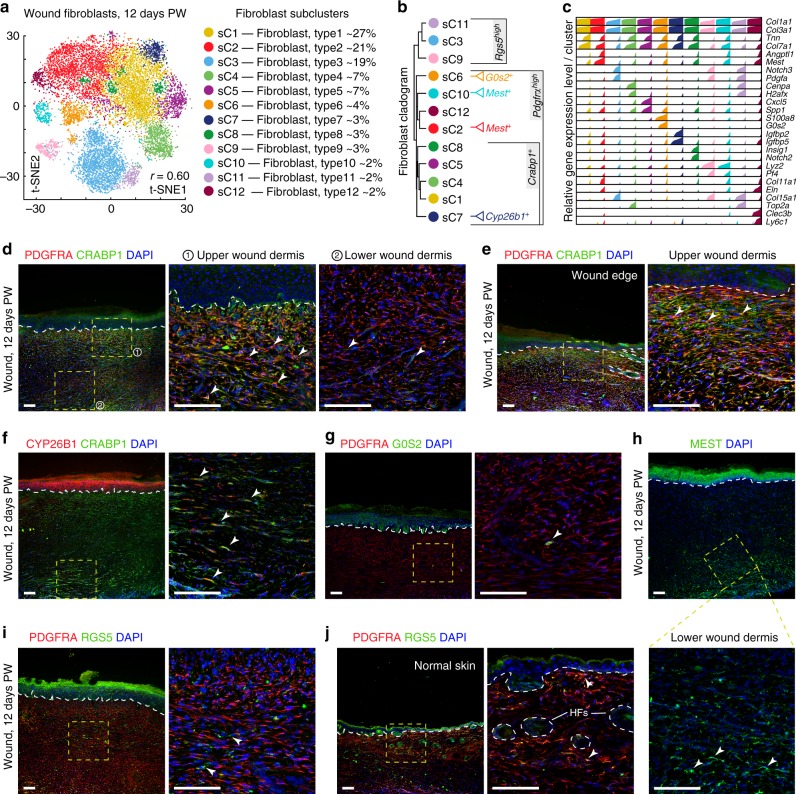
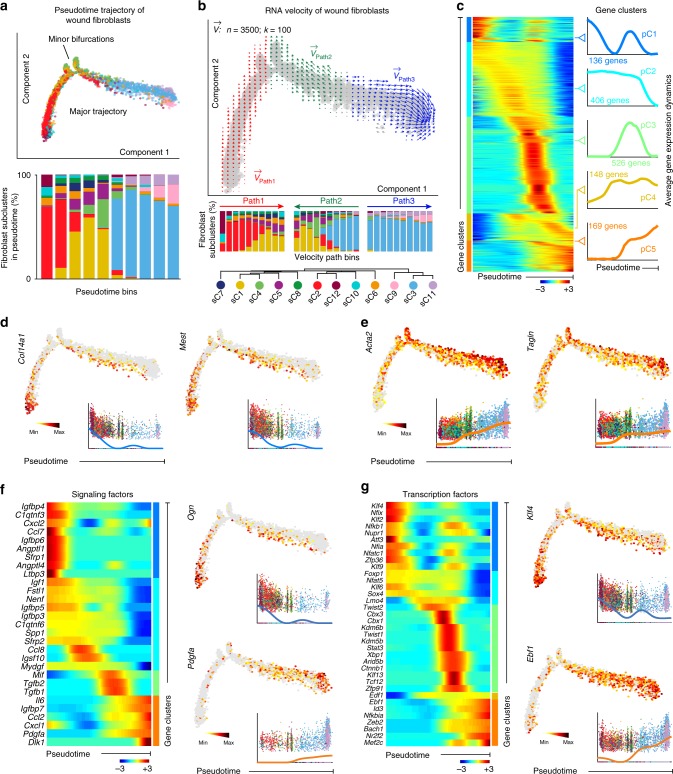
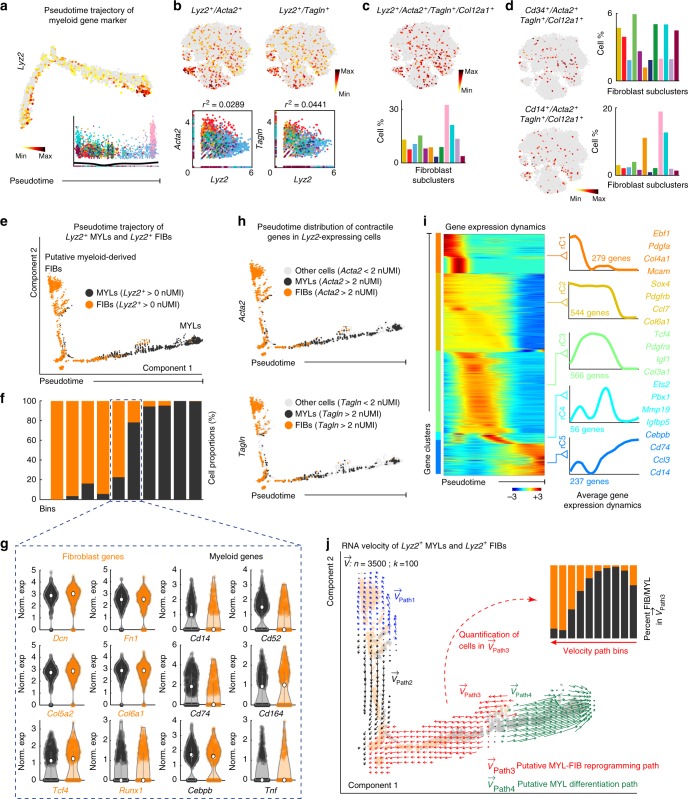
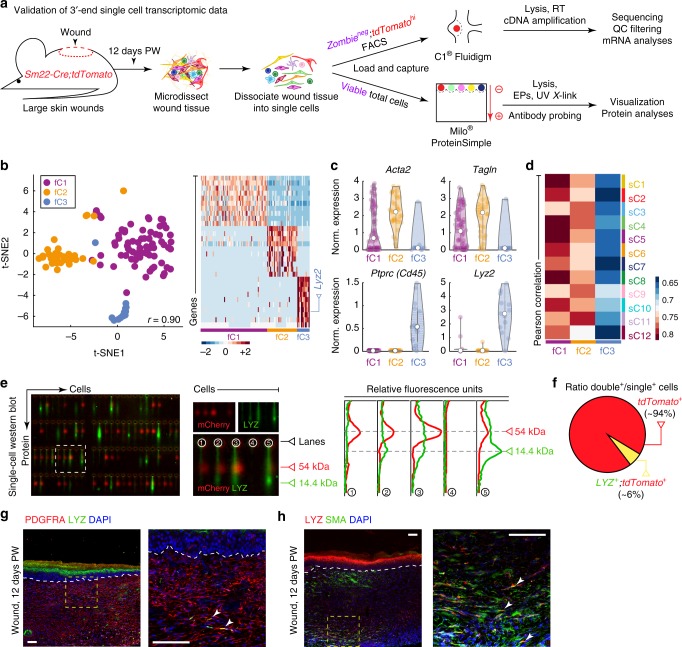
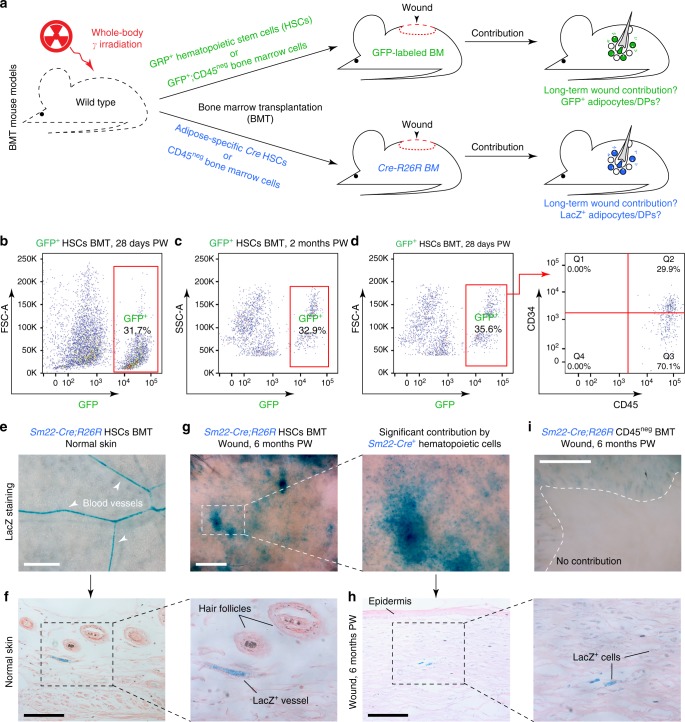
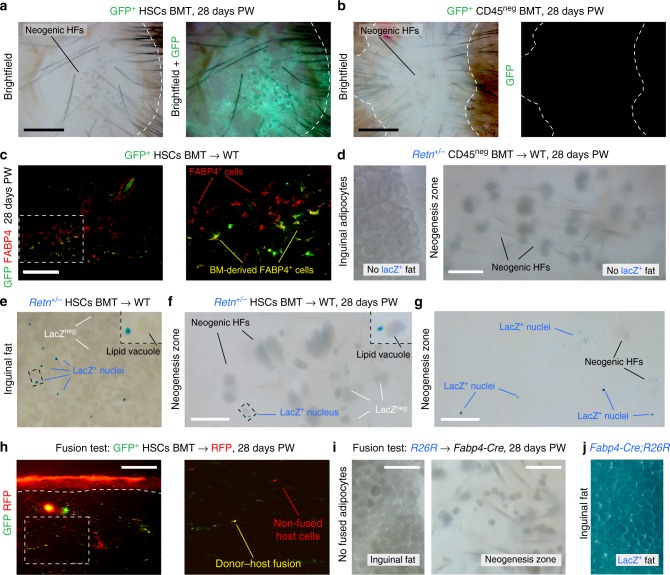
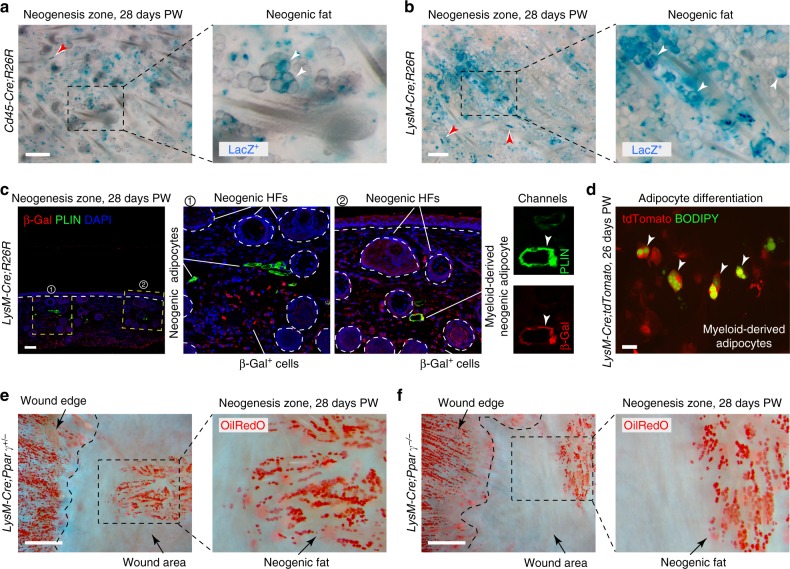
During wound healing in adult mouse skin, hair follicles and then adipocytes regenerate. Adipocytes regenerate from myofibroblasts, a specialized contractile wound fibroblast. Here we study wound fibroblast diversity using single-cell RNA-sequencing. On analysis, wound fibroblasts group into twelve clusters. Pseudotime and RNA velocity analyses reveal that some clusters likely represent consecutive differentiation states toward a contractile phenotype, while others appear to represent distinct fibroblast lineages. One subset of fibroblasts expresses hematopoietic markers, suggesting their myeloid origin. We validate this finding using single-cell western blot and single-cell RNA-sequencing on genetically labeled myofibroblasts. Using bone marrow transplantation and Cre recombinase-based lineage tracing experiments, we rule out cell fusion events and confirm that hematopoietic lineage cells give rise to a subset of myofibroblasts and rare regenerated adipocytes. In conclusion, our study reveals that wounding induces a high degree of heterogeneity among fibroblasts and recruits highly plastic myeloid cells that contribute to adipocyte regeneration.


Conflict of interest statement

The authors declare no competing interests.

Figures

Fig. 1
Fig. 1
scRNA-seq analysis reveals cellular heterogeneity in day 12 wounds. a Schematic of cell isolation, cell processing, capture by droplet-based device, sequencing, and downstream analysis. b t-SNE plot revealed cellular heterogeneity with 13 distinct clusters of cells identified and color-coded. General identity of each cell cluster is defined on the right. Parameter r refers to Seurat’s FindClusters function and determined clustering resolution. c Unsupervised hierarchical clustering of average gene signatures showing relatedness of cell clusters (correlation distance metric, average linkage). d Wound schematic showing cellular repertoire. Different cell types, as identified on scRNA-seq, are color-coded to match colors on b. e Heatmap of differentially expressed genes. For each cluster the top 10 genes and their relative expression levels in all sequenced wound cells are shown. Selected genes for each cluster are color-coded and shown on the right. f Relative expression of selected cluster-specific genes shown as high-density bar charts. Bar height corresponds to gene’s relative expression level in each cell and ordering is performed from low to high expressing cells. Two genes are shown per cluster and clusters are color-coded to match the colors in b. g Feature plots of expression distribution for selected cluster-specific genes. Expression levels for each cell are color-coded and overlaid onto t-SNE plot. Cells with the highest expression level are colored black. PW: post-wounding, GEM: gel bead-in-emulsion, QC: quality control
Fig. 2
Fig. 2
Subclustering of wound fibroblasts reveals cellular heterogeneity. a Subclustering of wound fibroblasts (cells from clusters C1, C2, C4, C6, and C9 shown in Fig. 1) further identified 12 distinct subtypes. Color-coded t-SNE plot is shown and each fibroblast subcluster (sC1 through sC12) is defined on the right. b Unsupervised hierarchical clustering showing relatedness of wound fibroblast subclusters. Immunostaining markers specific to individual fibroblast subclusters or groups of subclusters are listed on the right. c Relative expression of selected subcluster-specific genes shown as high-density bar charts. Bar charts are generated analogous to these in Fig. 1f. Two genes are shown per subcluster and subclusters are color-coded to match the colors in a. d–j Staining of day 12 wounds for selected markers. d, e Co-staining for PDGFRA (red) and CRABP1 (green) identifies enriched localization of CRABP1+/PDGFRA+ double-positive fibroblasts in the upper wound dermis (arrowheads on inset 1 on d and inset on e). Lower wound dermis contains large numbers of PDGFRA+ single-positive fibroblasts (inset 2 on d). f Co-staining for CRABP1 (green) and CYP26B1 (red) identifies occasional CYP26B1+/CRABP1+ double-positive fibroblasts (arrowheads on inset). g Co-staining for PDGFRA (red) and G0S2 (green) identifies seldom G0S2+/PDGFRA+ double-positive fibroblasts (arrowhead on inset). h Numerous MEST+ cells (green) are present in the wound and primarily localize in the lower wound dermis (arrowheads on inset). i Co-staining for PDGFRA (red) and RGS5 (green) identifies RGS5+ single-positive fibroblasts present throughout wound dermis (arrowheads on inset). j Normal, unwounded skin contains both RGS5+ single-positive and RGS5+/PDGFRA+ double-positive fibroblasts, especially in the upper dermis (arrowheads on inset). Hair follicles are marked. Immunostaining images shown in this figure are representative of the marker staining patterns observed in three or more independently stained samples. PW: post-wounding, HF: hair follicle. Size bars: dj—100 µm
Fig. 3
Fig. 3
Pseudotime analyses reveal putative fibroblast differentiation trajectories. a Pseudotime ordering on wound fibroblasts arranged them into a major trajectory, with two minor bifurcations (top panel). Stacked bar chart shows relative abundance of fibroblasts from distinct subclusters across the pseudotime, which was divided into ten equal bins (bottom panel). Pdgfralow sC3/9/11 cells primarily occupy right half of the trajectory, with the remaining part consisting of Pdgfrahigh cells. All cells on the pseudotime and the bar chart are color-coded to match the colors in Fig. 2a. b RNA velocity analysis distinguished three sets of velocity vectors across the pseudotime: Path1 (red), Path2 (green) and Path3 (blue). Stacked bar charts show relative abundance of fibroblast subclusters across individual RNA velocity paths (middle panel). Bottom panel defines fibroblast subcluster colors and matches the colors in Fig. 2a. c scEpath analysis performed on pseudotime identified five gene clusters (pC1 through pC5) of pseudotime-dependent genes. Heatmap of the expression levels for all differentially expressed genes in all analyzed wound fibroblasts is shown on the left. Average gene expression dynamics and gene counts in all five clusters are shown on the right. d Feature plots of expression distribution for Col14a1 and Mest across pseudotime. Both genes are part of cluster pC1 and mark the beginning points of RNA velocity Path1 and Path2. Expression levels for each cell are color-coded with the highest expression level colored black. e Feature plots of expression distribution for contractile markers Acta2 and Tagln across pseudotime. Cells with the highest expression level are colored black. Numbers of both Acta2+ and Tagln+ cells peak around minor bifurcations and along Path3. f, g Expression level heatmaps for selected signaling factors (f) and transcription factors (g) identified as differentially expressed on c. Each heatmap is accompanied by color-coded pseudotime feature plots for two selected genes. Numbers of Ogn+ and Klf4+ cells peak at the beginning points of RNA velocity Path1 and Path2, while numbers of Pdgfa+ and Ebf1+ cells increase along Path3. Cells with the highest expression level are colored black
Fig. 4
Fig. 4
Identification of rare myeloid-derived myofibroblasts in day 12 wounds. a Expression levels of myeloid marker Lyz2 shown as pseudotime feature plot. Cells with the highest expression level are colored black. Lyz2+ cells are present throughout the pseudotime. b Overlay of Lyz2 and contractile markers Acta2 and Tagln expression onto the t-SNE space reveals Lyz2+/Acta2+ and Lyz2+/Tagln+ double-positive wound fibroblasts. c Overlay of Lyz2, Acta2, Tagln and fibroblast marker Col12a1 onto the t-SNE space reveals Lyz2+/Acta2+/Tagln+/Col12a1+ quadruple-positive cells among wound fibroblasts. Quantification (bottom) shows that quadruple-positive cells are present in all wound fibroblast subclusters, with subclusters sC9 (pink) and sC10 (teal) being the most enriched. d Overlay of Acta2, Tagln and Col12a1 expression with that of the hematopoietic progenitor-associated marker Cd34 and myeloid marker Cd14 reveals Cd34+/Acta2+/Tagln+/Col12a1+ and Cd14+/Acta2+/Tagln+/Col12a1+ quadruple-positive cells present among wound fibroblasts. e Joint pseudotime ordering on Lyz2+ wound myeloid cells (black) and Lyz2+ fibroblasts (orange). Cells with normalized UMI (nUMI) counts > 0 were selected for this analysis. f Stacked bar chart shows relative distribution of fibroblasts and myeloid cells across the pseudotime, which was divided into 10 equal bins. g Middle two bins show almost equal mixing of both cell types with hybrid expression patterns, simultaneously enriched for established fibroblast-specific and myeloid-specific genes. h Distribution of cells expressing contractile markers Acta2 and Tagln shown as pseudotime feature plots. Cells were considered positive if their nUMI counts were > 2. Positive fibroblasts are colored orange, positive myeloid cell—black and negative cells—light gray. Positive cells are present across the entire pseudotime. i scEpath analysis performed on pseudotime from e along the fibroblast-to-myeloid trajectory identified five gene clusters (rC1 through rC5) of pseudotime-dependent genes. Heatmap is shown on the left. Average gene expression, gene counts and selected genes in all five clusters are shown on the right. j RNA velocity analysis distinguished several sets of velocity vectors across the pseudotime. Path3 vectors (red) encompass the middle bins from g and appear to represent putative transition of Lyz2+ myeloid cells into fibroblasts. Path4 vectors (green) appear to mark differentiation of wound-resident myeloid cells. FIB: fibroblast, MYL: myeloid cell
Fig. 5
Fig. 5
Validation of myeloid-derived myofibroblasts in day 12 wounds. a Schematic of cell isolation from day 12 wounds in Sm22-Cre;tdTomato mice, sorting for tdTomato+ cells, capture by microfluidic device, sequencing and downstream analysis, and wound cell processing for single-cell western blot. b t-SNE plot revealed heterogeneity among tdTomato+ wound cells. 116 sequenced cells were analyzed and three clusters were identified. Heatmap of top differentially expressed genes is shown on the right and Lyz2 is marked. c Violin plots of contractile markers Acta2 and Tagln, pan-hematopoietic marker Ptprc (aka Cd45) and myeloid marker Lyz2. d Pearson correlation analysis between day 12 tdTomato+ cell clusters and day 12 wound fibroblasts subclusters from Fig. 2a. e Single-cell western blot on unsorted cells from day 12 Sm22-Cre;tdTomato wounds revealed LYZ-expressing myofibroblasts. Chips were co-stained for LYZ (green) and tdTomato (mCherry, red). Graph on the right shows LYZ+/tdTomato+ double-positive cells in lanes #2, #3, and #5. Cell in lane #1 is single-positive for tdTomato and cell in lane #4 is double-negative. f Quantification shows that ~6% of tdTomato+ wound cells co-express LYZ (77 out of 1293 cells). See also Supplementary Figure 14. g Co-staining of day 12 wounds for LYZ (green) and PDGFRA (red) identified occasional double-positive fibroblasts. h Co-staining of day 12 wounds for LYZ (red) and SMA (green) identified occasional double-positive myofibroblasts. Immunostaining images shown on g and h are representative of the marker staining patterns observed in three or more independently stained samples. PW: post-wounding, FACS: fluorescence-activated cell sorting, RT: reverse transcription, EP: electrophoresis, QC: quality control. Size bars: g, h—100 µm
Fig. 6
Fig. 6
Hematopoietic lineage contributes toward regenerating wounds in BMT mice. a Schematic representation of the key BMT experiments used to assess the contribution of hematopoietic lineage cells to de novo adipocytes. b–d Based on flow cytometry analysis, the hematopoietic lineage contributes ~30% of the cells in dermal wound tissue 28 days and 2 months PW in GFP+ HSCs BMT mice. eh LacZ expression patterns in the wounds of Sm22-Cre;R26R HSCs BMT mice confirmed that a portion of contractile wound cells (g, h) and perivascular contractile cells (arrowheads on e) originate from the hematopoietic lineage. i Wounding experiments in Sm22-Cre;R26R CD45neg BMT mice showed that non-hematopoietic BM cells do not contribute toward contractile wound and peri-wound cells. Images shown in e–i are representative of the lacZ expression patterns observed in three or more independent samples. HSC: hematopoietic stem cell, BM: bone marrow, BMT: bone marrow transplantation, DP: dermal papilla, PW: post-wounding day. Size bars: e, g, i—1 mm; f, h—125 µm
Fig. 7
Fig. 7
Hematopoietic lineage cells contribute to rare de novo adipocytes. a, b GFP expressing cells in GFP+ HSCs BMT mice (a), but not in GFP+ CD45neg BMT mice (b), showed significant contribution to the areas of neogenesis 28 days PW. See also Supplementary Figure 19. c In the wounds of GFP+ HSCs BMT mice, GFP+ cells localize around neogenic hair follicles and a portion of them co-expresses FABP4 at 28 days PW. Image is representative of the marker staining pattern observed in three or more independently stained samples. d CD45neg BM cells do not contribute toward adipocytes in the inguinal fat or regenerated 28 days PW wounds of BMT mice reconstituted with Retn-lacZ CD45neg cells. eg In contrast, hematopoietic lineage cells consistently contributed toward rare adipocytes (cells with nuclear lacZ expression) in the inguinal fat (e) and regenerated 28 days PW wounds (f, g) of BMT mice reconstituted with Retn-lacZ HSCs. Insets on e and f show positive adipocytes with lipid vacuole and peripherally-positioned lacZ+ nucleus. h Only rare cell fusion events were identified on the basis of GFP/RFP double fluorescence in 28 days PW wounds of GFP+ HSCs into RFP+ BMT mice. Fused and non-fused host cells are marked on the enlarged inset. Image is representative of the GFP and RFP expression patterns observed in three or more independently stained samples. i, j Lack of cell fusion-dependent de novo adipocytes in wounds of BMT models was confirmed by the absence of lacZ+ cells in R26R HSCs into Fabp4-Cre BMT mice (i). This was contrasted by robust lacZ expression in the inguinal fat of Fabp4-Cre;R26R mice (j). PW: post-wounding, BM: bone marrow, BMT: bone marrow transplantation, HSC: hematopoietic stem cell, HF: hair follicle. Size bars: a, b—1 mm; c, h—50 µm; d, f, g, i—200 µm
Fig. 8
Fig. 8
Myeloid lineage cells contribute to rare de novo adipocytes. a, b LacZ+ clusters of de novo adipocytes (white arrowheads) were consistently identified in the wounds of pan-hematopoietic specific Cd45-Cre;R26R (a) and myeloid-specific LysM-Cre;R26R mice (b). Red arrowheads mark lacZ+ DPs of neogenic hair follicles. See also Supplementary Figure 20. c Co-staining of day 28 LysM-Cre;R26R wounds for β-Gal (red) and PLIN (green) identified both single-positive (inset 1) and double-positive mature adipocytes (inset 2) in the region of neogenesis. Image is representative of the marker staining patterns observed in three or more independently stained samples. d Lipid-laden adipocytes (BODIPY+, green) can be differentiated in vitro under adipogenic conditions from tdTomato+ cells (red), isolated from day 26 hair-bearing wounds from LysM-Cre;tdTomato mice. e, f In agreement with the limited lineage contribution from myeloid cells toward de novo adipocytes LysM-Cre;Pparγ−/− mutants regenerated nearly normal-looking de novo fat (compare mutant wound on f with heterozygous control on e). Adipocytes were stained red with OilRedO. PW: post-wounding, HF: hair follicle. Size bars: a, b—200 µm; c—100 µm; d—25 µm; e, f—1 mm

References

    1. Zhang B, et al. Hair follicles’ transit-amplifying cells govern concurrent dermal adipocyte production through Sonic Hedgehog. Genes Dev. 2016;30:2325–2338. doi: 10.1101/gad.285429.116. - DOI - PMC - PubMed
    1. Plikus MV, et al. Cyclic dermal BMP signalling regulates stem cell activation during hair regeneration. Nature. 2008;451:340–344. doi: 10.1038/nature06457. - DOI - PMC - PubMed
    1. Festa E, et al. Adipocyte lineage cells contribute to the skin stem cell niche to drive hair cycling. Cell. 2011;146:761–771. doi: 10.1016/j.cell.2011.07.019. - DOI - PMC - PubMed
    1. Ito M, et al. Wnt-dependent de novo hair follicle regeneration in adult mouse skin after wounding. Nature. 2007;447:316–320. doi: 10.1038/nature05766. - DOI - PubMed
    1. Plikus MV, et al. Regeneration of fat cells from myofibroblasts during wound healing. Science. 2017;355:748–752. doi: 10.1126/science.aai8792. - DOI - PMC - PubMed

Publication types