. 2019 Feb 8;10(1):661.
doi: 10.1038/s41467-018-08087-9.

CIC protein instability contributes to tumorigenesis in glioblastoma

Affiliations

CIC protein instability contributes to tumorigenesis in glioblastoma

Severa Bunda et al. Nat Commun. .

Abstract

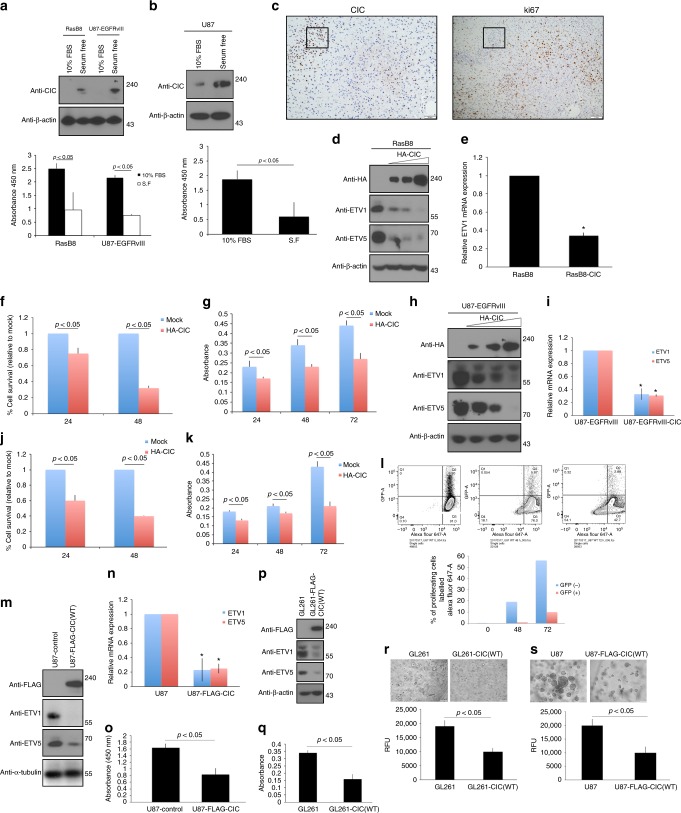
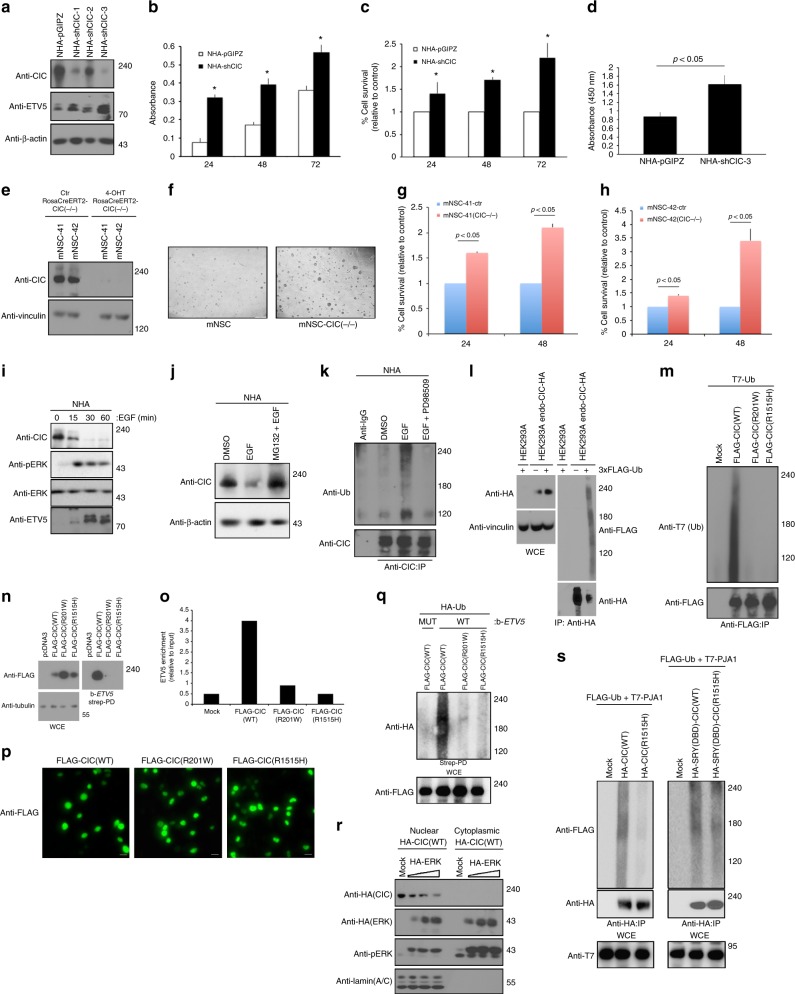
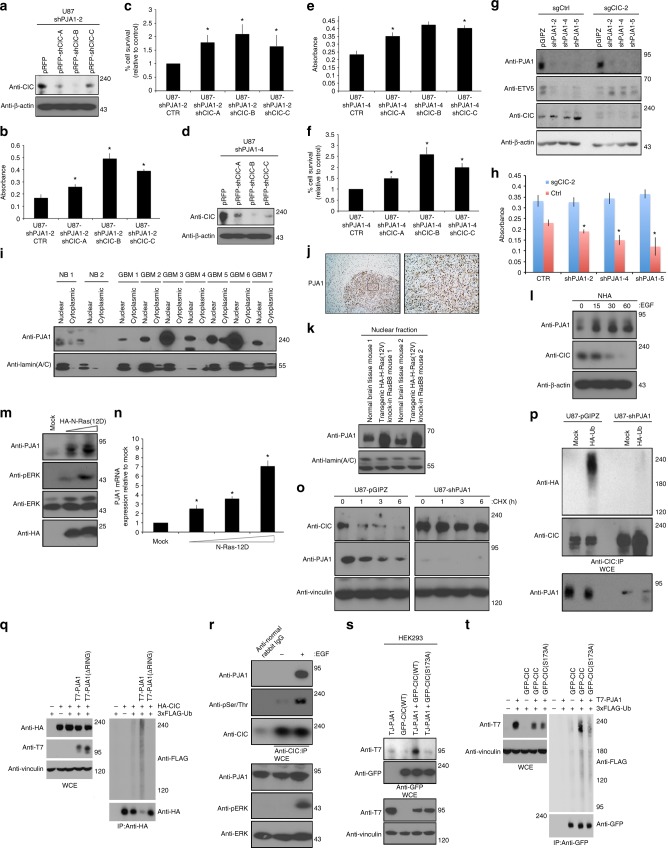
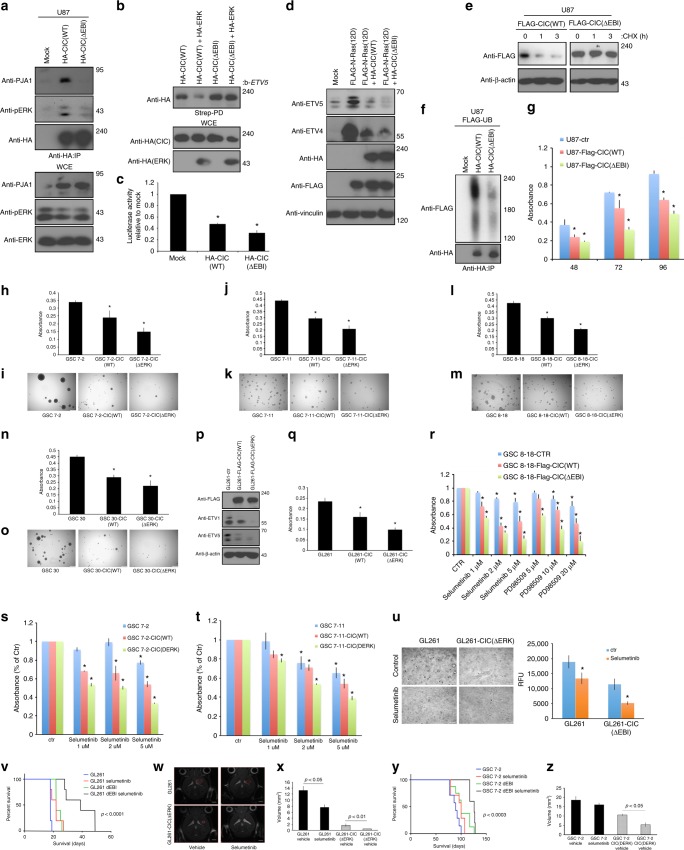
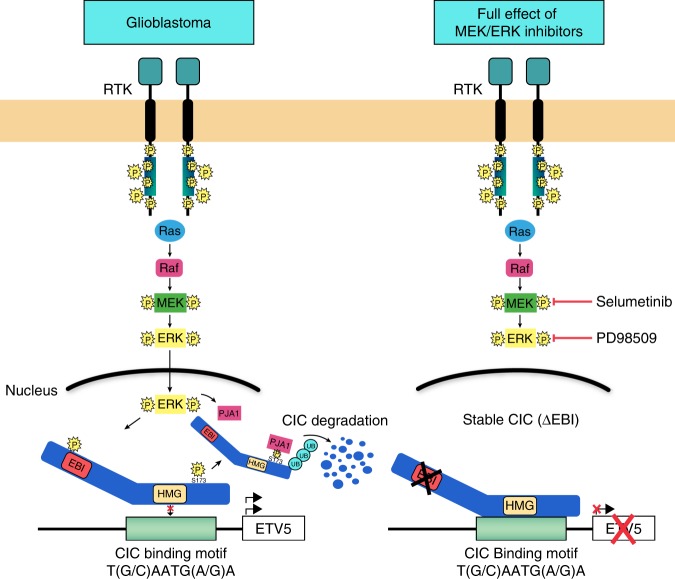
Capicua (CIC) is a transcriptional repressor that counteracts activation of genes downstream of receptor tyrosine kinase (RTK)/Ras/ERK signaling. It is well-established that tumorigenesis, especially in glioblastoma (GBM), is attributed to hyperactive RTK/Ras/ERK signaling. While CIC is mutated in other tumors, here we show that CIC has a tumor suppressive function in GBM through an alternative mechanism. We find that CIC protein levels are negligible in GBM due to continuous proteasome-mediated degradation, which is mediated by the E3 ligase PJA1 and show that this occurs through binding of CIC to its DNA target and phosphorylation on residue S173. PJA1 knockdown increased CIC stability and extended survival using in-vivo models of GBM. Deletion of the ERK binding site resulted in stabilization of CIC and increased therapeutic efficacy of ERK inhibition in GBM models. Our results provide a rationale to target CIC degradation in Ras/ERK-driven tumors, including GBM, to increase efficacy of ERK inhibitors.


Conflict of interest statement

The authors declare no competing interests.

Figures

Fig. 1
Fig. 1
Expression of CIC and its targets in human GBM tumors and cells. Human operative GBM samples or normal derived brains (NB) were lysed and a immunoblotted with indicated antibodies b or total RNA extracted and quantitative real-time PCR analysis was carried out using TaqMan gene expression assays. The graph depicts fold changes in CIC expression relative to normal brain. c Nuclear or cytoplasmic lysates were isolated from human operative GBM samples or normal brain and were immunoblotted with indicated antibodies. d Human operative astrocytoma samples were lysed and immunoblotted with indicated antibodies. Human-derived GBM cell lines or normal human astrocytes (NHA) were lysed and e protein lysates were immunoblotted with indicated antibodies (f) or total RNA extracted and quantitative real-time PCR analysis was carried out using TaqMan gene expression assays. The graph depicts fold changes in CIC expression relative to NHA. Data represent mean ± s.e.m. of three independent experiments performed in triplicate. *P < 0.05 Student’s t-test compared with NHA. g GL261 cells or normal mouse astrocytes were lysed and protein lysates were immunoblotted with indicated antibodies. Glioma stem cells (GSCs) were lysed and h protein lysates were immunoblotted with indicated antibodies (i) or total RNA extracted and quantitative real-time PCR analysis was carried out using TaqMan gene expression assays. The graph depicts fold changes in CIC expression relative to normal neural stem cells (NSC). Data represent mean ± s.e.m. of three independent experiments performed in triplicate. *P < 0.05 Student’s t-test compared with NSC. Representative images of hematoxylin and eosin (H&E) staining and immunohistochemistry using anti-CIC antibody of sections obtained from brains of intracranial xenograft (j) (GSC (8-18)) scale bar, 1 mm, or k GL261 mice scale bar, 500 μm. l Tumors or unaffected normal brains obtained from intracranial U87 xenograft were lysed and protein lysates were immunoblotted with indicated antibodies. m High-grade tumors obtained from two different oncogenic HA-H-Ras(12 V) knock-in RasB8 transgenic mice or from two different normal tissue obtained from wild-type background mice were lysed and protein lysates were immunoblotted with indicated antibodies. The immunoblot data are representative of at least three separate experiments
Fig. 2
Fig. 2
IC overexpression and cell proliferation. a RasB8, U87-EGFRvIII or b U87 were either serum-starved or maintained in 10% FBS, lysed and immunoblotted with indicated antibodies (top panel) or BrdU incorporation assay conducted (bottom panel). c Representative immunohistochemistry images using anti-Ki67 (scale bar, 500 μm) or anti-CIC (scale bar, 1 mm) antibody of high-grade tumors from RasB8 transgenic mice. d RasB8 transfected with or without increasing HA-CIC plasmid lysed and immunoblotted with indicated antibodies. e Quantitative real-time PCR analysis of RasB8 transfected with or without HA-CIC. The graph depicts fold changes in ETV1 expression relative to control. RasB8 transfected with or without HA-CIC plated equally plated and cell viability was assessed at indicated time points (in hours) by trypan blue exclusion or f alamar blue assay (g). h U87-EGFRvIII transfected with or without increasing concentrations of HA-CIC lysed and protein immunoblotted with indicated antibodies. i Quantitative real-time PCR analysis of U87-EGFRvIII transfected with or without HA-CIC. The graph depicts fold changes in ETV1 or -5 expression relative to control. U87-EGFRvIII transfected with or without HA-CIC plated equally and cell viability assessed at indicated time points (in hours) by trypan blue exclusion or j alamar blue assay k. l U87-EGFRvIII transfected with GFP-CIC labeled with eFluor 670 proliferation dye analyzed by flow cytometry. Graphs depict percentage of proliferating GFP-positive versus GFP-negative cells within the same population. Data are representative of at least three independent experiments. U87-Flag-CIC or control cells lysed and m protein lysates immunoblotted with indicated antibodies, n quantitative real-time PCR analysis conducted assessing ETV- or -5 expression or o BrdU incorporation assay. GL261-Flag-CIC or controls were lysed and p immunoblotted with indicated antibodies or q BrdU incorporation assay conducted. Anchorage-independent growth assay of GL261 (r) or U87 (s) cells expressing Flag-CIC showing fold changes relative to control (bottom panel) or phase contrast microscopy images (top panel). All graphs represent mean ± s.e.m. of three independent experiments performed either in octuplet for viability assays or in triplicate for real-time analysis. *P < 0.05 Student’s t-test compared with control. The immunoblot data are representative of at least three separate experiments
Fig. 3
Fig. 3
CIC knockdown, nuclear localization and ERK-mediated proteasomal degradation. a NHA-shCIC-1, 2 or 3 were lysed and immunoblotted with indicated antibodies. b Alamar blue, c trypan blue exclusion or d BrdU incorporation assay of NHA-shCIC-3 or control cells. mNSC-RosaCreERT2-CIC(−/−)-41 or (−/−)42 treated with or without 1 μM 4-OHT lysed and e immunoblotted with indicated antibodies or f imaged following 7 days in culture. Scale bar, 2 mm. Alamar blue assay of g mNSC-RosaCreERT2-CIC(−/−)-41 or h -42 cells treated with or without 1 μM 4-OHT. i NHA treated with or without EGF lysed and immunoblotted with indicated antibodies. j NHA pre-treated with MG132 or treated with or without EGF lysed and immunoblotted with indicated antibodies. k NHA pre-treated with MG132 prior to 1 h PD98509 pre-treatment, in the presence or absence of EGF lysed and IP with anti-CIC antibody or with anti-normal rabbit IgG and immunoblotted with indicated antibodies. l HEK293 endogenously tagged HA-CIC transfected with indicated plasmids pre-treated with MG132 prior to EGF treatment were lysed and a denaturing IP using anti-HA antibody was performed. m HEK293 transfected cells pre-treated with MG132 prior to EGF treatment were lysed and IP with anti-Flag antibody. n HEK293 transfected cells were lysed and incubated with Streptavidin agarose bound to biotinylated ETV5 oligonucleotides octameric motif followed by immunoblotting. o ChIP followed by quantitative PCR on the ETV5 promoter of HEK293 transfected cells. Graphs depict amount of ETV5 promoter enriched relative to input. p Immunofluorescence microscopy using anti-FLAG antibody of HEK293 cells transfected with indicated plasmids. Scale bar, 100 μm. q HEK293 transfected cells pre-treated with MG132 prior to EGF treatment lysed and Streptavidin agarose bound to either mutant (MUT) or wild type (WT) biotinylated ETV5 oligonucleotides octameric motif assay was performed. r Nuclear or cytoplasmic lysates of HEK293 cells transfected with increasing HA-ERK plasmid immunoblotted with indicated antibodies. s HEK293 transfected cells pre-treated with MG132 prior to EGF treatment were lysed IP with anti-HA antibody. IP Immunoprecipitated, strep-PD Streptavidin pull down, WCE whole-cell extract, Ub ubiquitin. Data represent mean ± s.e.m. of three independent experiments performed in octuplet. *P < 0.05 Student’s t-test compared with control
Fig. 4
Fig. 4
Effects of ERK inhibition and PJA1 in vitro and in vivo. a NHA b U87-Flag-CIC or c RasB8 treated with or without cycloheximide (CHX) lysed and immunoblotted with indicated antibodies. d U87-Flag-CIC or e RasB8 treated with or without PD98509 (1 h) or MG132 (4 h) lysed and immunoblotted with indicated antibodies. f U87-Flag-CIC transfected cells pre-treated with MG132, lysed and IP with anti-Flag antibody. Tumors of vehicle or selumetinib treated U87 xenograft mice lysed and g immunoblotted with antibodies or h real-time PCR analysis assessing CIC expression. i Kaplan–Meier survival curves of vehicle or selumetinib treated U87 xenograft mice. Log-rank statistics. Eight-week-old mice, n = 7 per group. U87-shPJA1-(1-5) were j lysed and immunoblotted with antibodies or k trypan blue exclusion assay conducted. GL261-shPJA1-1/2 or control l lysed and immunoblotted with antibodies or m alamar blue assay conducted. GSC 7-2-shPJA1-(1-4) or control (n) lysed and immunoblotted with antibodies or o alamar blue assay conducted. GSC 8-18-shPJA1-(1-5) (p) lysed and immunoblotted with antibodies or q alamar blue assay conducted. GSC 7-11-shPJA1-(1-4) (r) lysed and immunoblotted with indicated antibodies or s alamar blue assay conducted. t Kaplan–Meier survival curves of U87-shPJA1-2 or control xenograft mice. Log-rank statistics was performed. Eight-week-old mice, n = 10 per group. u Protein lysates of tumors from U87-shPJA1-2 or control xenograft mice. v Kaplan–Meier survival curves of GL261-shPJA1-1 or -1-2 xenograft mice. Log rank (Mantel–Cox) test, P < 0.001. Eight-week-old mice, n = 7 per group. T2 weighted anatomy MRI (w) imaged at 14 days post intracranial injections of GL261-shPJA1-1, -2 or controls (scale bar, 2 mm) or x quantified Student’s t-test (P = 0.0026, GL261 versus GL261-shPJA1-1) and (P = 0.0001, GL261 versus GL261-shPJA1-2). Eight-week-old mice, n = 7 per group. y Immunohistochemistry images using anti-PJA1 or -CIC antibody of tumors from GL261-shPJA1-1, -2 or control intracranial xenografts. Scale bar, 20 μm. IP Immunoprecipitated, WCE whole-cell extract. All graphs represent mean ± s.e.m. of three independent experiments performed either in octuplet for viability assays or in triplicate for real-time analysis. *P < 0.05 Student’s t-test compared with control. The immunoblot data are representative of at least three separate experiments
Fig. 5
Fig. 5
PJA1 mediates proteasomal degradation of CIC. U87-shPJA1-2-pRFP-shCIC-A/B/C were (a) lysed and immunoblotted with indicated antibodies or b alamar blue assay or c trypan blue exclusion assay conducted. U87-shPJA1-4-pRFP-shCIC-A/B/C was d lysed and immunoblotted with indicated antibodies or e alamar blue or f trypan blue exclusion assay conducted. CIC-null HEK93 cells, single guide (sgCIC-2) or control cells infected with shPJA1-2, -4 or -5 clones were lysed and g immunoblotted with indicated antibodies or h alamar blue exclusion assay conducted. i Nuclear or cytoplasmic lysates from human GBM or normal brains (NB) were immunoblotted. j Immunohistochemistry using anti-PJA1 antibody of U87 intracranial xenograft brains, low (scale bar, 200 μmDispase, DNAse and Pap) or high (scale bar, 50 μm) power images. k Nuclear lysates of high-grade RasB8 transgenic or wild-type mice immunoblotted with antibodies. l NHA treated with or without EGF lysed and immunoblotted with indicated antibodies. m HEK293 cells transfected with indicated plasmids were n lysed and immunoblotted with indicated antibodies or o real-time PCR analysis of PJA1 expression was done. p U87-shPJA1-2 or control cells treated with or without 100 μg/ml cycloheximide (CHX) lysed and immunoblotted with indicated antibodies. q U87-shPJA1-2 or control cells transfected with indicated plasmids, pre-treated with MG132 prior to 30 min EGF treatment were lysed and IP with anti-CIC antibody. r HEK293 cells transfected with indicated plasmids pre-treated with MG132 prior to 30 min EGF treatment were lysed and a denaturing IP using anti-HA antibody was performed. s HEK293 cells transfected with indicated plasmids were lysed and IP using anti-GFP antibody followed by immunoblotting with indicated antibodies. t HEK293 cells transfected with indicated plasmids pre-treated with MG132 or 30 min EGF treatment were lysed and a immunoprecipitation (IP) using anti-GFP antibody. UB Ubiquitin, WCE whole-cell extract, IP immunoprecipitated. Graphs represent mean ± s.e.m. of three independent experiments performed either in octuplet for viability assays or in triplicate for real-time analysis. *P < 0.05 Student’s t-test versus control. The immunoblot data are representative of at least three separate experiments
Fig. 6
Fig. 6
Effect of stable CIC on its function and ERK inhibition. a U87 transfected with indicated plasmids lysed and IP with anti-HA antibody. b HEK293 transfected cells lysed and Streptavidin agarose bound to biotinylated ETV5 oligonucleotide octameric motif pull-down assay was conducted. c Luciferase activity of HEK293 transfected cells, pGL3-ETV5 plasmid normalized to control. d HEK293 transfected cells lysed and immunoblotted with antibodies. e U87-HA-CIC or -CIC(ΔEBI) treated with or without cycloheximide lysed and immunoblotted with indicated antibodies. f U87 transfected cells lysed and IP with anti-HA antibody. g Alamar blue assay of U87-Flag-CIC, -CIC(ΔEBI) or control cells. Alamar blue assay of GSC h 7-2-, j 7-11-, l 8-11- or n 30-Flag-CIC, -CIC(ΔEBI) or controls cells. Representative images of 14 day old GSC i 7-2- k 7-11-, m 8-11- or o 30-Flag-CIC, -CIC(ΔEBI) or control cultures. Scale bar, 2 mm. GL261-Flag-CIC, -CIC(ΔEBI) or controls were p lysed and immunoblotted with indicated antibodies or q alamar blue assay conducted. r Alamar blue assay of GSC 8-18-Flag-CIC, -CIC(ΔEBI) or controls treated with or without DMSO, PD98509 or selumetinib. Alamar blue assay of GSC s 7-2- or t 7-11-Flag-CIC, -CIC(ΔEBI) or controls treated with or without DMSO or selumetinib. Anchorage-independent growth assay was u imaged (left) or quantified (right) of selumetinib treated GL261-Flag-CIC(ΔEBI). Scale bar, 200 μm. v Kaplan–Meier survival curves of selumetinib treated (7 days post injections) GL261-Flag-CIC(ΔEBI) or control xenograft mice. Log rank (Mantel–Cox) test, P < 0.0001. Eight-week-old mice, n = 7. T2 weighted anatomy MRI was w imaged 14 day post GL261-Flag-CIC(ΔEBI) injections (scale bar 2 mm) or x tumor volume quantified. y Kaplan–Meier survival curves of GSC 7-2-Flag-CIC(ΔEBI) mice treated with vehicle or selumetinib 7 days post injections. Log rank (Mantel–Cox) test, P < 0.0003. Eight-week-old mice, n = 7. z Quantitative T2 weighted anatomy MRI images of GSC 7-2-Flag-CIC(ΔEBI) or control mice treated with selumetinib 7 days post injections. Scale bar, 2 mm. WCE Whole-cell extract, strep-PD Streptavidin pull down, IP immunoprecipitated. Graphs represent mean ± s.e.m. of three independent experiments performed in octuplet for viability assays or in triplicate for real-time, luciferase or anchorage-independent growth assay. *P < 0.05 Student’s t-test versus control
Fig. 7
Fig. 7
A model depicting CIC regulation in GBM and effect of the loss of CIC’s ERK-binding domain on sensitivity to ERK inhibitors

References

    1. Taylor TE, Furnari FB, Cavenee WK. Targeting EGFR for treatment of glioblastoma: molecular basis to overcome resistance. Curr. Cancer Drug Targets. 2012;12:197–209. - PMC - PubMed
    1. Dunn GP, et al. Emerging insights into the molecular and cellular basis of glioblastoma. Genes & Dev. 2012;26:756–784. - PMC - PubMed
    1. Diamandis P, Aldape KD. Insights from molecular profiling of adult glioma. J. Clin. Oncol. 2017;35:2386–2393. - PubMed
    1. Samatar AA, Poulikakos PI. Targeting RAS-ERK signalling in cancer: promises and challenges. Nat. Rev. Drug Discov. 2014;13:928–942. - PubMed
    1. Jimenez G, Shvartsman SY, Paroush Z. The Capicua repressor—a general sensor of RTK signaling in development and disease. J. Cell. Sci. 2012;125:1383–1391. - PMC - PubMed

Publication types

MeSH terms