. 2019 Feb 8;10(1):662.
doi: 10.1038/s41467-019-08607-1.

Growth hormone regulates neuroendocrine responses to weight loss via AgRP neurons

Affiliations

Growth hormone regulates neuroendocrine responses to weight loss via AgRP neurons

Isadora C Furigo et al. Nat Commun. .

Erratum in

Abstract

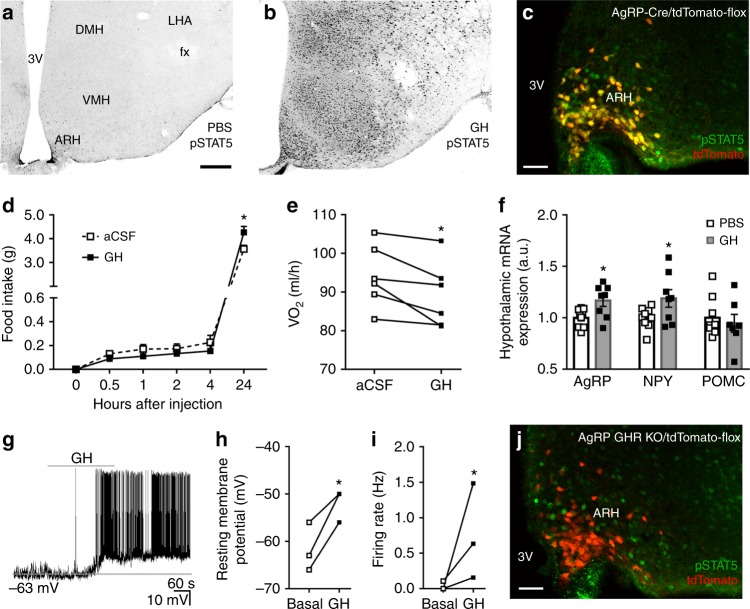
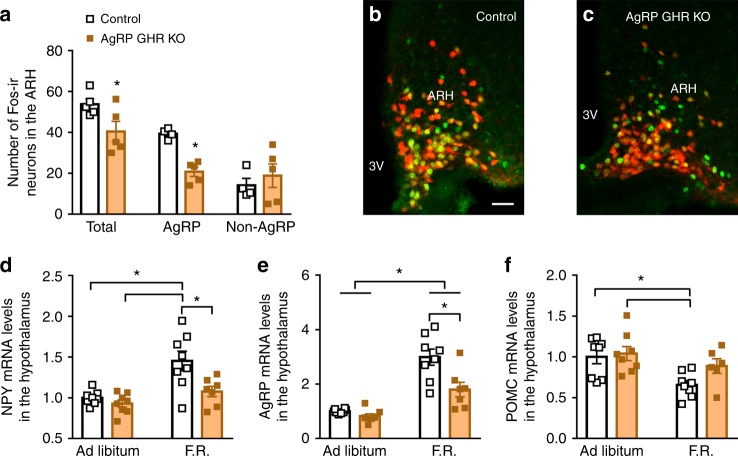
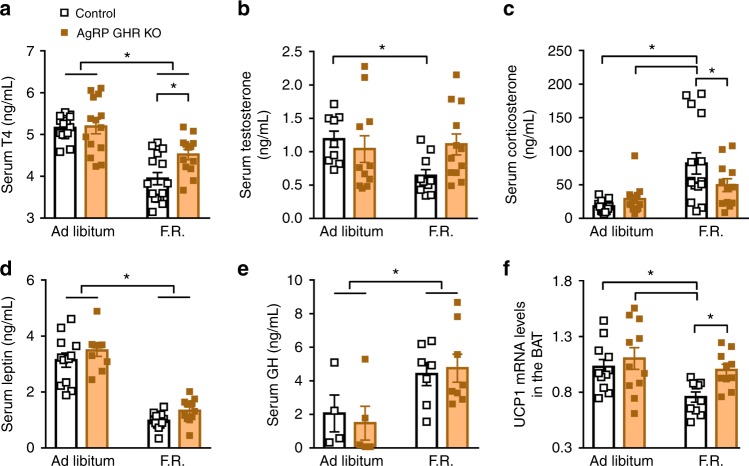
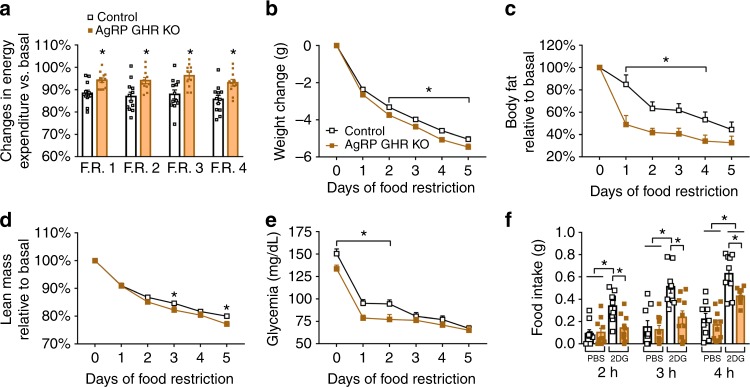
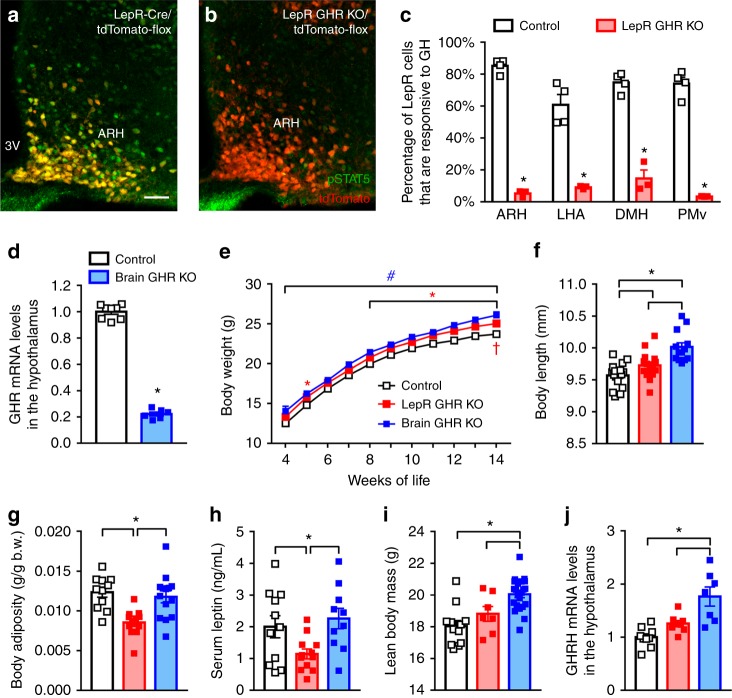
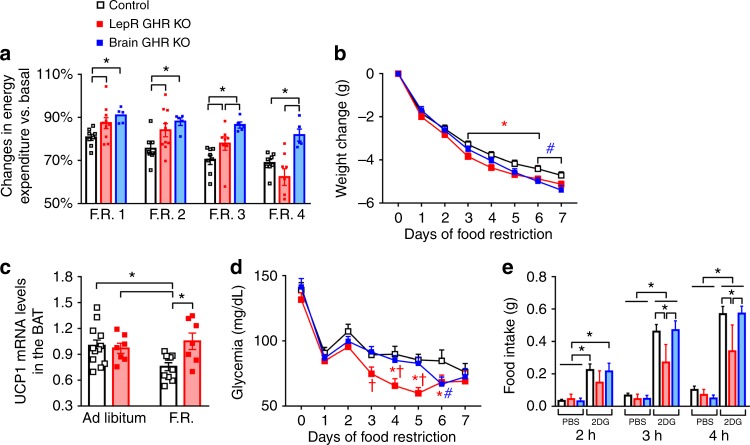
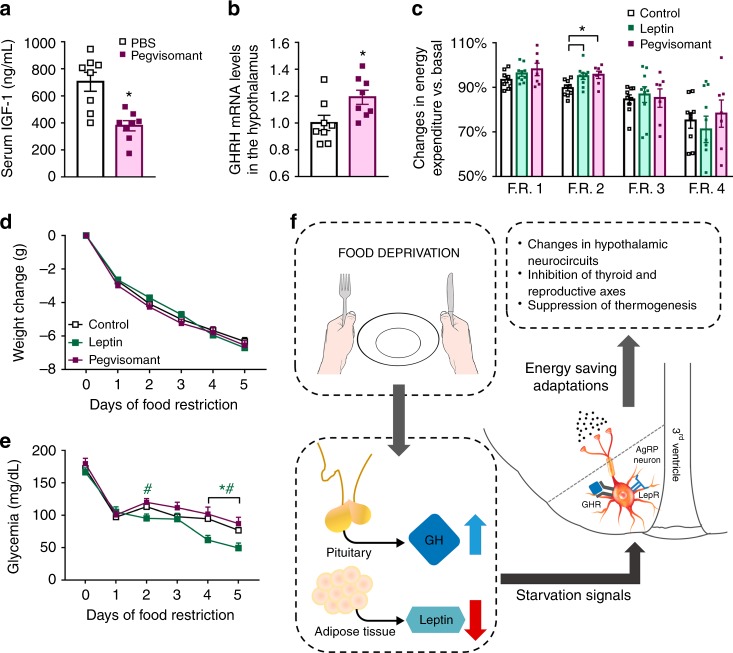
Weight loss triggers important metabolic responses to conserve energy, especially via the fall in leptin levels. Consequently, weight loss becomes increasingly difficult with weight regain commonly occurring in most dieters. Here we show that central growth hormone (GH) signaling also promotes neuroendocrine adaptations during food deprivation. GH activates agouti-related protein (AgRP) neurons and GH receptor (GHR) ablation in AgRP cells mitigates highly characteristic hypothalamic and metabolic adaptations induced by weight loss. Thus, the capacity of mice carrying an AgRP-specific GHR ablation to save energy during food deprivation is impaired, leading to increased fat loss. Additionally, administration of a clinically available GHR antagonist (pegvisomant) attenuates the fall of whole-body energy expenditure of food-deprived mice, similarly as seen by leptin treatment. Our findings indicate GH as a starvation signal that alerts the brain about energy deficiency, triggering key adaptive responses to conserve limited fuel stores.


Conflict of interest statement

J.D. is recipient of the 2017 Global ASPIRE Young Investigator Research Awards in Endocrinology supported by Pfizer, Inc. The remaining authors declare no competing interests.

Figures

Fig. 1
Fig. 1
Orexigenic effect of growth hormone (GH) via activation of agouti-related protein (AgRP) neurons. a, b Photomicrographs showing the hypothalamic distribution of signal transducer and activator of transcription 5 (STAT5) phosphorylation (pSTAT5) 90 min after an intraperitoneal (i.p.) injection of phosphate-buffered saline (PBS) or porcine GH (20 µg/g body weight (b.w.)). 3V third ventricle, ARH arcuate nucleus, DMH dorsomedial nucleus, fx fornix, LHA lateral hypothalamic area, VMH ventromedial nucleus. Scale Bar = 200 µm. c More than 90% of AgRP neurons (red) in the ARH are responsive to porcine GH as indicated by the co-expression of pSTAT5 (green). Yellow represents double-labeled cells. Scale Bar = 50 µm. d Intracerebroventricular (i.c.v.) infusion of porcine GH (6 µg in 2 µL) increased food intake (0.5 h: t(8) = 1.258, P = 0.244; 1 h: t(8) = 2.075, P = 0.0717; 2 h: t(8) = 1.425, P = 0.1919; 4 h: t(8) = 1.518, P = 0.1675; 24 h: t(8) = 2.801, P = 0.0232; n = 9), compared to the infusion of artificial cerebrospinal fluid (aCSF). e The i.c.v. infusion of porcine GH reduced energy expenditure (t(5) = 3.193, P = 0.0242, n = 6; paired t-test) of C57BL/6 mice. f Hypothalamic gene expression in C57BL/6 mice that received i.p. infusion of either PBS or porcine GH (AgRP: t(15) = 2.723, P = 0.0157; neuropeptide Y (NPY): t(15) = 2.144, P = 0.0488; proopiomelanocortin (POMC): t(14) = 0.5188, P = 0.612; n = 9; unpaired t-test). g Representative whole-cell patch-clamp recording of a GH responsive AgRP neuron. Dashed line indicates the resting membrane potential. Porcine GH (5 µg/mL) was applied to the bath for approximately 5 min. hi Increased resting membrane potential (t(2) = 4.768, P = 0.0413; paired t-test) and firing rate (t(2) = 3.001, P = 0.0477; paired t-test) of GH-responsive AgRP neurons (n = 3). j AgRP growth hormone receptor knockout (GHR KO) mice showed very few GH-induced pSTAT5 (green) in AgRP neurons (red). Scale Bar = 50 µm. All results were expressed as mean ± s.e.m. *P < 0.05
Fig. 2
Fig. 2
Hypothalamic changes induced by weight loss are attenuated in agouti-related protein (AgRP) growth hormone receptor knockout (GHR KO) mice. a AgRP GHR KO mice show reduced number of c-Fos-positive cells after 24 h of fasting in the arcuate nucleus (ARH) (t(8) = 2.348, P = 0.0443, n = 5) and in AgRP neurons (t(7) = 6.62, P = 0.0003), but not in non-AgRP cells (t(7) = 0.6529, P = 0.5347). b, c Representative photomicrographs showing fasting-induced c-Fos expression (green) and the co-localization with AgRP neurons (red). Scale Bar = 50 µm. d Hypothalamic mRNA expression of neuropeptide Y (NPY) (main effect of food restriction (F.R.) [F(1, 27) = 16.44, P= 0.0004], main effect of GHR ablation [F(1, 27) = 9.036, P= 0.0057] and interaction [F(1, 27) = 4.215, P= 0.0499]; n = 7–8). e Hypothalamic mRNA expression of AgRP (main effect of F.R. [F(1, 27) = 54.67, P < 0.0001], main effect of GHR ablation [F(1, 27) = 11.64, P= 0.002] and interaction [F(1, 27) = 6.417, P= 0.0174]; n = 7–8). f Hypothalamic mRNA expression of proopiomelanocortin (POMC) (main effect of F.R. [F(1, 26) = 9.582, P= 0.0047], main effect of GHR ablation [F(1, 26) = 2.813, P= 0.1055] and interaction [F(1, 26) = 1.399, P= 0.2476]; n = 6–8). The effects of F.R. were analyzed by two-way analysis of variance (ANOVA). All results were expressed as mean ± s.e.m. *P < 0.05
Fig. 3
Fig. 3
Neuroendocrine changes induced by weight loss are attenuated in agouti-related protein (AgRP) growth hormone receptor knockout (GHR KO) mice. a Serum concentration of T4 (main effect of food restriction (F.R.) [F(1, 53) = 46.18, P < 0.0001], main effect of GHR ablation [F(1, 53) = 2.796, P= 0.1004] and interaction [F(1, 53) = 4.953, P= 0.0303]). b Serum concentration of testosterone (main effect of F.R. [F(1, 38) = 2.36, P= 0.1327], main effect of GHR ablation [F(1, 38) = 1.086, P= 0.3039] and interaction [F(1, 38) = 3.949, P= 0.0541]). c Serum concentration of corticosterone (main effect of F.R. [F(1, 49) = 16.13, P= 0.0002], main effect of GHR ablation [F(1, 49) = 1.072, P= 0.3055] and interaction [F(1, 49) = 4.13, P= 0.0476]). d Serum concentration of leptin (main effect of F.R. [F(1, 41) = 140.3, P< 0.0001], main effect of GHR ablation [F(1, 41) = 3.803, P= 0.058] and interaction [F(1, 41) = 0.0023, P= 0.9617]). e Serum concentration of growth hormone (GH (main effect of F.R. [F(1, 20) = 9.486, P= 0.0059], main effect of GHR ablation [F(1, 20) = 0.0157, P= 0.9013] and interaction [F(1, 20) = 0.2558, P= 0.6186]). f UCP-1 mRNA expression in the interscapular brown adipose tissue (BAT; main effect of F.R. [F(1, 38) = 7.158, P= 0.0109], main effect of GHR ablation [F(1, 38) = 5.196, P= 0.0283] and interaction [F(1, 38) = 1.449, P= 0.2361]; n = 11–15). The data were analyzed by two-way analysis of variance (ANOVA). All results were expressed as mean ± s.e.m. *P < 0.05
Fig. 4
Fig. 4
Energy-conserving effects of growth hormone (GH) signaling in agouti-related protein (AgRP) neurons. a Reduction in energy expenditure (VO2) during food restriction (F.R.) compared to baseline (F.R. 1, t(22) = 3.296, P = 0.0033; F.R. 2, t(21) = 2.913, P = 0.0083; F.R. 3, t(21) = 3.223, P = 0.0041; F.R. 4, t(21) = 3.144, P = 0.0049; n = 11–12; unpaired t-test). b Changes in body weight (main effect of F.R. [F(5, 225) = 1525, P < 0.0001], main effect of growth hormone receptor (GHR ablation [F(1, 45) = 7.077, P = 0.0108] and interaction [F(5, 225) = 3.251, P = 0.0074]; control = 25; AgRP GHR KO = 22). c Body fat mass (main effect of F.R. [F(5, 60) = 29.23, P < 0.0001], main effect of GHR ablation [F(1, 12) = 11.27, P = 0.0057] and interaction [F(5, 60) = 2.079, P = 0.0805]; control = 5; AgRP GHR KO = 9). d Lean body mass (main effect of F.R. [F(5, 60) = 526.9, P < 0.0001], main effect of GHR ablation [F(1, 12) = 3.429, P = 0.0888] and interaction [F(5, 60) = 3.026, P = 0.0168]). e Blood glucose changes during F.R. (main effect of time [F(5, 158) = 88.32, P < 0.0001], main effect of GHR ablation [F(1, 158) = 19.45, P < 0.0001] and interaction [F(5, 158) = 1.463, P= 0.205]; n = 14–15) and Fisher's least significant difference (LSD) post-hoc test (*P < 0.01). f Food intake after intraperitoneal (i.p.) injection of either phosphate-buffered saline (PBS) or 2-deoxi-d-glucose (2DG; 0.5 mg/kg body weight (b.w.); n = 9–10). The effects of F.R. or 2DG were analyzed by two-way analysis of variance (ANOVA). All results were expressed as mean ± s.e.m.
Fig. 5
Fig. 5
Consequences of growth hormone receptor (GHR) ablation in leptin receptor (LepR)-expressing cells or the entire brain. ac A high percentage of LepR neurons (red) in the arcuate nucleus (ARH; t(5) = 28.42, P < 0.0001), lateral hypothalamic area (LHA; t(5) = 6.777, P = 0.0011), dorsomedial nucleus (DMH; t(5) = 10.51, P = 0.0001) and ventral premammillary nucleus (PMv; t(5) = 14.6, P < 0.0001) is responsive to porcine growth hormone (GH) (20 µg/g body weight (b.w.)) in control mice (phosphorylation of signal transducer and activator of transcription 5 (pSTAT5), green), whereas very few pSTAT5 is observed in tdTomato cells of LepR GHR KO mice (n = 3–4; unpaired t-test). Yellow represents double-labeled cells. Scale Bar = 50 µm. d GHR mRNA expression in the hypothalamus of control and brain GHR KO mice (t(12) = 30.02, P < 0.0001, n = 6–8; unpaired t-test). e Body weight changes in control, LepR GHR KO and brain GHR KO mice (main effect of time [F(10, 1036) = 370.9, P < 0.0001], main effect of GHR ablation [F(2, 1036) = 76.28, P< 0.0001] and interaction [F(20, 1036) = 0.4301, P= 0.9867]; two-way analysis of variance (ANOVA); n = 14–20; *P < 0.05, LepR GHR KO vs. control mice; #P < 0.05, brain GHR KO vs. control mice; P < 0.05, LepR GHR KO vs. brain GHR KO mice). f Body length (F(2, 42) = 16.29, P < 0.0001, n = 13–17). g Body adiposity (F(2, 34) = 9.815, P = 0.0004, n = 11–14). h Serum leptin concentration (F(2, 30) = 4.477, P = 0.0199, n = 10–12/group). i Lean body mass (F(2, 38) = 13.17, P < 0.0001, n = 7–22/group). j Hypothalamic GHRH mRNA expression (F(2, 21) = 13.43, P = 0.0001, n = 7–9) of 6-month-old male mice. One-way ANOVA and the Newman–Keuls test were used when the data of control, LepR GHR KO and brain GHR KO mice were compared. All results were expressed as mean ± s.e.m.
Fig. 6
Fig. 6
Central ablation of growth hormone receptor (GHR) prevents energy-saving adaptations during food restriction (F.R.) a Reduction in energy expenditure (VO2) during the days of F.R. compared to baseline (F.R. 1, F(2, 20) = 4.792, P = 0.0199; F.R. 2, F(2, 20) = 4.707, P = 0.0212; F.R. 3, F(2, 18) = 8.695, P = 0.0023; F.R. 4, F(2, 18) = 9.151, P = 0.0018; n = 5–10). b Body weight changes during F.R. (main effect of F.R. [F(7, 315) = 1011, P < 0.0001], main effect of GHR ablation [F(2, 45) = 2.258, P= 0.1163] and interaction [F(14, 315) = 3.189, P = 0.0001]; n = 14–20; *P < 0.05, LepR GHR KO vs. control mice; #P < 0.05, brain GHR knockout (KO) vs. control mice; Fisher's least significant difference (LSD) post-hoc test). c UCP-1 mRNA expression in the brown adipose tissue (BAT; main effect of F.R. [F(1, 32) = 1.374, P = 0.2499], main effect of GHR ablation [F(2, 32) = 3.646, P= 0.0652] and interaction [F(2, 32) = 5.547, P= 0.0248]) of LepR GHR KO mice. d Blood glucose changes during F.R. (main effect of time [F(7, 315) = 65.76, P < 0.0001], main effect of GHR ablation [F(2, 45) = 4.866, P = 0.0122] and interaction [F(14, 315) = 1.491, P= 0.1125]) and Fisher's LSD post-hoc test (*P < 0.05, LepR GHR KO vs. control mice; #P < 0.05, brain GHR KO vs. control mice; P < 0.05, LepR GHR KO vs. brain GHR KO mice; n = 14–15). e Food intake after intraperitoneal (i.p.) injection of either phosphate-buffered saline (PBS) or 2-deoxi-d-glucose (2DG; 0.5 mg/kg body weight (b.w.); n = 6–14). One-way analysis of variance (ANOVA) and the Newman–Keuls test were used when the data of control, LepR GHR KO and brain GHR KO mice were compared. The changes in body weight and glycemia or the effects of 2DG were analyzed by two-way ANOVA. All results were expressed as mean ± s.e.m.
Fig. 7
Fig. 7
Pegvisomant produces energy-saving adaptations in food-deprived mice. a Serum insulin-like growth factor-1 (IGF-1) concentration (t(14) = 4.089, P = 0.0011; n = 8). b Hypothalamic growth hormone-releasing hormone (GHRH mRNA levels (t(14) = 2.452, P = 0.0279; n = 8). c Energy expenditure (food restriction (F.R.) 1, F(2, 23) = 1.83, P = 0.1829; F.R. 2, F(2, 23) = 5.396, P = 0.012; F.R. 3, F(2, 23) = 0.1271, P = 0.8813; F.R. 4, F(2, 23) = 0.4397, P = 0.6496; n = 7–10). d Body weight changes (main effect of F.R. [F(5, 125) = 1031, P < 0.0001], main effect of treatment [F(2, 25) = 0.3717, P= 0.1163] and interaction [F(10, 125) = 2.398, P = 0.0122]; n = 7–10). e Blood glucose levels (main effect of F.R. [F(5, 125) = 116.6, P < 0.0001], main effect of treatment [F(2, 25) = 4.747, P= 0.0179] and interaction [F(10, 125) = 2.966, P = 0.0022]; n = 8–10; *P < 0.05, leptin vs. phosphate-buffered saline (PBS) treatment; #P < 0.05, leptin vs. pegvisomant treatment; Fisher's least significant difference (LSD) post-hoc test). f Scheme summarizing our findings highlighting that growth hormone (GH), parallel to the fall in leptin levels, is a critical cue that informs the brain about energy deficiency, triggering key adaptive responses to conserve body energy stores via activation of agouti-related protein (AgRP) neurons. All results were expressed as mean ± s.e.m.

References

    1. Ahima RS, et al. Role of leptin in the neuroendocrine response to fasting. Nature. 1996;382:250–252. doi: 10.1038/382250a0. - DOI - PubMed
    1. Rosenbaum M, Murphy EM, Heymsfield SB, Matthews DE, Leibel RL. Low dose leptin administration reverses effects of sustained weight-reduction on energy expenditure and circulating concentrations of thyroid hormones. J. Clin. Endocrinol. Metab. 2002;87:2391–2394. doi: 10.1210/jcem.87.5.8628. - DOI - PubMed
    1. Chan JL, Heist K, DePaoli AM, Veldhuis JD, Mantzoros CS. The role of falling leptin levels in the neuroendocrine and metabolic adaptation to short-term starvation in healthy men. J. Clin. Invest. 2003;111:1409–1421. doi: 10.1172/JCI200317490. - DOI - PMC - PubMed
    1. Rosenbaum M, et al. Low-dose leptin reverses skeletal muscle, autonomic, and neuroendocrine adaptations to maintenance of reduced weight. J. Clin. Invest. 2005;115:3579–3586. doi: 10.1172/JCI25977. - DOI - PMC - PubMed
    1. Shetty GK, et al. Leptin administration to overweight and obese subjects for 6 months increases free leptin concentrations but does not alter circulating hormones of the thyroid and IGF axes during weight loss induced by a mild hypocaloric diet. Eur. J. Endocrinol. 2011;165:249–254. doi: 10.1530/EJE-11-0252. - DOI - PMC - PubMed

Publication types

MeSH terms

LinkOut - more resources