. 2019 Feb 8;10(1):687.
doi: 10.1038/s41467-019-08604-4.

Lymphocyte innateness defined by transcriptional states reflects a balance between proliferation and effector functions

Affiliations

Lymphocyte innateness defined by transcriptional states reflects a balance between proliferation and effector functions

Maria Gutierrez-Arcelus et al. Nat Commun. .

Abstract

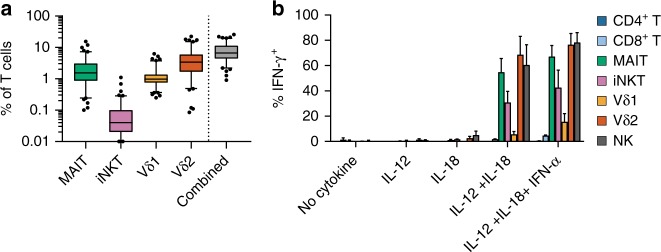
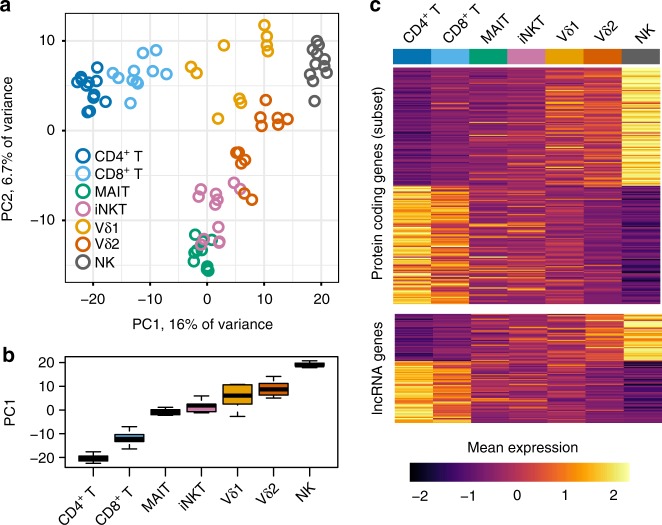
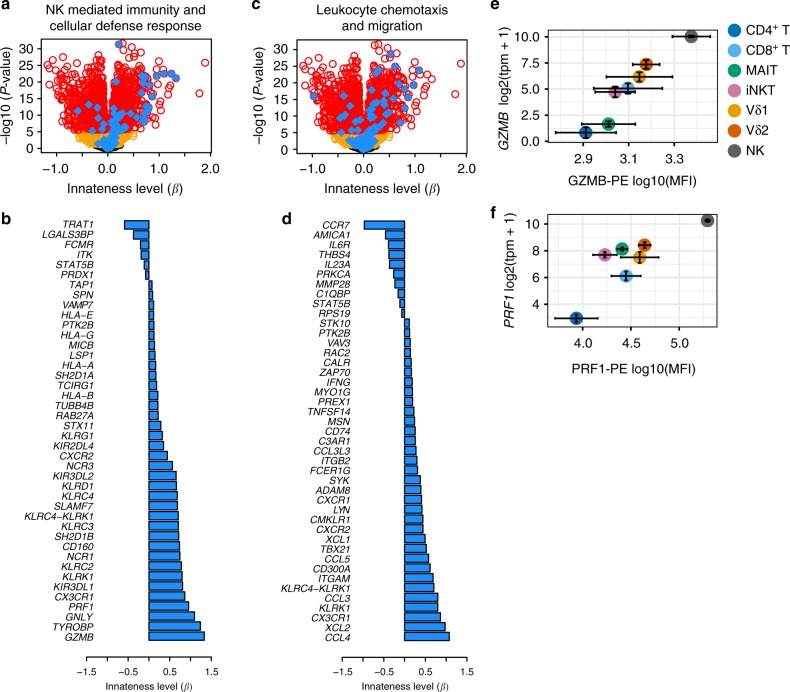
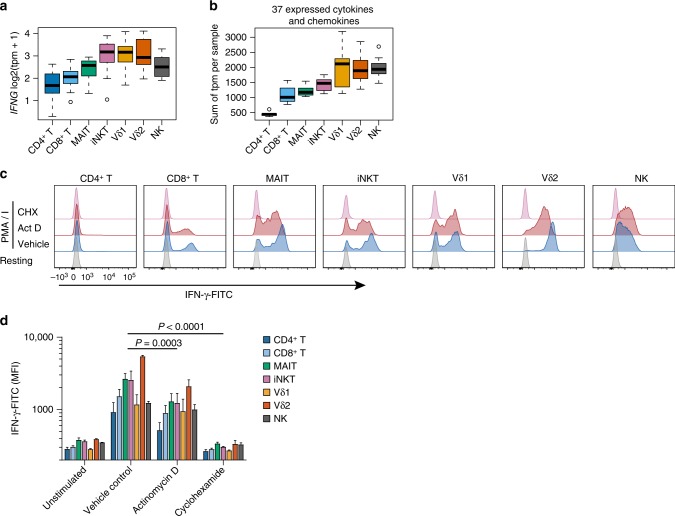
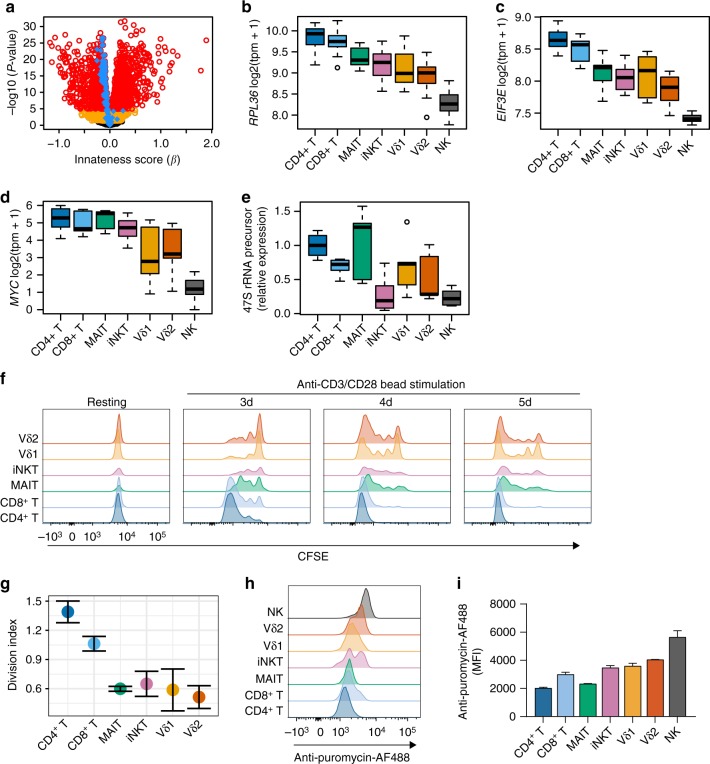
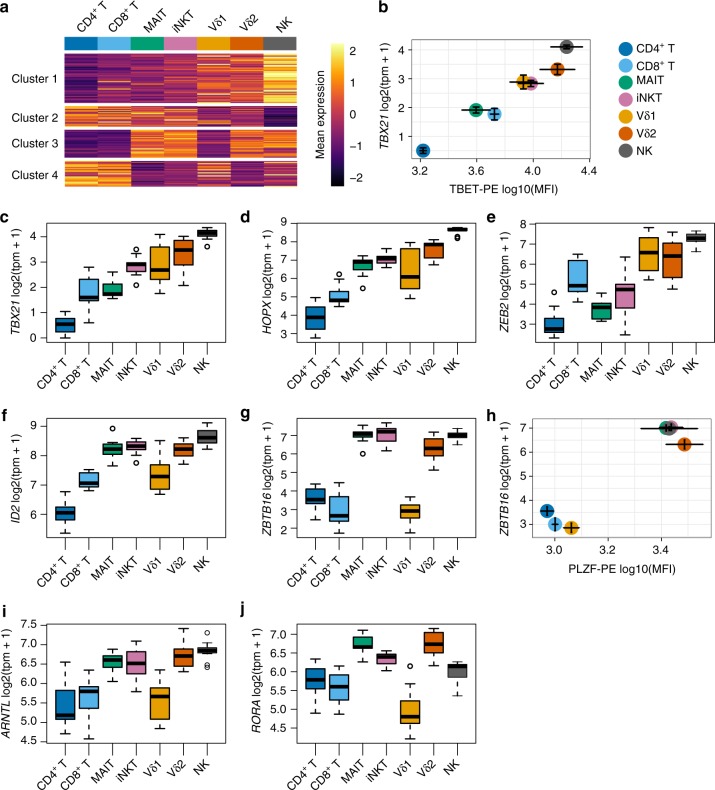
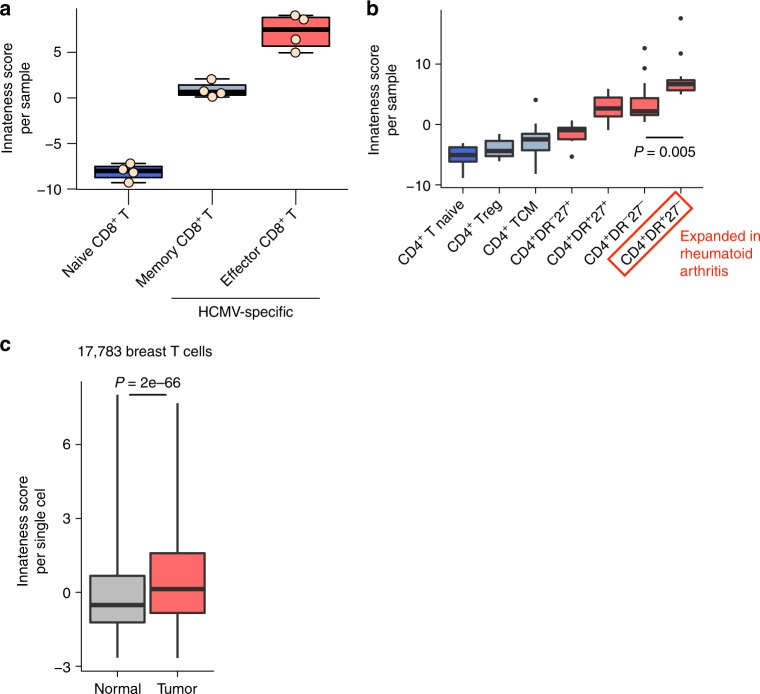
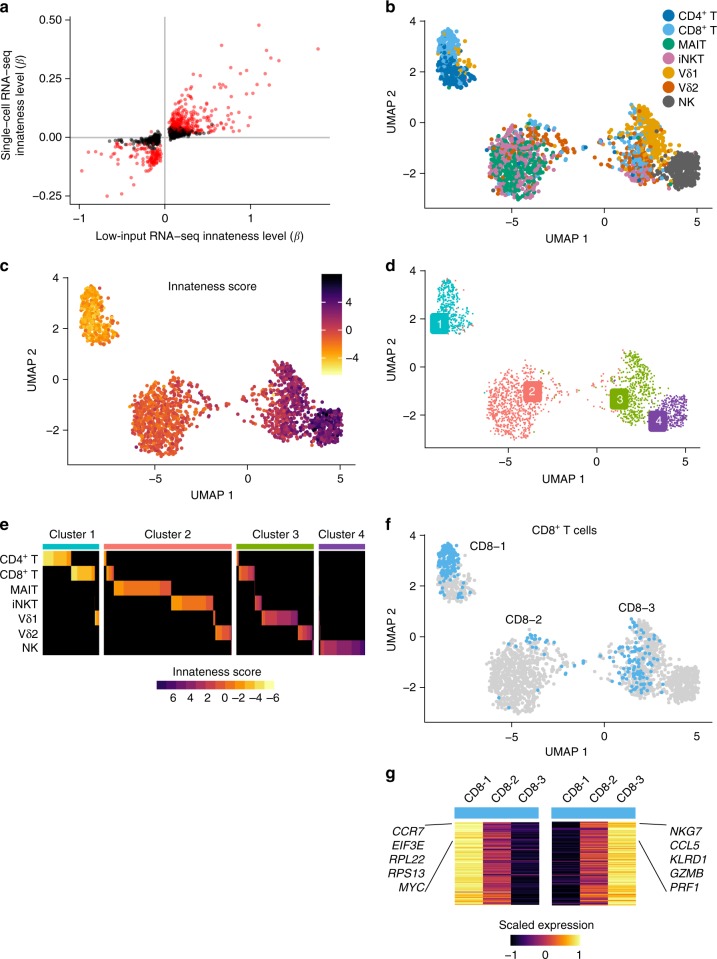
How innate T cells (ITC), including invariant natural killer T (iNKT) cells, mucosal-associated invariant T (MAIT) cells, and γδ T cells, maintain a poised effector state has been unclear. Here we address this question using low-input and single-cell RNA-seq of human lymphocyte populations. Unbiased transcriptomic analyses uncover a continuous 'innateness gradient', with adaptive T cells at one end, followed by MAIT, iNKT, γδ T and natural killer cells at the other end. Single-cell RNA-seq reveals four broad states of innateness, and heterogeneity within canonical innate and adaptive populations. Transcriptional and functional data show that innateness is characterized by pre-formed mRNA encoding effector functions, but impaired proliferation marked by decreased baseline expression of ribosomal genes. Together, our data shed new light on the poised state of ITC, in which innateness is defined by a transcriptionally-orchestrated trade-off between rapid cell growth and rapid effector function.


Conflict of interest statement

The authors declare no competing interests.

Figures

Fig. 1
Fig. 1
ITC immunophenotyping. a ITC were quantified in 101 healthy donors by flow cytometry. The “Combined” group represents the sum of iNKT, MAIT, Vδ1, and Vδ2 T cells. For boxplots, 5–95 percentile and outliers are shown. b Intracellular staining for IFN-γ production following cytokine stimulation without TCR activation, N = 3 independent donors, error is s.e.m.
Fig. 2
Fig. 2
Transcriptomic profiling of ITC reveals a continuous innateness gradient. a PCA performed on the top 1022 most variable (s.d. > 1.4) expressed genes. Plotted are scores for PC1 and PC2. b Distribution of PC1 scores by cell type. c Heatplot of mean expression by cell type for genes associated with innateness gradient. The upper panel shows top 100 positive and negative significant associations within protein-coding genes. The lower panel shows significant associations for 92 lncRNA genes. Genes within each heatplot were sorted by β. Gene expression level was scaled by row. N = 6 donors, 1–2 replicates per cell type. Boxplots are described in Methods
Fig. 3
Fig. 3
Genes and pathways associated with innateness. a Volcano plot showing associations with the innateness gradient. Yellow, genes with P < 0.05; red, genes with P < 2.5e–06 (Bonferroni threshold); blue, genes with GO terms involving NK-mediated immunity and cellular defense response (GO:0006968, GO:0002228). b Innateness level (β) for individual genes in a with P < 2.5e–06. c As in a but with blue showing genes from GO terms involving leukocyte chemotaxis and migration (GO:2000501, GO:0035747, GO:1901623, GO:0030595, GO:2000401, GO:0097530, GO:0097529, GO:0048247, GO:0072676, GO:1990266). d Innateness level (β) for individual genes in c with P < 2.5e–06. e GZMB and f PRF1 flow-cytometric validation, showing protein levels (x-axis), and transcript levels with RNA-seq (y-axis)
Fig. 4
Fig. 4
Cytokine and chemokine mRNA in ITC. a Distribution of IFNG transcript levels across all samples. b Sum of expression levels (tpm) for 37 cytokine and chemokine genes across all samples, per cell type. tpm, N = 6; Boxplots are described in Methods. Histogram overlays are normalized to mode. c Representative flow cytometry plots for IFN-γ intracellular staining 2 h after activation in the presence of cyclohexamide to block transcription or actinomycin D to block translation. d As in c, with MFI shown for N = 3, error is s.e.m., P-value is paired t test
Fig. 5
Fig. 5
Reduced ribosome transcripts and proliferation in ITC. a Volcano plot showing results of associations with the innateness gradient. Yellow, genes with P < 0.05; red, genes with P < 2.5e–06 (Bonferroni threshold); blue, GO term cytosolic ribosome (GO:0022626). Distribution by cell type for transcript levels of b ribosomal protein RPL36, c translation initiation factor EIF3E, and d MYC (N=6). e qPCR for 47 S rRNA precursor from sorted cell populations (N = 3). Expression shown is relative to HPRT, and normalized to CD4+ T cells for comparison between samples. f PBMCs were labeled with CFSE and then cultured with anti-CD3/CD28-coated beads before staining with markers to identify ITC populations, g division index shown at day 3 (N = 3, s.e.m.). Ribopuromycylation in PBMCs to quantify total translational activity measured by flow cytometry, h representative plot, and i N = 3, s.e.m. Boxplots are described in Methods. Histogram overlays (g, h) are normalized to mode
Fig. 6
Fig. 6
Transcription factors in ITC. a Heatmap showing mean expression levels (scaled by row) for variable transcription factors among cell types, clustered into four groups. b Flow-cytometric quantification of T-bet (N = 3) compared to transcript levels with RNA-seq for its encoding gene TBX21 (N = 6). Cluster 1, c TBX21, d HOPX, and e ZEB2; Cluster 3, f ID2, g ZBTB16, i ARNTL, and j RORA. h Flow-cytometric quantification of PLZF (N = 3) compared to transcript levels for its encoding gene ZBTB16 (N = 6). Error for tpm vs. MFI is s.e.m. Boxplots are described in Methods
Fig. 7
Fig. 7
Innateness in adaptive T-cell populations. Analysis of innateness score (based on PC1 loadings) for transcriptomic datasets from a HCMV-specific CD8+ T-cell populations (naive = CD45RA+CD27bright; memory = CD45RACD27+; effector = CD45RA+CD27), and b CD4+ T-cell populations from patients with rheumatoid arthritis or osteoarthritis (TCM = T central memory; red boxplots indicate effector subsets). Boxplots are described in Methods. c Single-cell RNA-seq imputed expression data from T cells from normal or tumor breast tissue with innateness score calculated for each cell. Boxes show the first to third quartile with median, whiskers encompass 95% of the data. a N = 4 replicates, b N = 7 rheumatoid arthritis and 6 osteoarthritis donors, c N = 17,783 breast T cells from eight cancer patients. P-values are Wilcoxon test
Fig. 8
Fig. 8
Single-cell RNA-seq of ITC. In total, 2306 lymphocytes sorted and barcoded with antibodies to confirm population identity. a Level of innateness (β) in low-input RNA-seq vs. single-cell RNA-seq for genes that were significantly associated with innateness gradient in low-input RNA-seq. In red, genes that were also significant in single-cell RNA-seq (Bonferroni threshold). b UMAP colored by cell type as identified with hashing antibodies, or c innateness score calculated for each cell, or d by the four clusters identified. e Heatplot showing cells colored by innateness score, separated by cell type as identified by hashing antibodies (rows), and sorted by the cluster and innateness score. f UMAP showing CD8+ T-cell subpopulations in clusters 1, 2, and 3. g Left panel, genes upregulated in CD8-1 vs. CD8-2 and CD8-3; right panel, genes upregulated in CD8-3 vs. CD8-1 and CD8-2. Heatmap shows mean expression levels (scaled by row). N = 2 donors per sorted cell population

References

    1. Godfrey DI, Uldrich AP, McCluskey J, Rossjohn J, Moody DB. The burgeoning family of unconventional T cells. Nat. Immunol. 2015;16:1114–1123. doi: 10.1038/ni.3298. - DOI - PubMed
    1. Van Rhijn I, Moody DB. Donor unrestricted T cells: a shared human T cell response. J. Immunol. 2015;195:1927–1932. doi: 10.4049/jimmunol.1500943. - DOI - PMC - PubMed
    1. Brennan PJ, Brigl M, Brenner MB. Invariant natural killer T cells: an innate activation scheme linked to diverse effector functions. Nat. Rev. Immunol. 2013;13:101–117. doi: 10.1038/nri3369. - DOI - PubMed
    1. Kjer-Nielsen L, et al. MR1 presents microbial vitamin B metabolites to MAIT cells. Nature. 2012;491:717–723. doi: 10.1038/nature11605. - DOI - PubMed
    1. Vavassori S, et al. Butyrophilin 3A1 binds phosphorylated antigens and stimulates human gammadelta T cells. Nat. Immunol. 2013;14:908–916. doi: 10.1038/ni.2665. - DOI - PubMed

Publication types