. 2019 Feb 8;21(2):27.
doi: 10.1208/s12248-019-0302-5.

Estimation of Solid Tumor Doubling Times from Progression-Free Survival Plots Using a Novel Statistical Approach

Affiliations

Estimation of Solid Tumor Doubling Times from Progression-Free Survival Plots Using a Novel Statistical Approach

Katherine Kay et al. AAPS J. .

Abstract

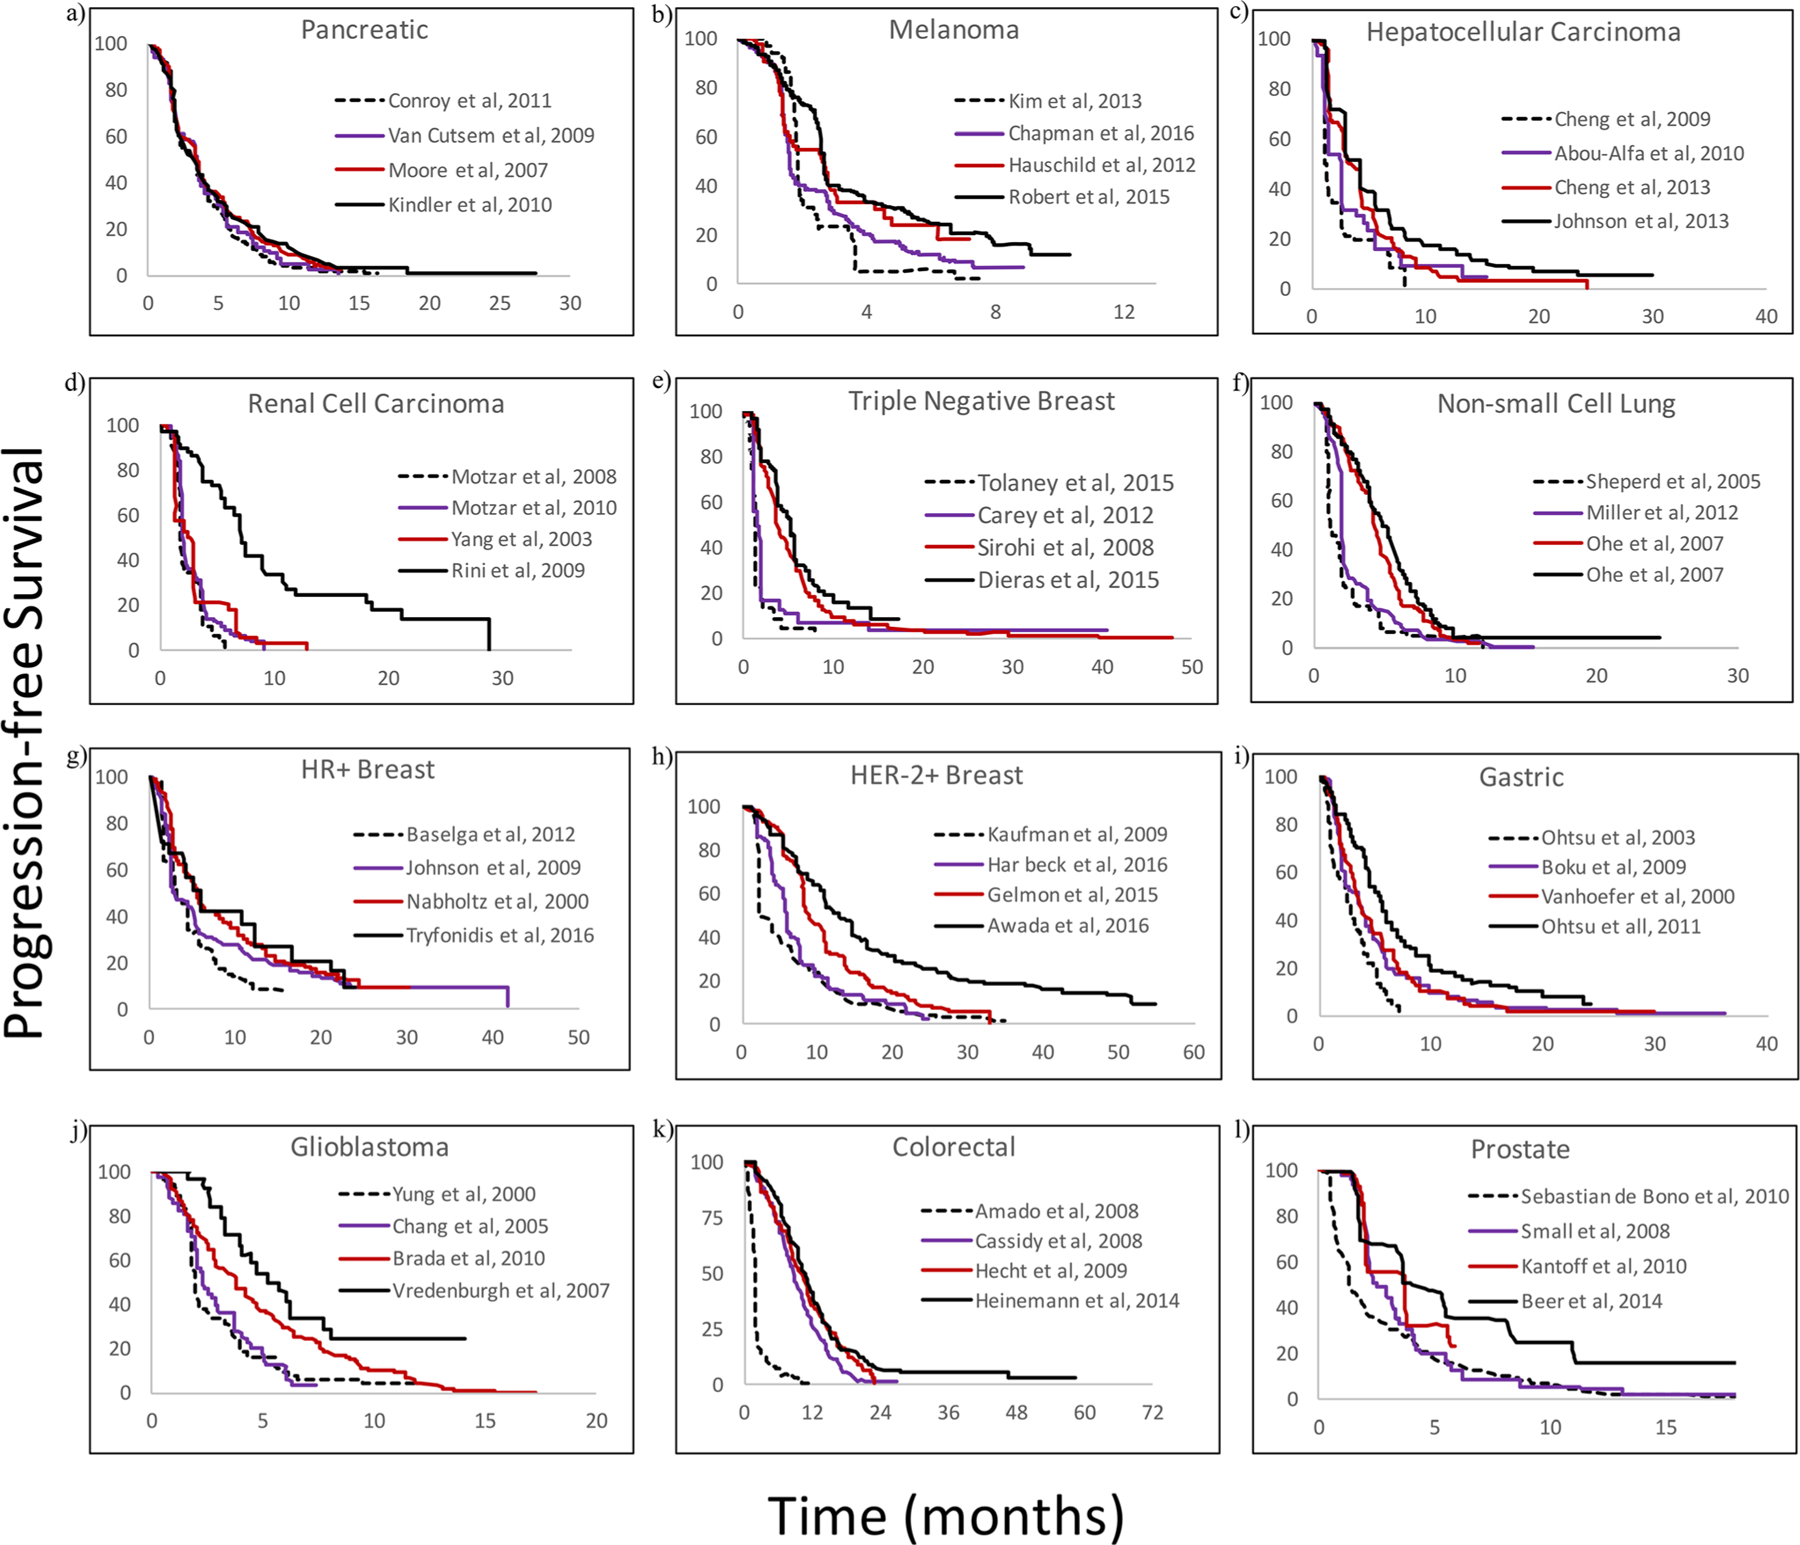
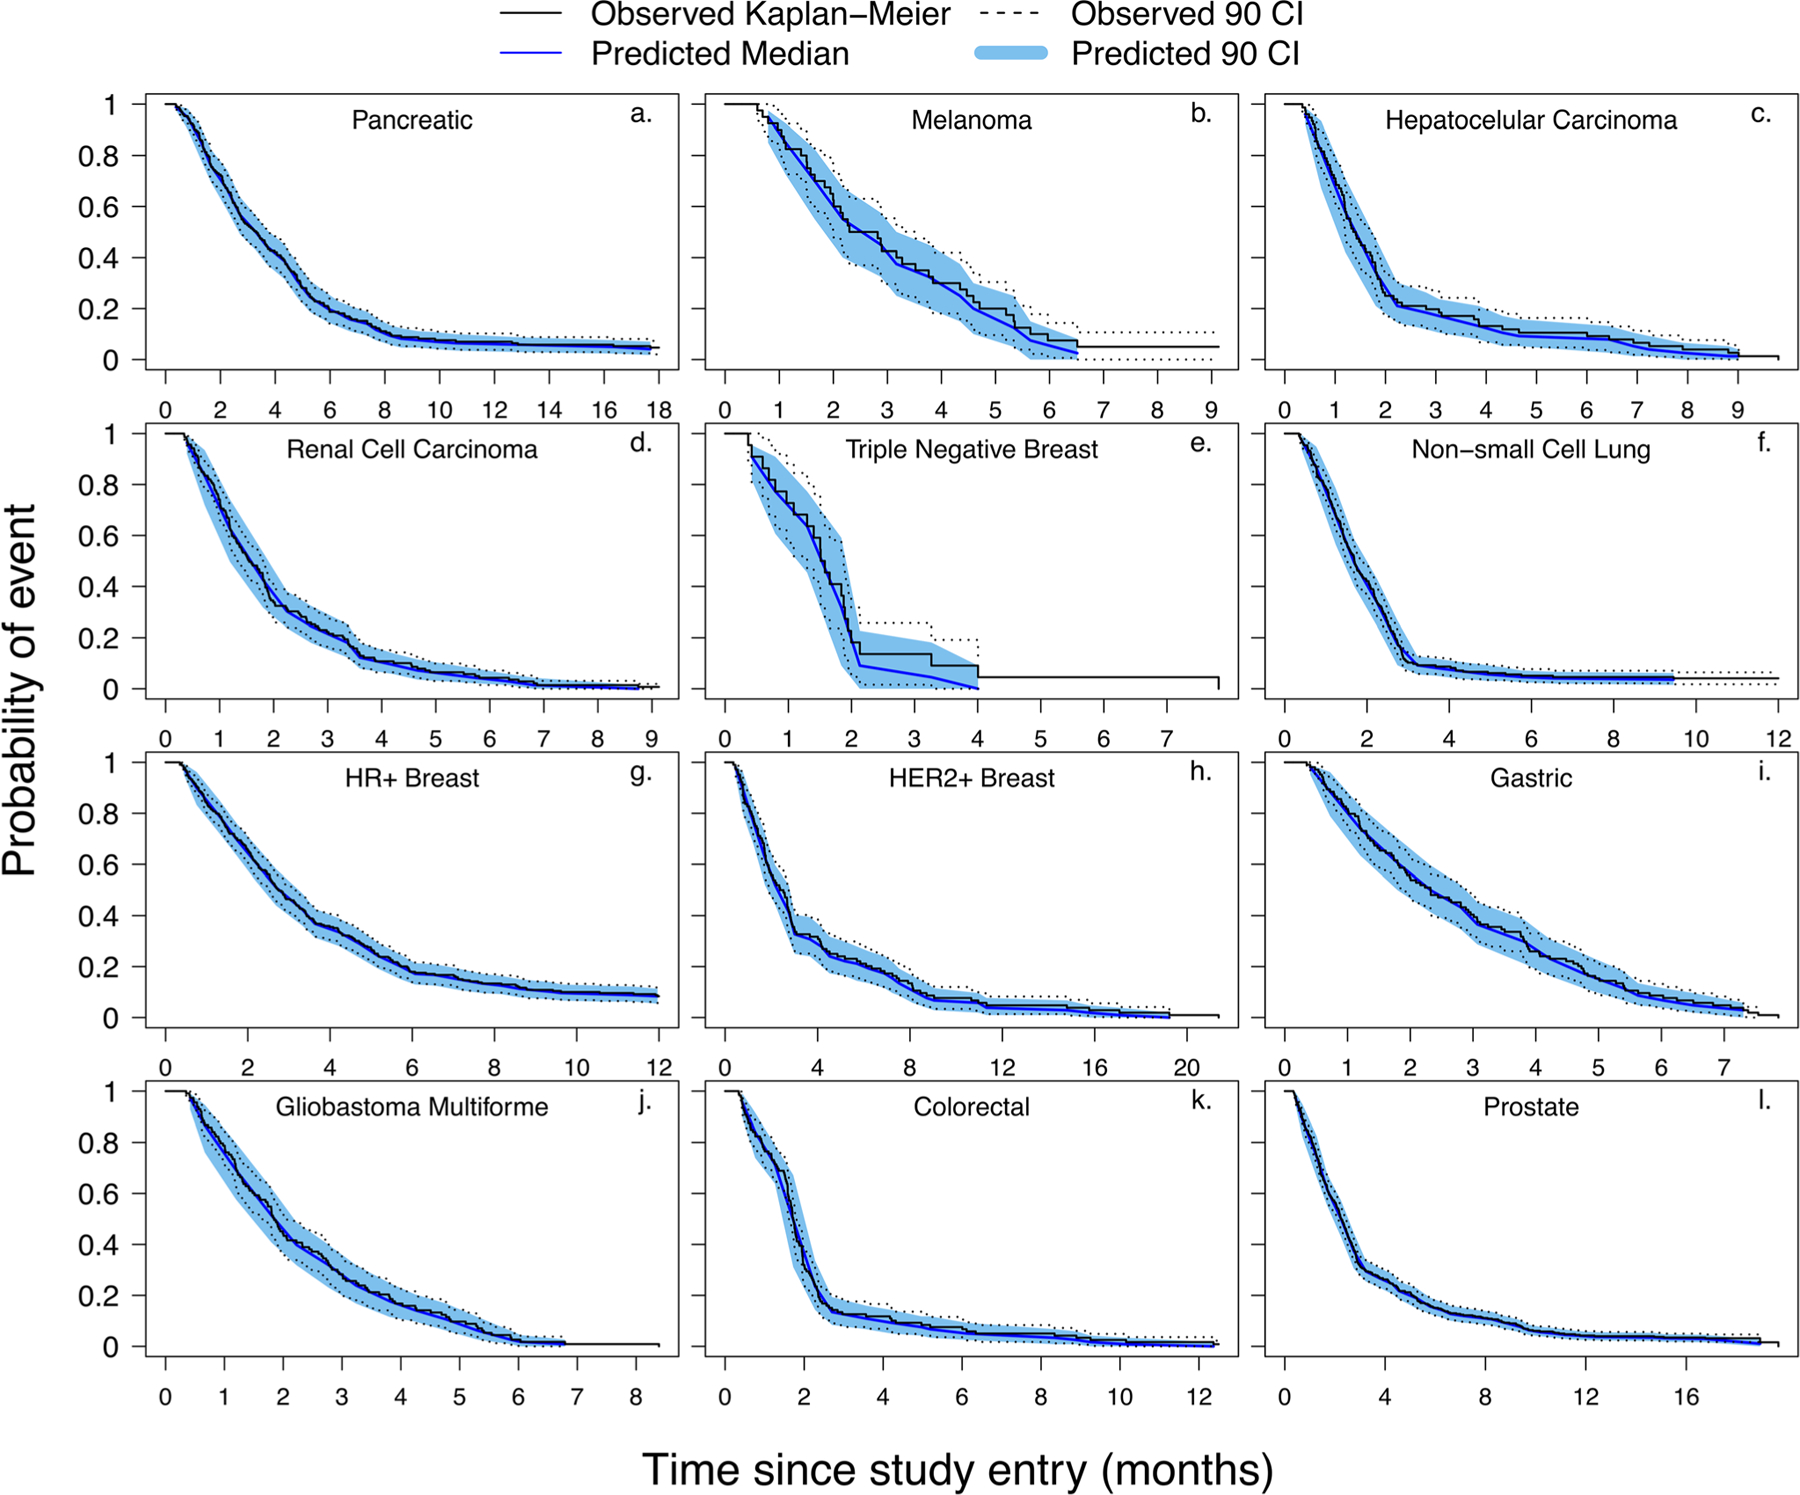
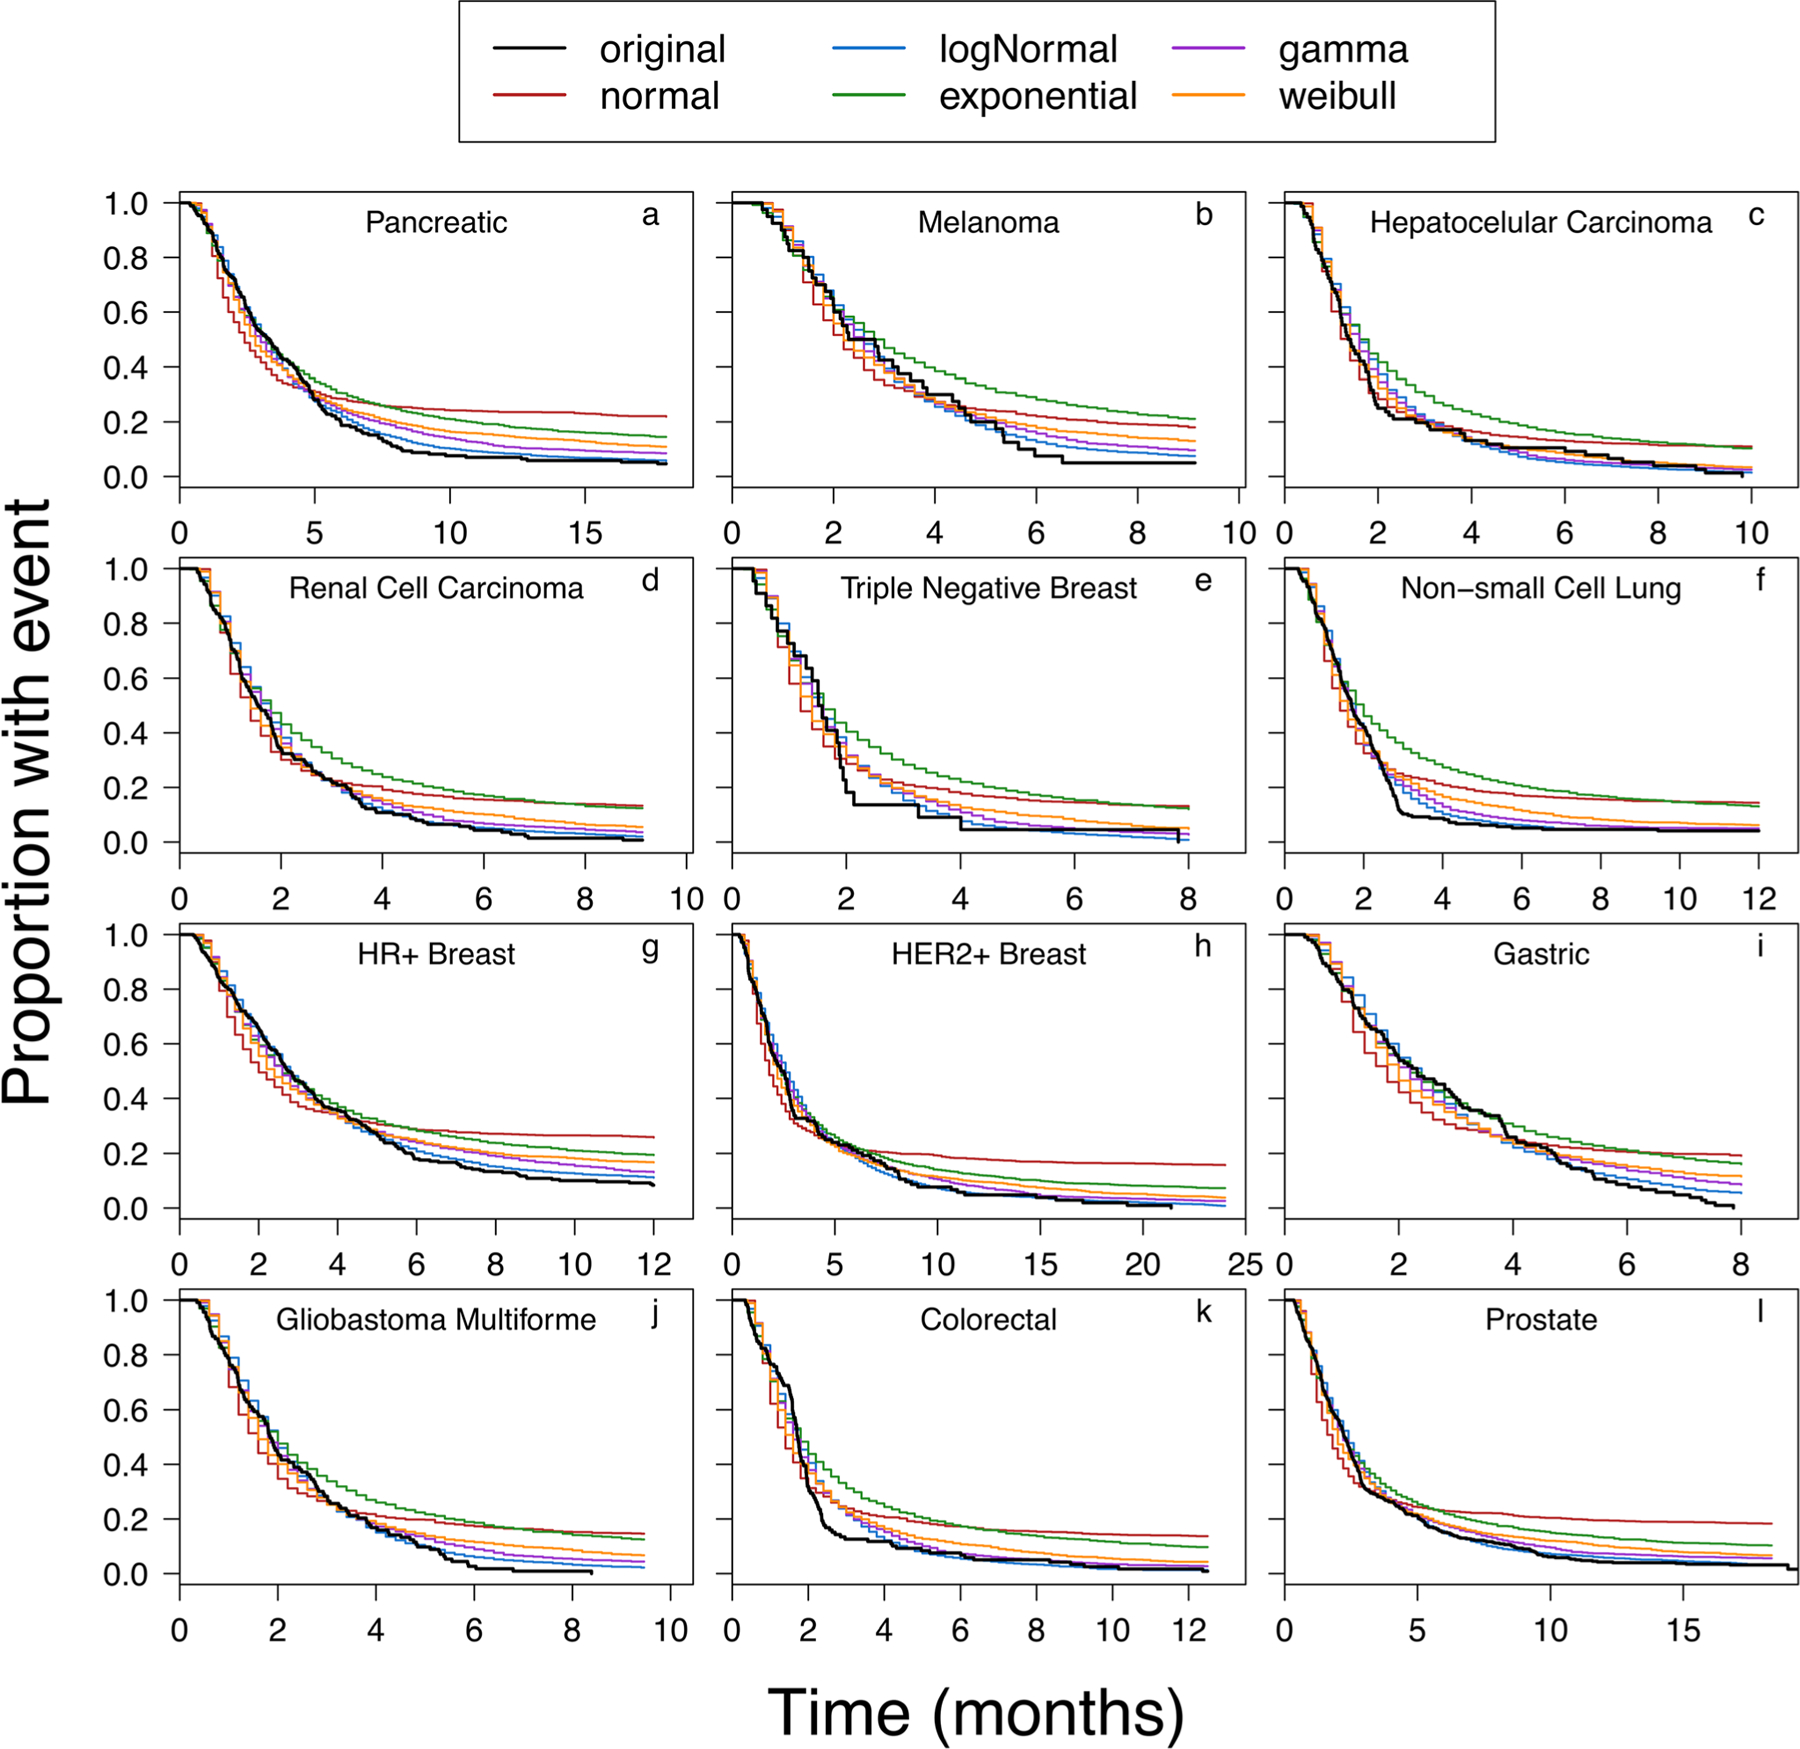
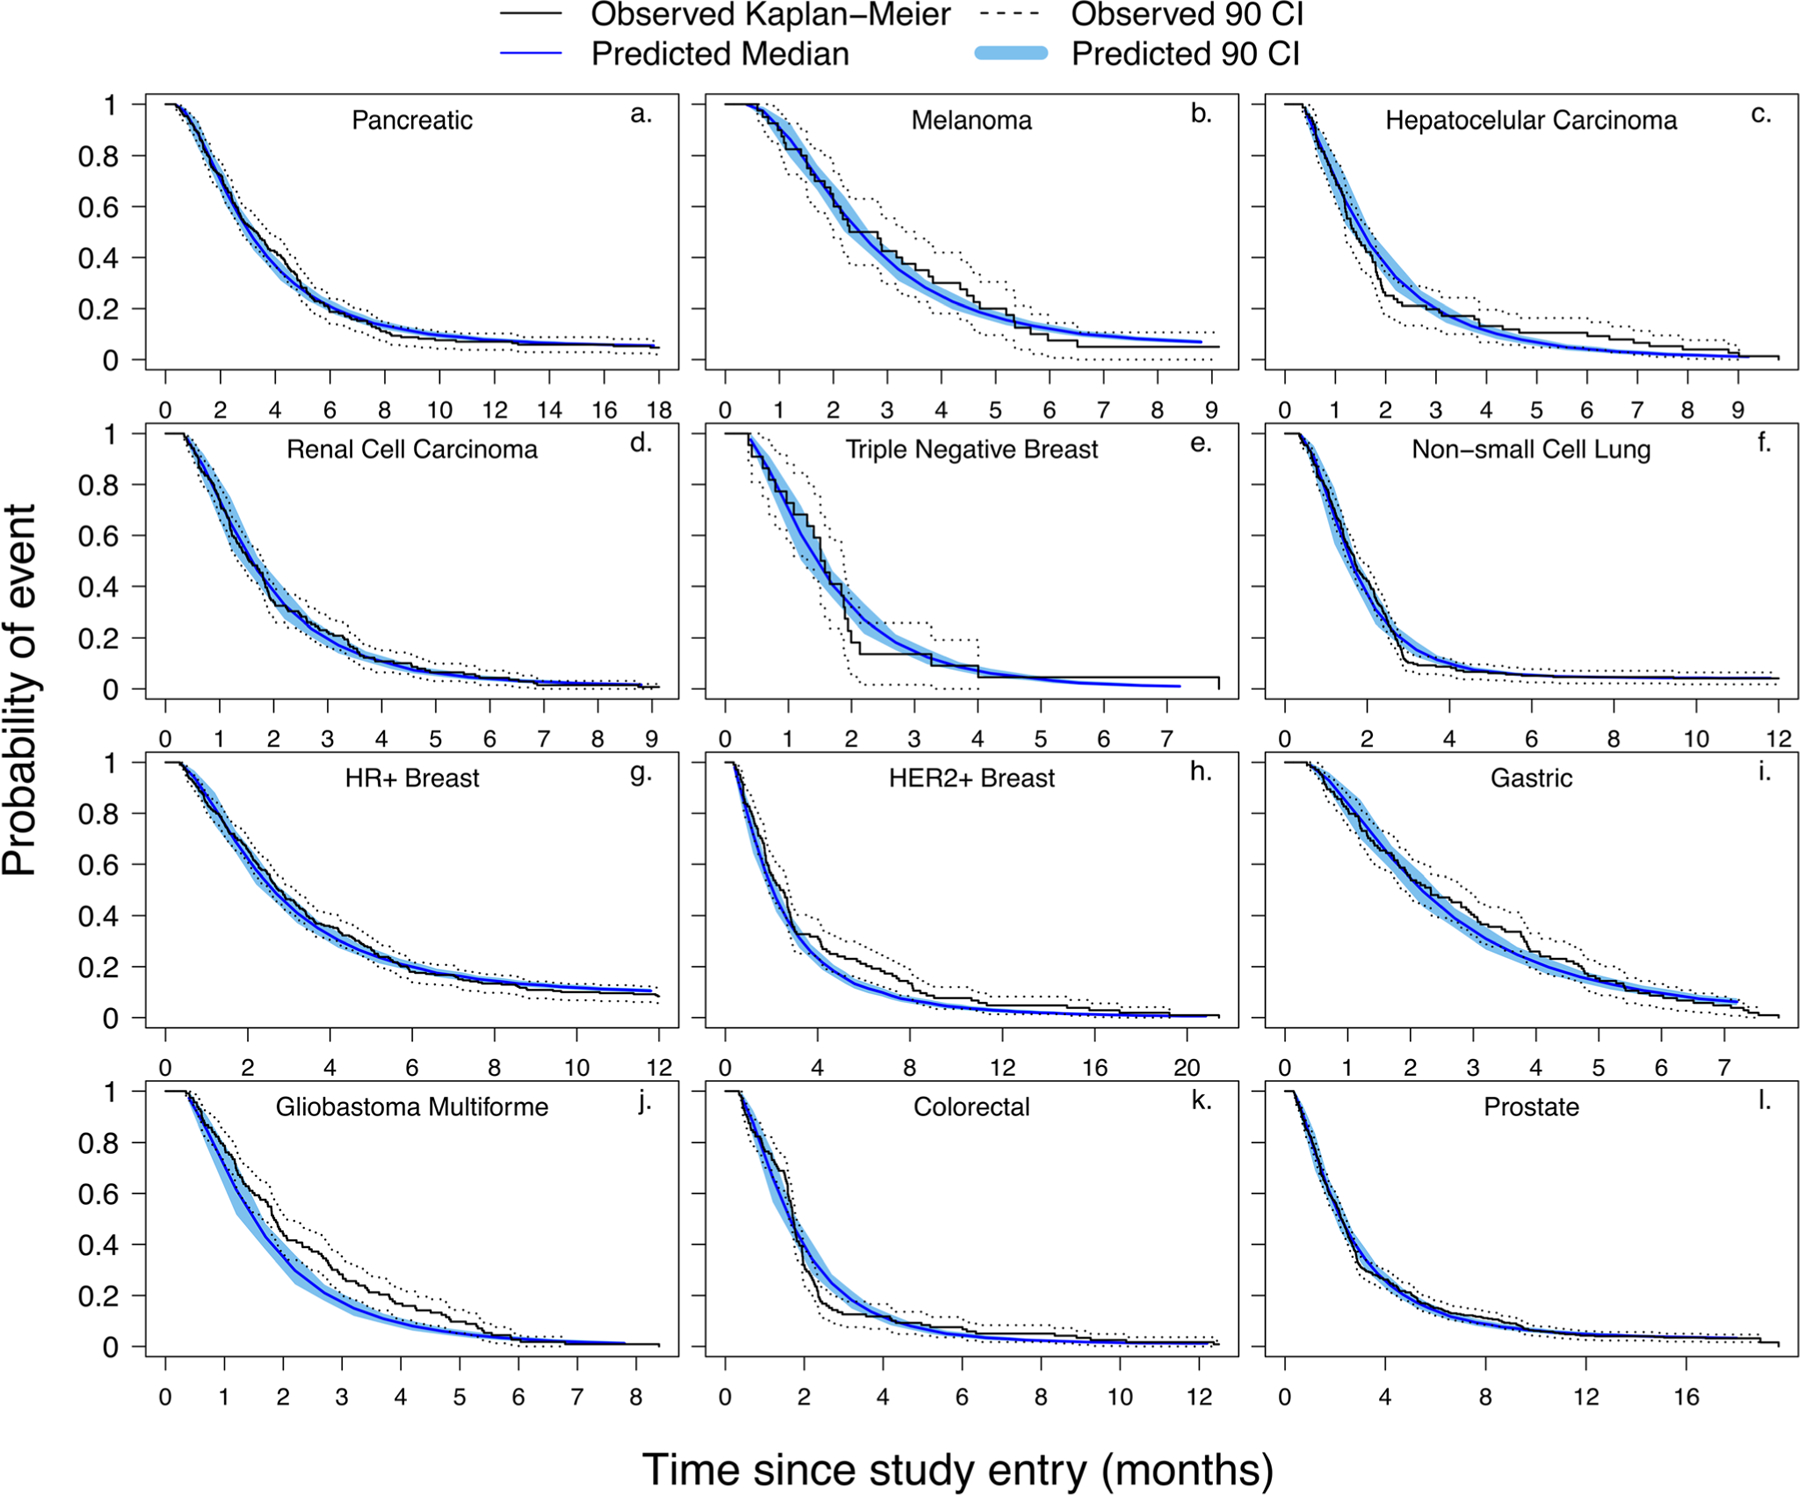
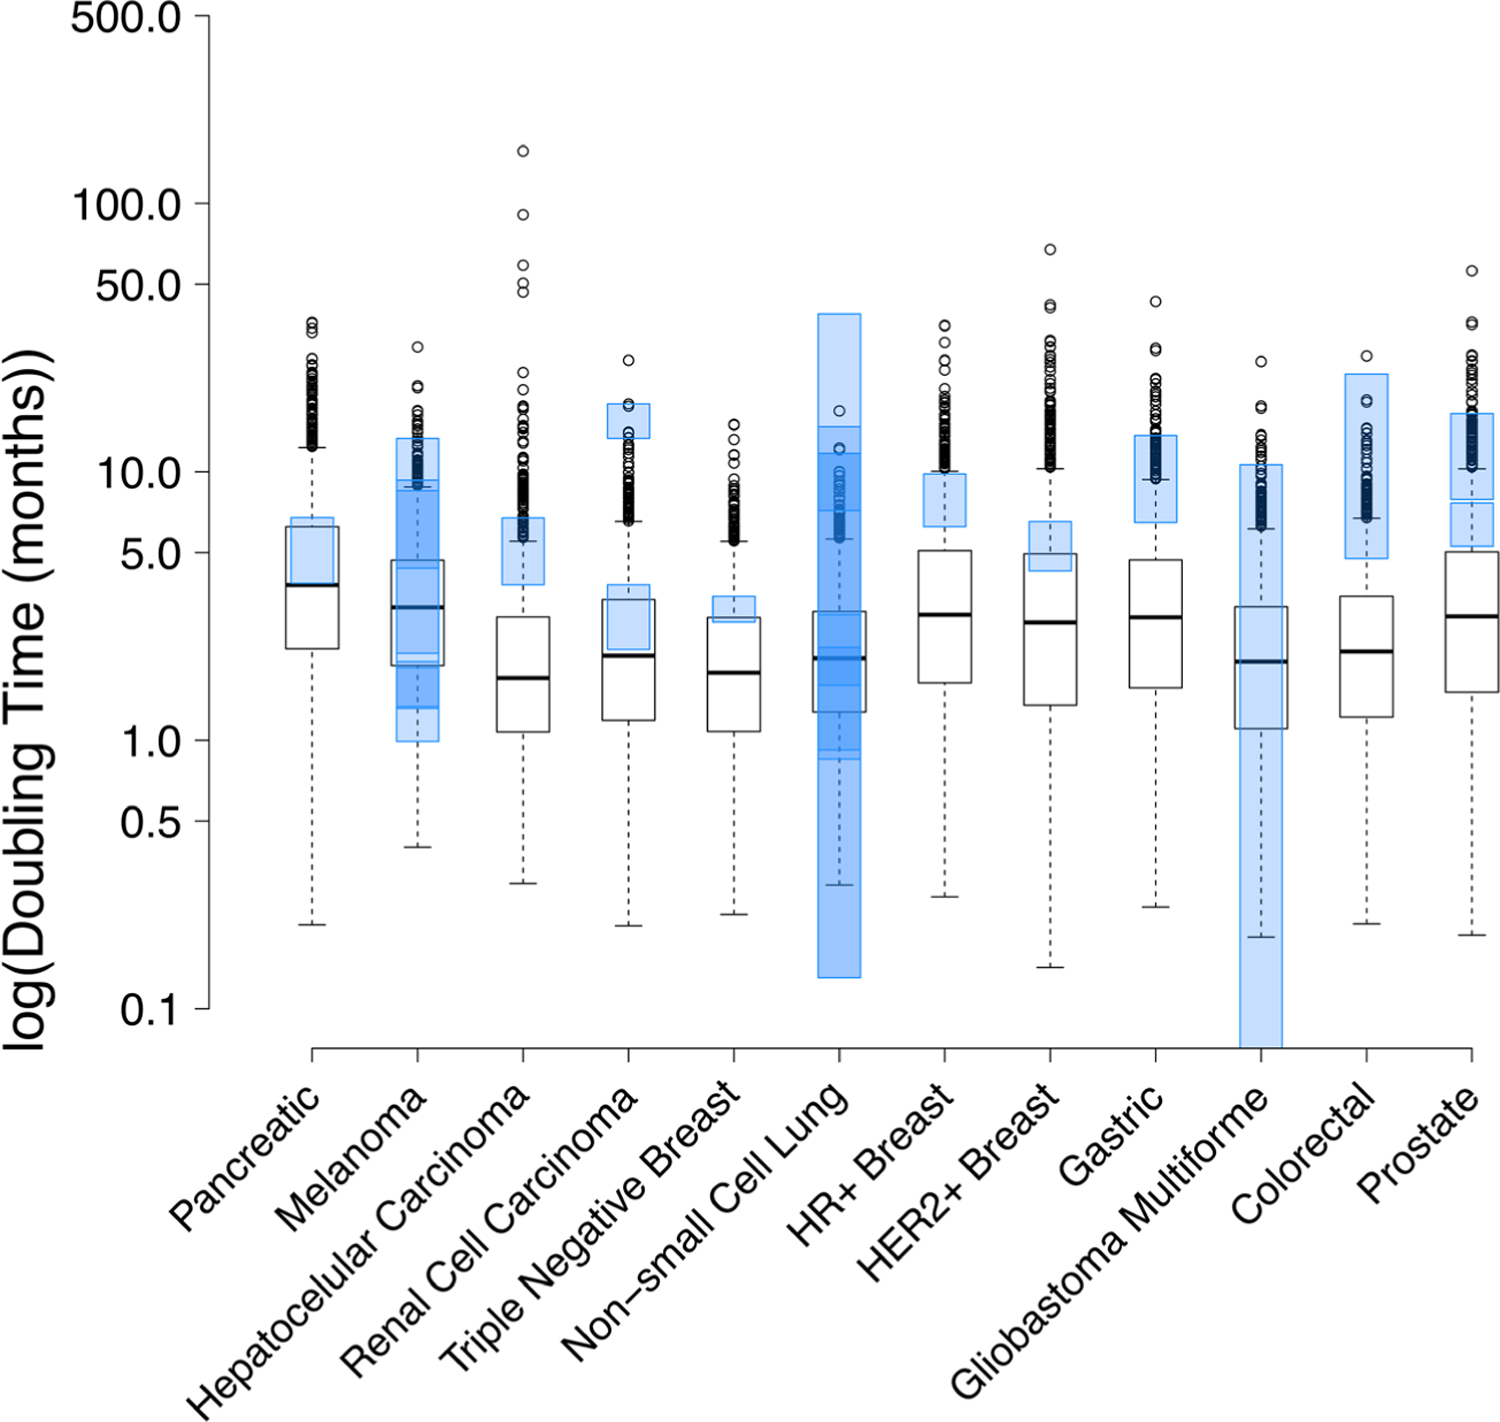
Tumor doubling time can significantly affect the outcome of anticancer therapy, but it is very challenging to determine. Here, we present a statistical approach that extracts doubling times from progression-free survival (PFS) plots, which inherently contains information regarding the growth of solid tumors. Twelve cancers were investigated and multiple PFS plots were evaluated for each type. The PFS plot showing fastest tumor growth was deemed to best represent the inherent growth kinetics of the solid tumor, and selected for further analysis. The exponential tumor growth rates were extracted from each PFS plot, along with associated variabilities, which ultimately allowed for the estimation of solid tumor doubling times. The mean simulated doubling times for pancreatic cancer, melanoma, hepatocellular carcinoma (HCC), renal cell carcinoma, triple negative breast cancer, non-small cell lung cancer, hormone receptor positive (HR+) breast cancer, human epidermal growth factor receptor-2 positive (HER-2+) breast cancer, gastric cancer, glioblastoma multiforme, colorectal cancer, and prostate cancer were 5.06, 3.78, 3.06, 2.67, 2.38, 2.40, 4.31, 4.12, and 3.84 months, respectively. For all cancers, clinically reported doubling times were within the estimated ranges. For all cancers, except HCC, the growth rates were best characterized by a log-normal distribution. For HCC, the gamma distribution best described the data. The statistical approach presented here provides a qualified method for extracting tumor growth rates and doubling times from PFS plots. It also allows estimation of the distributional characteristics for tumor growth rates and doubling times in a given patient population.

Keywords: PK/PD modeling and simulation; preclinical-to-clinical translation; progression-free survival; solid tumor doubling time; tumor growth rate.


Conflict of interest statement

COMPLIANCE WITH ETHICAL STANDARDS

Conflict of Interest RB has served as an expert witness through Belmore Neidrauer LLP funded by Janssen Pharmaceutical. All other authors declare they have no competing interests.

Figures

Fig. 1.
Fig. 1.
Digitized progression-free survival (PFS) curves extracted from 3 to 4 different published trials for each cancer type. Panels a to l represent pancreatic, melanoma, hepatocellular carcinoma, renal cell carcinoma, triple negative breast, non-small cell lung, hormone receptor positive breast, human epidermal growth factor receptor-2 positive breast, gastric, glioblastoma multiforme, colorectal, and prostate cancers, respectively. Publications from which PFS were obtained are listed in the panel
Fig. 2.
Fig. 2.
Kaplan-Meier visual predictive check (KM-VPC) plots for the evaluation of calculated growth rates. Panels a to l represent KM-VPCs for pancreatic, melanoma, hepatocellular carcinoma, renal cell carcinoma, triple negative breast, non-small cell lung, hormone receptor positive breast, human epidermal growth factor receptor-2 positive breast, gastric, glioblastoma multiforme, colorectal, and prostate cancers, respectively. All observed data were obtained from the references listed in Table S1
Fig. 3.
Fig. 3.
Progression-free survival (PFS) simulations using growth rates obtained from fitted distributions (normal, log-normal, gamma, Weibull, exponential) overlaid with the reported PFS plot (references listed in Table S1). Panels a to l represent PFS simulations for pancreatic, melanoma, hepatocellular carcinoma, renal cell carcinoma, triple negative breast, non-small cell lung, hormone receptor positive breast, human epidermal growth factor receptor-2 positive breast, gastric, glioblastoma multiforme, colorectal, and prostate cancers, respectively
Fig. 4.
Fig. 4.
Kaplan-Meier visual predictive check (KM-VPC) plots to evaluate the predictive ability of the fitted growth rate distributions. Panels a to l represent KM-VPCs for pancreatic, melanoma, hepatocellular carcinoma, renal cell carcinoma, triple negative breast, non-small cell lung, hormone receptor positive breast, human epidermal growth factor receptor-2 positive breast, gastric, glioblastoma multiforme, colorectal, and prostate cancers, respectively. All observed plots were obtained from the references listed in Table S1
Fig. 5. Boxplots demonstrating distribution of simulated doubling times across the 12 cancer types. Each boxplot represents the tumor volume doubling times for 1000 samples from the best fitted distribution model that was utilized to characterize the calculated growth rates. The boxplot whiskers represent the upper/lower quartile values plus/minus 1.5 times the interquartile range. All data points outside the whiskers were considered outliers by the R software. For all cancers (except glioblastoma multiforme (GBM)), the blue transparent boxes represent the 95% confidence interval (CI) of the mean doubling time values reported in the literature (Table I
Boxplots demonstrating distribution of simulated doubling times across the 12 cancer types. Each boxplot represents the tumor volume doubling times for 1000 samples from the best fitted distribution model that was utilized to characterize the calculated growth rates. The boxplot whiskers represent the upper/lower quartile values plus/minus 1.5 times the interquartile range. All data points outside the whiskers were considered outliers by the R software. For all cancers (except glioblastoma multiforme (GBM)), the blue transparent boxes represent the 95% confidence interval (CI) of the mean doubling time values reported in the literature (Table I). The 95% CI was not reported for GBM and so the range of reported values (Table I) is shown in the blue transparent box

References

    1. Okazaki N, Yoshino M, Yoshida T, Suzuki M, Moriyama N, Takayasu K, et al. Evaluation of the prognosis for small hepatocellular carcinoma based on tumor volume doubling time. A preliminary report. Cancer 1989;63:2207–10. - PubMed
    1. Arai T, Kuroishi T, Saito Y, Kurita Y, Naruke T, Kaneko M. Tumor doubling time and prognosis in lung cancer patients: evaluation from chest films and clinical follow-up study. Japanese Lung Cancer Screening Research Group. Jpn J Clin Oncol 1994;24:199–204. - PubMed
    1. Furukawa H, Iwata R, Moriyama N. Growth rate of pancreatic adenocarcinoma: initial clinical experience. Pancreas 2001;22:366–9. - PubMed
    1. Kuroishi T, Tominaga S, Morimoto T, Tashiro H, Itoh S, Watanabe H, et al. Tumor growth rate and prognosis of breast cancer mainly detected by mass screening. Jpn J Cancer Res 1990;81:454–62. - PMC - PubMed
    1. Spratt JS Jr, Spratt TL. Rates of growth of pulmonary metastases and host survival. Ann Surg 1964;159:161–71. - PMC - PubMed

Publication types

Substances