. 2019 Feb 21;176(5):967-981.e19.
doi: 10.1016/j.cell.2018.12.039. Epub 2019 Feb 7.

Chronic Inflammation Permanently Reshapes Tissue-Resident Immunity in Celiac Disease

Affiliations

Chronic Inflammation Permanently Reshapes Tissue-Resident Immunity in Celiac Disease

Toufic Mayassi et al. Cell. .

Abstract

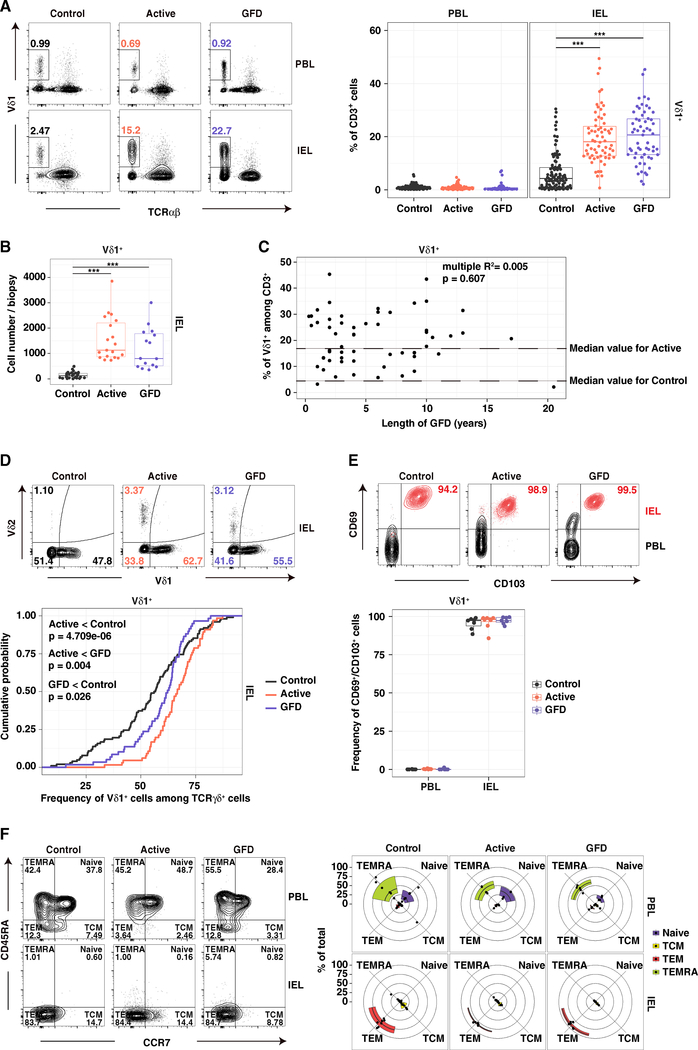
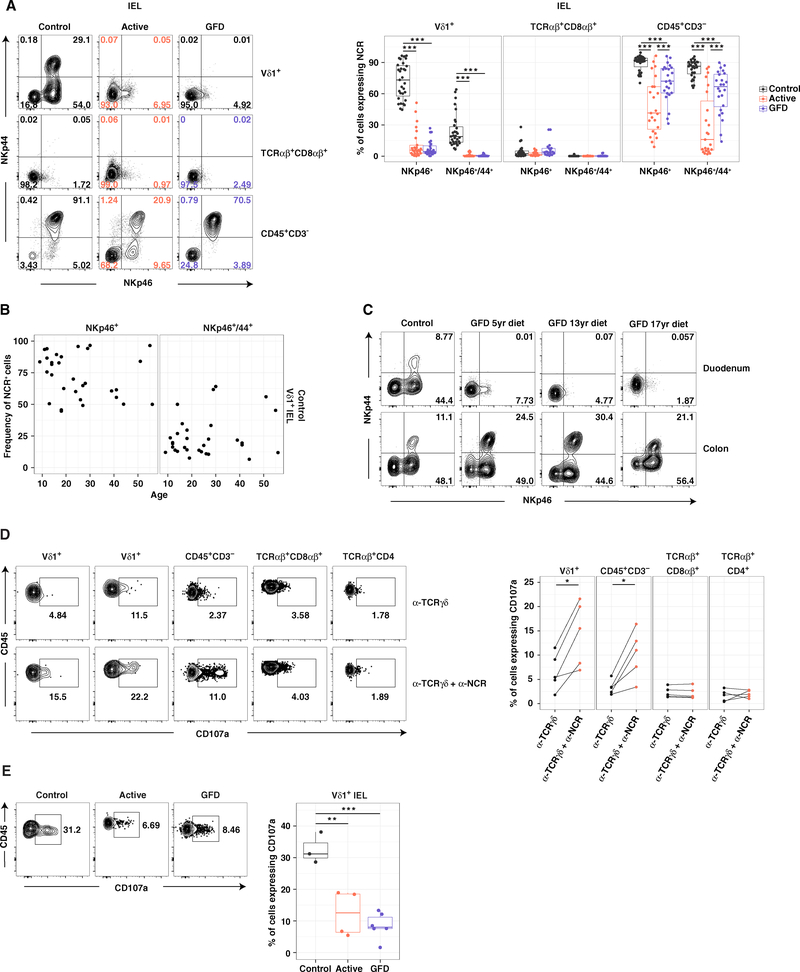
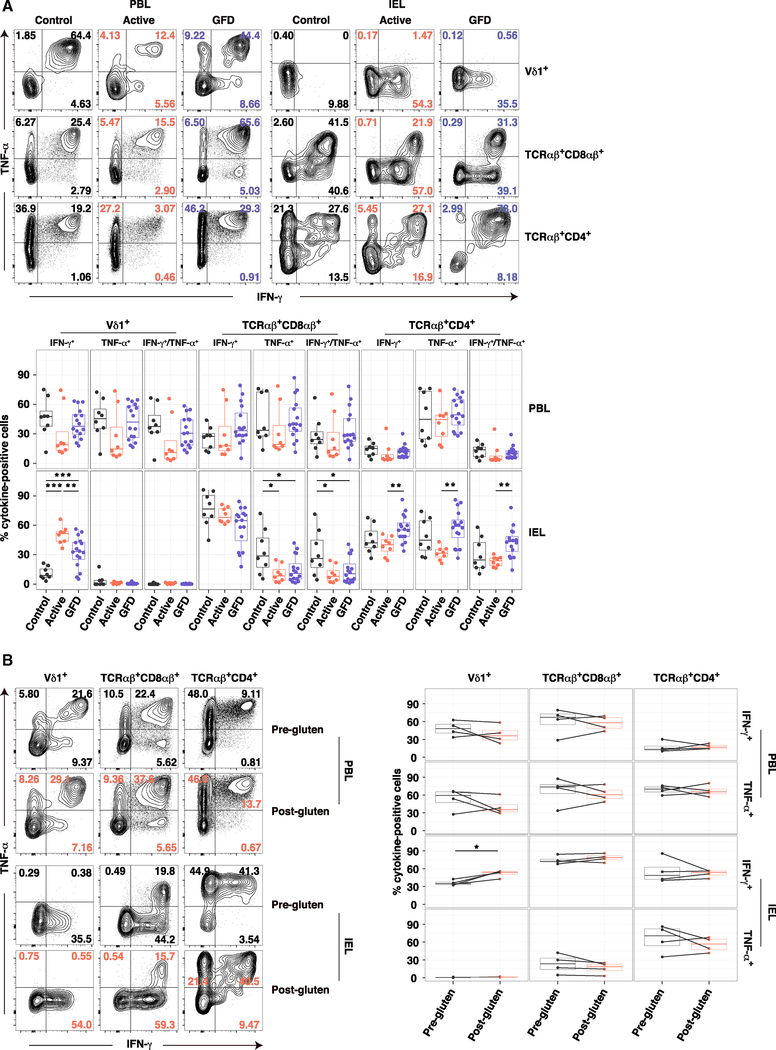
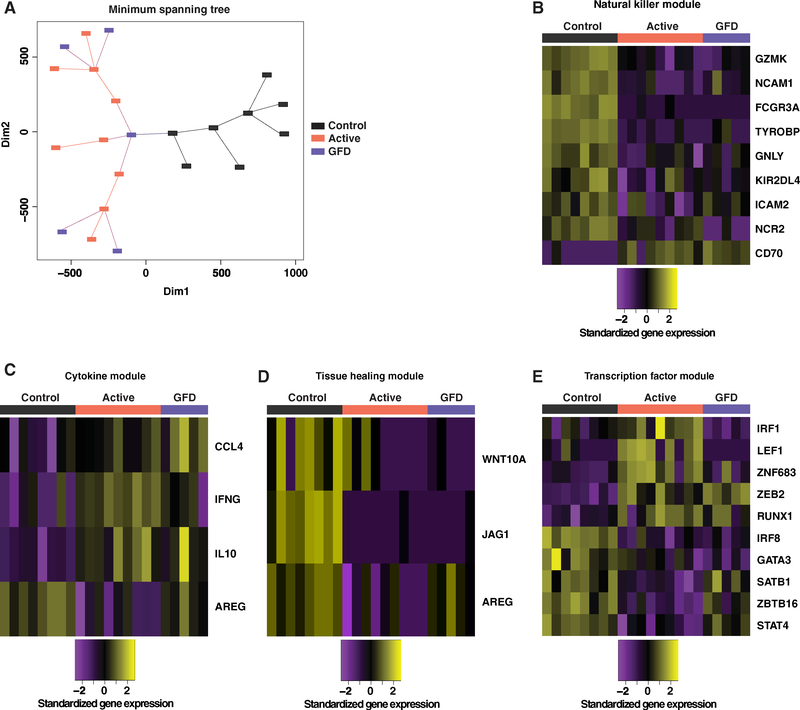
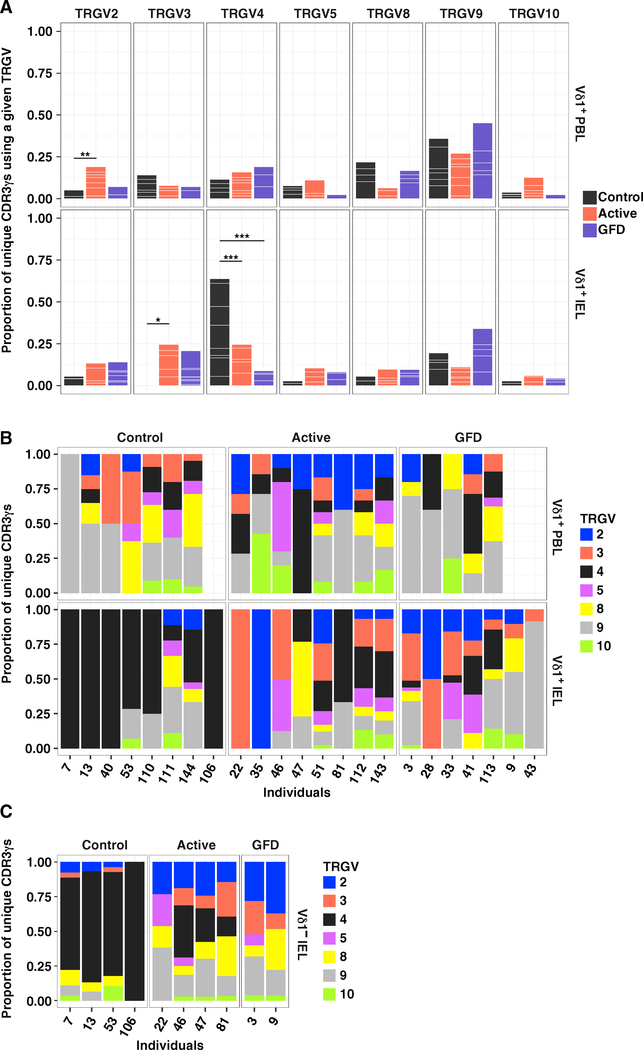
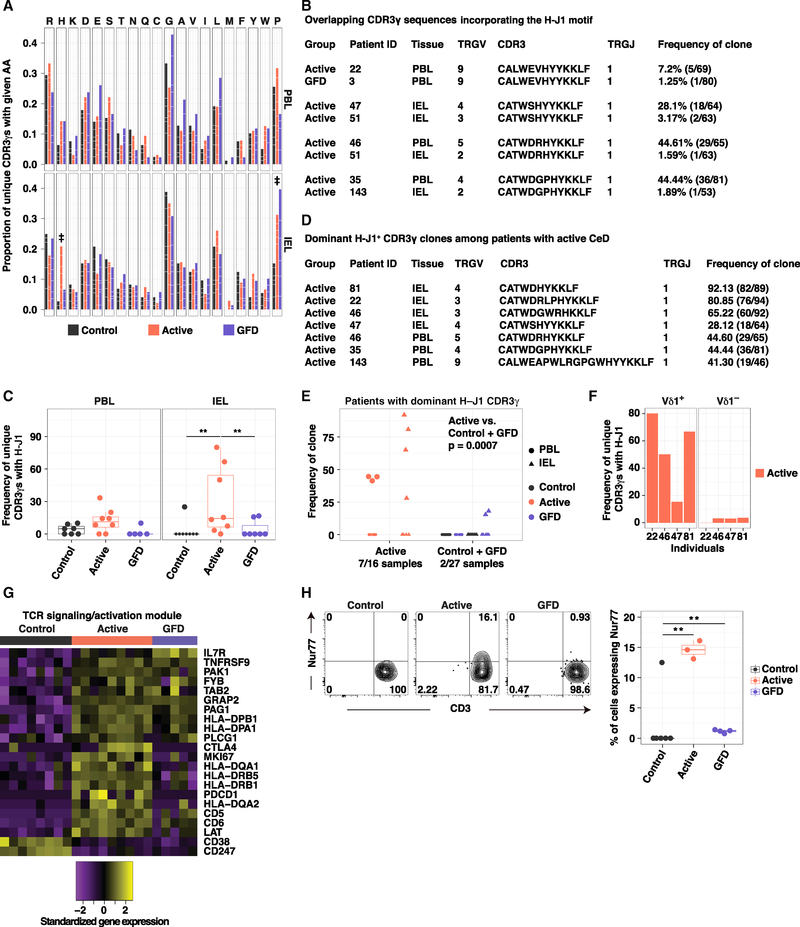
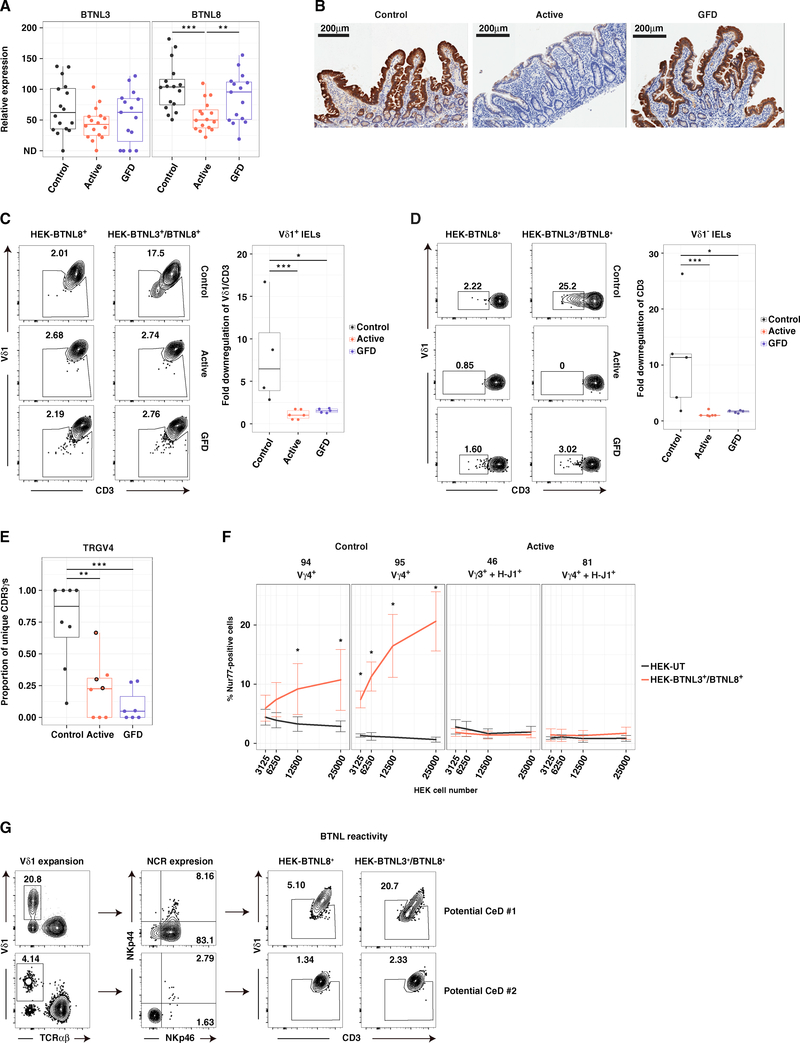
Tissue-resident lymphocytes play a key role in immune surveillance, but it remains unclear how these inherently stable cell populations respond to chronic inflammation. In the setting of celiac disease (CeD), where exposure to dietary antigen can be controlled, gluten-induced inflammation triggered a profound depletion of naturally occurring Vγ4+/Vδ1+ intraepithelial lymphocytes (IELs) with innate cytolytic properties and specificity for the butyrophilin-like (BTNL) molecules BTNL3/BTNL8. Creation of a new niche with reduced expression of BTNL8 and loss of Vγ4+/Vδ1+ IELs was accompanied by the expansion of gluten-sensitive, interferon-γ-producing Vδ1+ IELs bearing T cell receptors (TCRs) with a shared non-germline-encoded motif that failed to recognize BTNL3/BTNL8. Exclusion of dietary gluten restored BTNL8 expression but was insufficient to reconstitute the physiological Vγ4+/Vδ1+ subset among TCRγδ+ IELs. Collectively, these data show that chronic inflammation permanently reconfigures the tissue-resident TCRγδ+ IEL compartment in CeD. VIDEO ABSTRACT.

Keywords: butyrophilin-like molecules; celiac disease; intraepithelial lymphocytes; tissue-resident lymphocytes; γδ T cells.


Conflict of interest statement

DECLARATION OF INTERESTS

The authors declare no competing interests.

Figures

Figure 1.
Figure 1.. Vδ1+ IELs with Hallmarks of Tissue Residency Are Permanently Expanded in CeD
(A) Frequency of Vδ1+ cells among CD3+ lymphocytes. Right: boxplots display first and third quartiles. ***p < 0.001. One-way ANOVA with Tukey’s test for multiple comparisons. (B) Absolute numbers of Vδ1+ IELs from 3–5 biopsies per donor. Boxplot displays first and third quartiles ***p < 0.001. One-way ANOVA with Tukey’s test for multiple comparisons. (C) Frequency of Vδ1+ IELs among CD3+ lymphocytes versus the duration of treatment with a GFD. Linear regression. (D) Frequency of Vδ1+ IELs among TCRγδ+ cells. Bottom: cumulative distribution. Healthy controls: n = 99. Patients with active CeD: n = 62. Patients with GFD-treated CeD: n = 57. Kolmogorov-Smirnov test. (E) Frequency of CD69+/CD103+ cells among Vδ1+ PBLs and IELs. Bottom: boxplot displays first and third quartiles. (F) Fraction of cells defined as naive, central memory (TCM), effector memory (TEM), or terminal effector (TEMRA) based on expression of CD45RA and CCR7. See also Figure S6.
Figure 2.
Figure 2.. Innate-like Vδ1+ IELs Are Lost in CeD
(A) Frequency of IELs expressing NKp46 with or without NKp44. Right: boxplots display first and third quartiles. ***p < 0.001. One-way ANOVA with Tukey’s test for multiple comparisons. (B) Expression of NKp46 or NKp46/NKp44 on control Vδ1+ IELs versus age. (C) Expression of NKp46 and NKp44 on Vδ1+ IELs from donor-matched duodenal and right colonic biopsies. (D) Expression of CD107a on IL-15-treated IELs after stimulation with plate-bound αTCRγδ ± αNKp46. *p < 0.05. Paired t test. (E) Expression of CD107a on Vδ1+ IELs after stimulation with phorbol myristate acetate and ionomycin. Right: boxplot displays first and third quartiles. **p < 0.01, ***p < 0.001. One-way ANOVA with Tukey’s test for multiple comparisons. See also Figures S1 and S6.
Figure 3.
Figure 3.. Dietary Gluten Drives the Emergence of IFN-γ-Producing Vδ1+ IELs in CeD
(A) Expression of IFN-γ and TNF-α in cells stimulated ex vivo with phorbol myristate acetate and ionomycin. Bottom: boxplots display first and third quartiles. *p < 0.05, **p < 0.01, ***p < 0.001. One-way ANOVA with Tukey’s test for multiple comparisons. (B) Expression of IFN-γ and TNF-α in cells from patients with GFD-treated CeD stimulated as in (A) before and after gluten challenge. Duration of GFD: 1.5 years, 4 years, 7 years, and 20.5 years. Right: boxplots display first and third quartiles. *p < 0.05. Paired t test. See also Figure S6.
Figure 4.
Figure 4.. The Transcriptional Program of Vδ1+ IELs Is Permanently Altered in CeD
(A) Transcriptional profiles of NCR+ Vδ1+ IELs from healthy controls, NCR Vδ1+ IELs from patients with active CeD, and NCR Vδ1+ IELs from patients with GFD-treated CeD compared using minimum spanning tree analysis. (B) Differentially expressed genes from the NK module passing a false discovery rate < 10% from any two-way contrast between the Vδ1+ IEL populations in (A). Expression values were standardized (mean centered) on a per gene basis. (C) Genes from the cytokine module passing the criteria in (B). (D) Genes from the tissue healing module passing the criteria in (B). (E) Genes from the transcription factor module passing the criteria in (B). See also Figures S2 and S6.
Figure 5.
Figure 5.. The Vδ1+ IEL TCR Repertoire Is Permanently Reshaped in CeD
(A) Proportion of unique CDR3γ sequences using a particular TRGV gene among Vδ1+ PBLs and IELs. White lines demarcate individual contributions. Healthy controls: PBLs, n = 7; IELs, n = 8. Patients with active CeD: PBLs, n = 8; IELs, n = 8. Patients with GFD-treated CeD: PBLs, n = 5; IELs, n = 7. *p < 0.05, **p < 0.01, ***p < 0.001. Firth’s penalized logistic regression and beta regression. See Table S5A. (B) Data in (A) summarized by individual. (C) Proportion of unique CDR3γ sequences using a particular TRGV gene among Vδ1 IELs summarized by individual. See also Figures S3 and S6.
Figure 6.
Figure 6.. A Molecular Signature Defines Vδ1+ IEL Expansions in Active CeD
(A) Proportion of unique CDR3γ sequences using a particular amino acid (aa). White lines demarcate individual contributions. Donor numbers as in Figure 5A. Double dagger (‡) denotes aas with significant differences between two groups. Firth’s penalized logistic regression and beta regression. See Table S5E. (B) Overlapping CDR3γ sequences incorporating the H-J1 motif. (C) Frequency of unique H-J1+ CDR3γ sequences. Boxplots display first and third quartiles. **p < 0.01. Kruskal-Wallis rank sum test with Dunn’s test for multiple comparisons. (D) Dominant H-J1+ CDR3γ sequences among patients with active CeD. (E) Frequency of dominant H-J1+ CDR3γ sequences. 0 denotes samples in which the dominant CDR3γ sequence lacked H-J1. Kruskal-Wallis rank sum test with Dunn’s test for multiple comparisons. (F) Frequency of unique H-J1+ CDR3γ sequences among Vδ1+ and Vδ1 IELs from patients with active CeD. (G) Genes from the TCR activation module passing the criteria described in Figure 4B. (H) Expression of Nur77 in Vδ1+ IELs versus CD3. Right: boxplot displays first and third quartiles. **p < 0.01. One-way ANOVA with Tukey’s test for multiple comparisons. See also Figures S4 and S6.
Figure 7.
Figure 7.. BTNL3/8-Reactive Vδ1+ IELs Are Lost in CeD
(A) Expression of BTNL3 and BTNL8 relative to GAPDH in small intestinal biopsies via qPCR. Boxplots display first and third quartiles. **p < 0.01, ***p < 0.001. Kruskal-Wallis rank sum test with Dunn’s test for multiple comparisons. (B) Immunohistochemical analysis of BTNL8 expression in duodenal sections. (C) Downregulation of CD3 and Vδ1 on the surface of IELs pre-gated for Vδ1 expression after overnight incubation with HEK293T-BTNL8+ or HEK293T-BTNL3/8+ cells. Gating was patient specific based on the HEK293T-BTNL8+ condition. Right: boxplot displays first and third quartiles. *p < 0.05, ***p < 0.001. Kruskal-Wallis rank sum test with Dunn’s test for multiple comparisons. (D) Downregulation of CD3 on the surface of Vδ1 IELs. Details and statistics as in (C). (E) Proportion of unique CDR3γ sequences expressing TRGV4 gene transcripts. Circles highlighted in black for patients with active CeD denote cases where the dominant TRGV4 transcript incorporated the H-J1 motif. Boxplot displays first and third quartiles. **p < 0.01, ***p < 0.001. Kruskal-Wallis rank sum test with Dunn’s test for multiple comparisons. (F) SKW3 cells stably expressing clonal TCRs were cultured for 2 hr with varying numbers of untransduced HEK293T cells (HEK293T-UT) or HEK293T-BTNL3/8+ cells. Activation was assessed via the induction of intracellular Nur77 from 3–5 independent experiments per TCR. Error bars display SD. *p < 0.05. Paired t test (HEK293T-UT versus HEK293T-BTNL3/8+). (G) Frequency of Vδ1+ IELs (left), expression of NKp46 and NKp44 on Vδ1+ IELs (middle), and expression of CD3 and Vδ1 on IELs after overnight incubation with HEK293T-BTNL8+ or HEK293T-BTNL3/8+ cells (right) for two patients with potential CeD. See also Figures S5–S7.

Comment in

References

    1. Adams NM, Lau CM, Fan X, Rapp M, Geary CD, Weizman O-E, Diaz-Salazar C, and Sun JC (2018). Transcription factor IRF8 orchestrates the adaptive natural killer cell response. Immunity 48, 1172–1182.e6. - PMC - PubMed
    1. Ashouri JF, and Weiss A (2017). Endogenous Nur77 is a specific indicator of antigen receptor signaling in human T and B cells. J. Immunol 198, 657–668. - PMC - PubMed
    1. Beura LK, Mitchell JS, Thompson EA, Schenkel JM, Mohammed J, Wijeyesinghe S, Fonseca R, Burbach BJ, Hickman HD, Vezys V, et al. (2018). Intravital mucosal imaging of CD8+ resident memory T cells shows tissue-autonomous recall responses that amplify secondary memory. Nat. Immunol 19, 173–182. - PMC - PubMed
    1. Bray NL, Pimentel H, Melsted P, and Pachter L (2016). Near-optimal probabilistic RNA-seq quantification. Nat. Biotechnol 34, 525–527. - PubMed
    1. Brochet X, Lefranc MP, and Giudicelli V (2008). IMGT/V-QUEST: the highly customized and integrated system for IG and TR standardized V-J and V-D-J sequence analysis. Nucleic Acids Res. 36, W503–8. - PMC - PubMed

Publication types

MeSH terms