. 2019 Feb 21;176(5):1083-1097.e18.
doi: 10.1016/j.cell.2019.01.018. Epub 2019 Feb 7.

Excessive Cell Growth Causes Cytoplasm Dilution And Contributes to Senescence

Affiliations

Excessive Cell Growth Causes Cytoplasm Dilution And Contributes to Senescence

Gabriel E Neurohr et al. Cell. .

Abstract

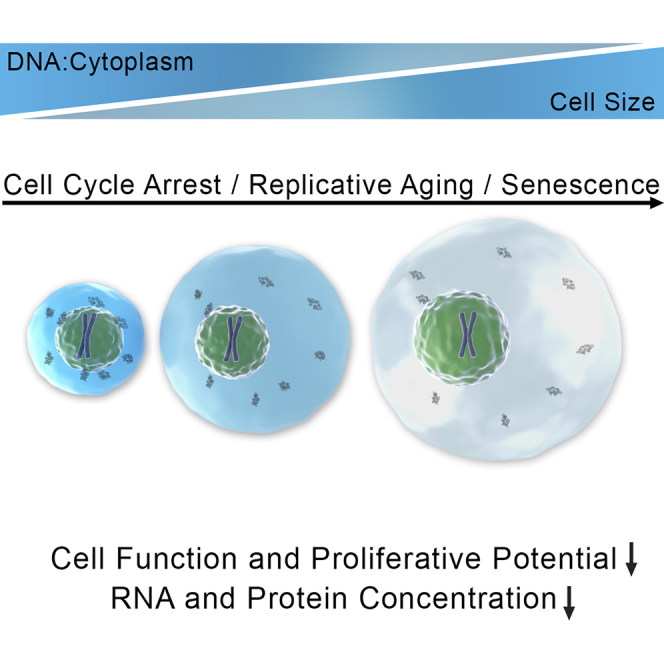
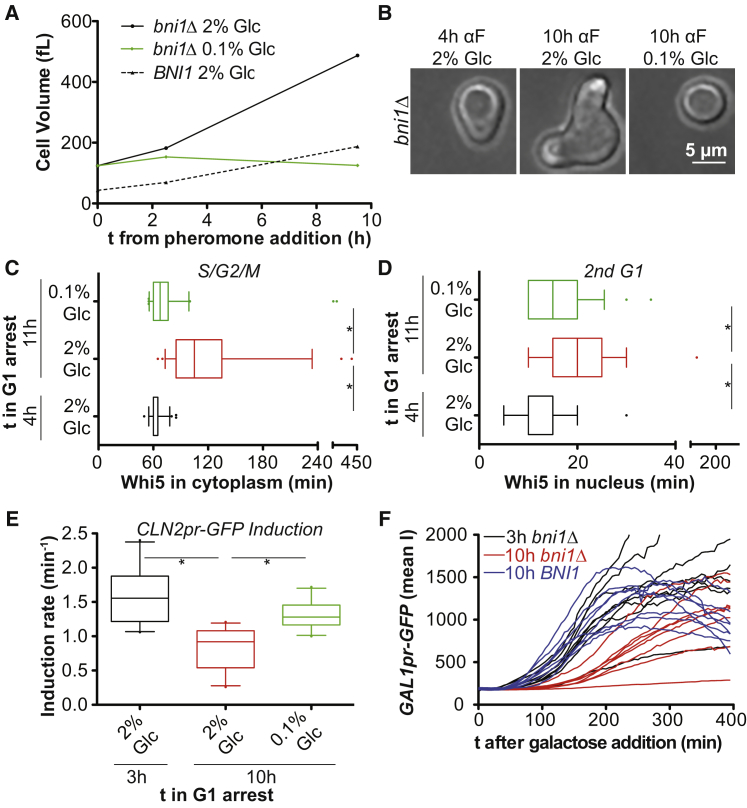
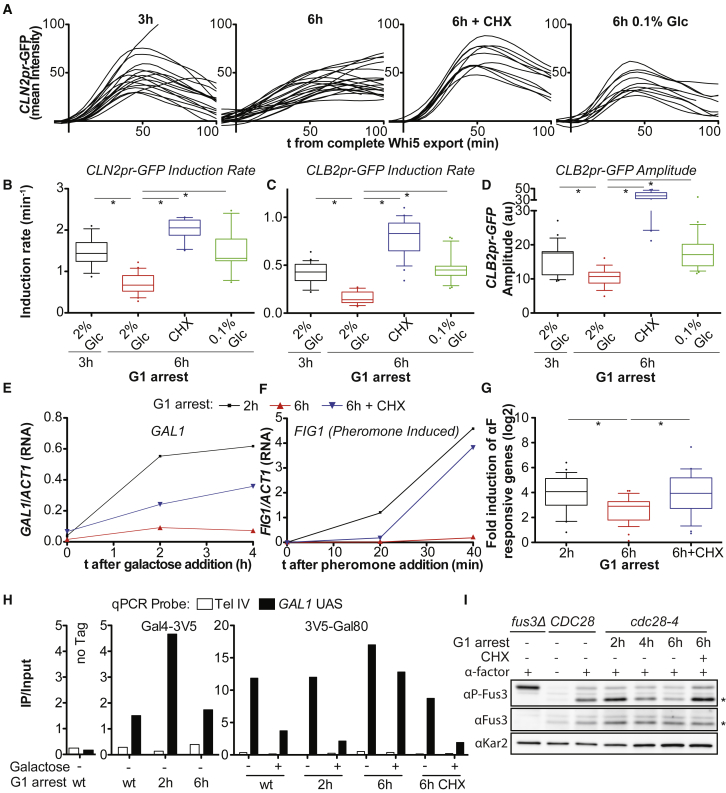
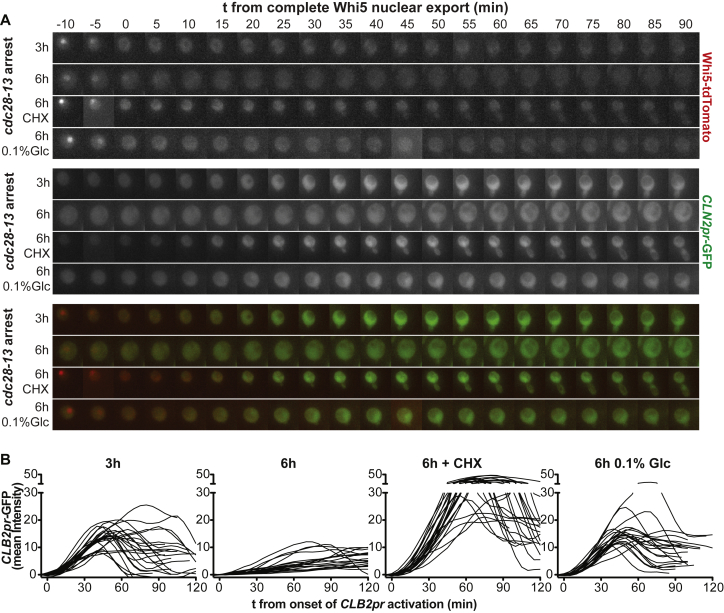
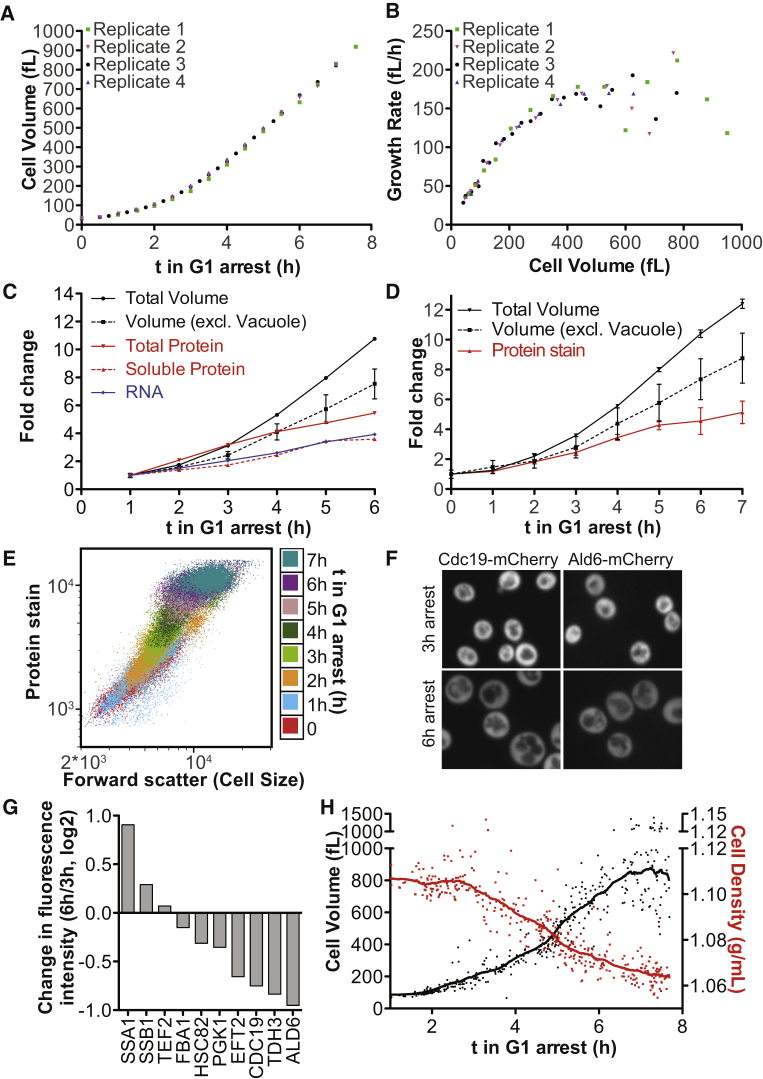
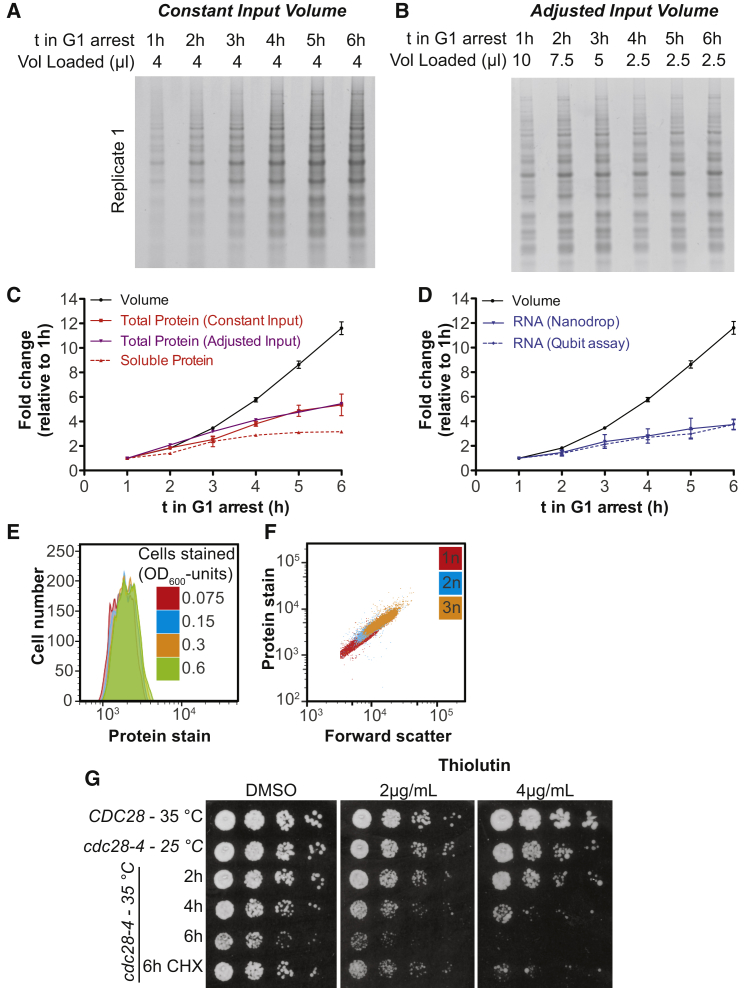
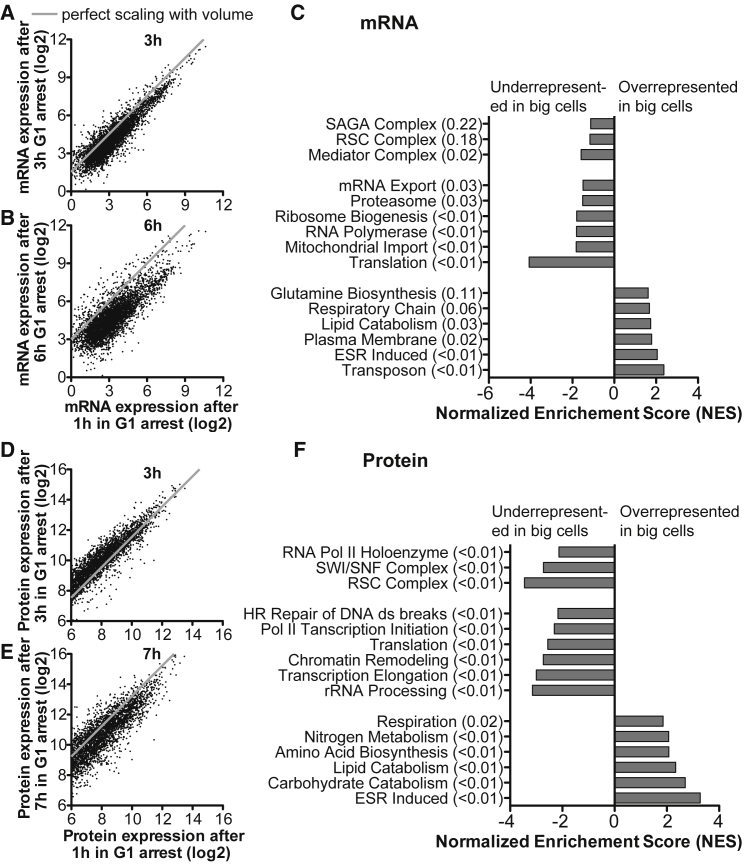
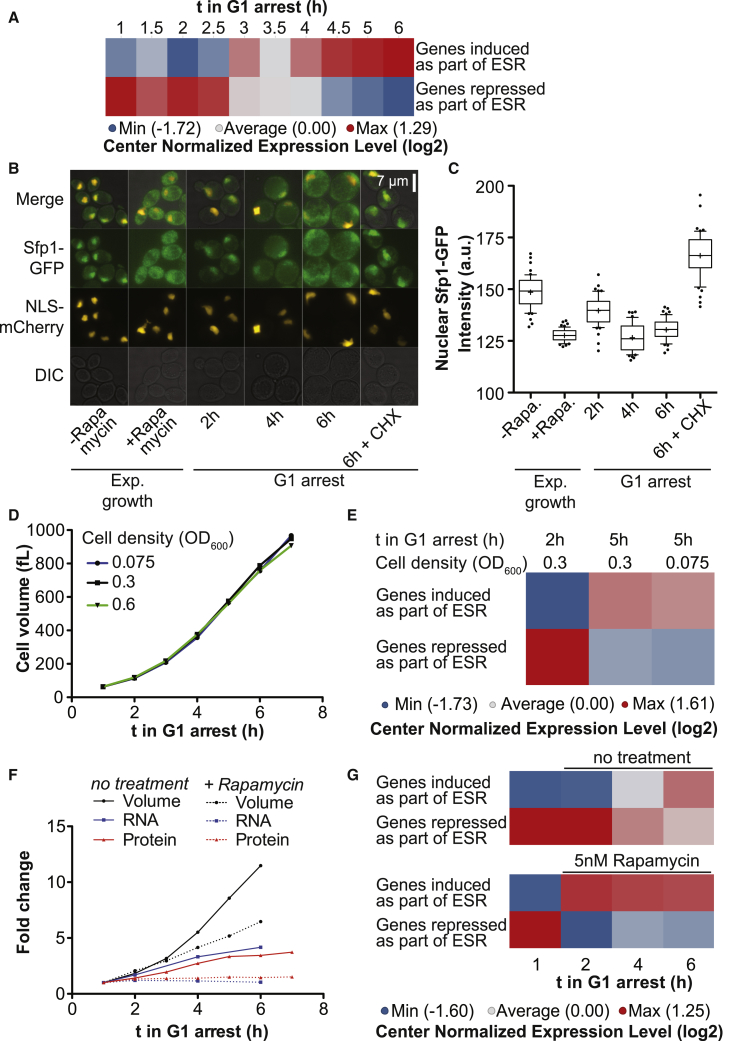
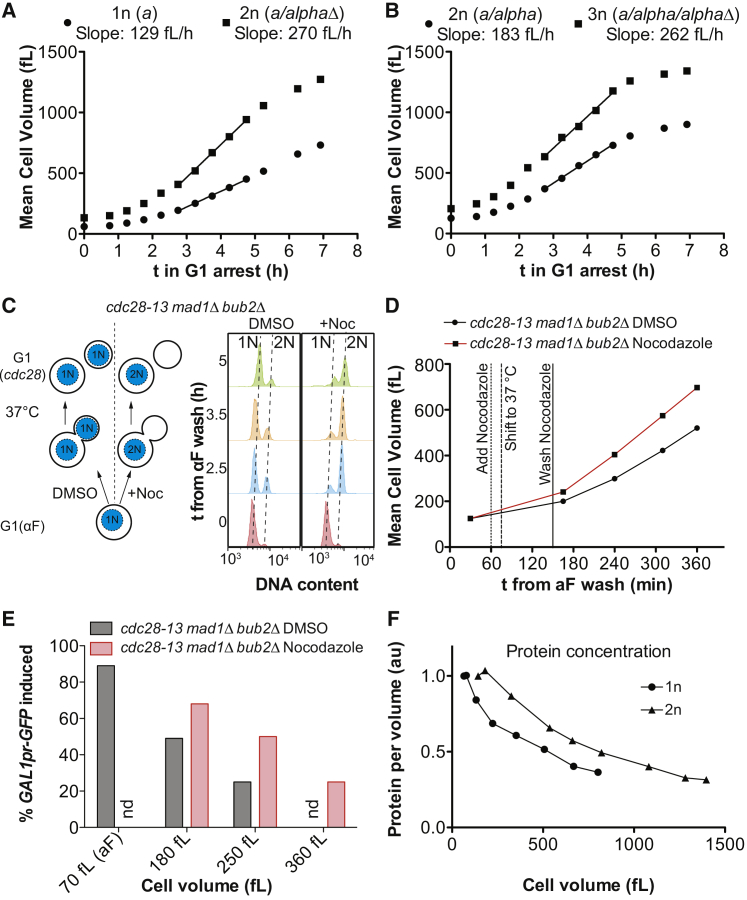
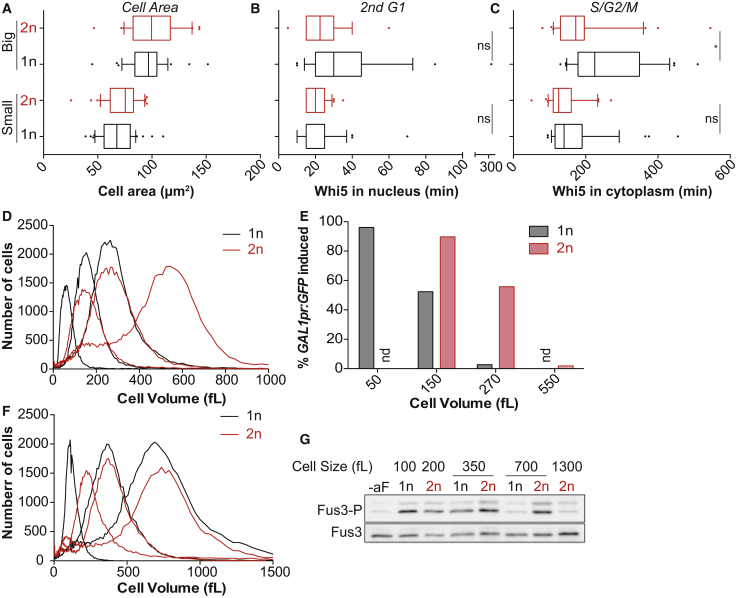
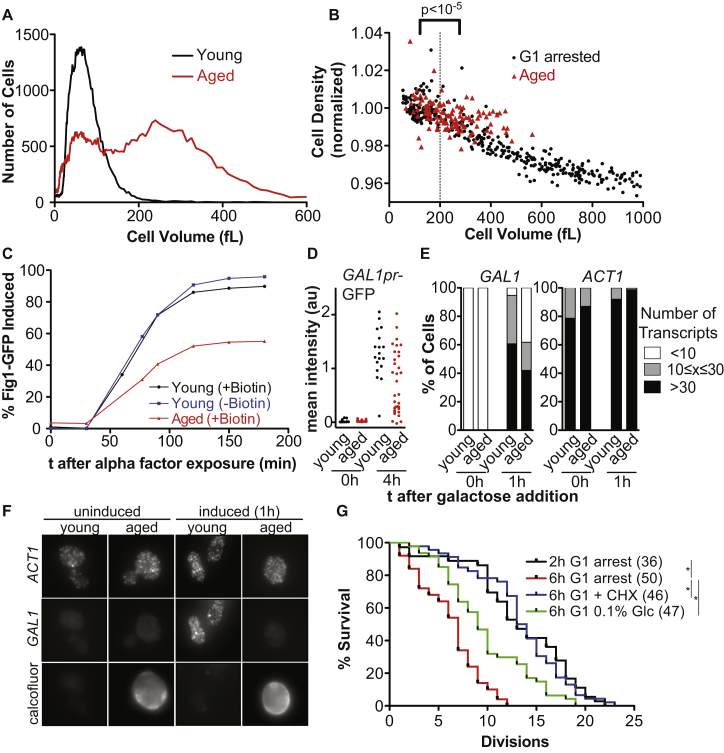
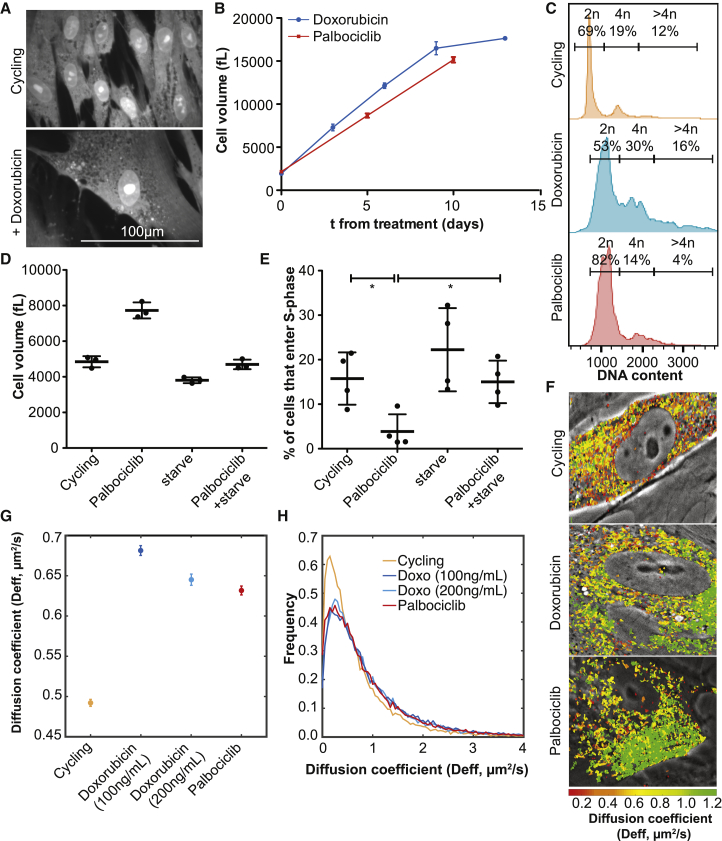
Cell size varies greatly between cell types, yet within a specific cell type and growth condition, cell size is narrowly distributed. Why maintenance of a cell-type specific cell size is important remains poorly understood. Here we show that growing budding yeast and primary mammalian cells beyond a certain size impairs gene induction, cell-cycle progression, and cell signaling. These defects are due to the inability of large cells to scale nucleic acid and protein biosynthesis in accordance with cell volume increase, which effectively leads to cytoplasm dilution. We further show that loss of scaling beyond a certain critical size is due to DNA becoming limiting. Based on the observation that senescent cells are large and exhibit many of the phenotypes of large cells, we propose that the range of DNA:cytoplasm ratio that supports optimal cell function is limited and that ratios outside these bounds contribute to aging.


Figures

None
Graphical abstract
Figure 1
Figure 1
Large Cell Size Impairs Cell Proliferation (A) Left: Logarithmically growing cdc28-13 cells were shifted to 37°C under the indicated growth conditions (CHX = cycloheximide) and volume was determined using a coulter counter. Right: Representative images of a cell before and 6 h after shift to 37°C grown in 2% glucose. (B) 10-fold serial dilutions of cdc28-13 cells arrested at 37°C as indicated were plated and grown at 25°C. (C–H) cdc28-13 cells expressing Whi5-tdTomato and Spc42-GFP (C–E, G, H) or CLN2pr-GFP (F) were arrested at 37°C under the indicated conditions. Cells were shifted to medium containing 2% glucose lacking drugs at 25°C and cell-cycle progression was monitored. Asterisks indicate p < 0.05 (Mann-Whitney U test). See also Figures S1, S2, S3.
Figure S1
Figure S1
Increased Cell Size Delays Cell-Cycle Progression, Related to Figure 1 (A–D) Logarithmically growing cdc28-13 mutant cells expressing a Cln2-HA fusion protein were arrested at 37°C as indicated (CHX = cycloheximide). Cultures were shifted to 25°C in the absence of drugs and samples were taken every 15 min. (A) Percentage of budded cells (100 cells per sample). (B) Abundance of CLN2 mRNA was determined by RT-qPCR and normalized to ACT1 mRNA. (C) Western blot analysis with antibodies against the HA epitope and Kar2 (loading control). (D) DNA content was analyzed by flow cytometry. Asterisks indicate the time point with maximal CLN2 mRNA expression.
Figure S2
Figure S2
Overexpression of cdc28-13 Advances Release from G1 Arrest but Does Not Affect Other Large Size Phenotypes, Related to Figure 1 (A) Western blot analysis of Cdc28-13 expressed from the indicated promoters. Kar2 was used as a loading control. (B) Cell volume measured during a G1 arrest in cells expressing Cdc28-13 from the GPD1 promoter and from the endogenous CDC28 promoter. (C–H) Cells expressing Cdc28-13 from the indicated promoter were arrested at 37°C for the indicated time, shifted to 25°C and imaged. (C–E) Cells expressing Whi5-tdTomato and Spc42-GFP. (F–H) Cells expressing Whi5-tdTomato and CLN2pr-GFP. In (F, H), the data shown for cells expressing Cdc28-13 from its endogenous promoter are the same as those shown in Figures 1F and 2B and are shown here for comparison. (I) GPD1pr-cdc28-13 cells expressing GAL1pr-GFP were arrested as indicated in YEPR (2% raffinose). GAL1pr-GFP was induced by addition of 1% galactose and induction was quantified microscopically. Asterisks indicate p < 0.05 (Mann-Whitney U test).
Figure S3
Figure S3
Cell Size Associated Defects Associated with Prolonged Alpha Factor Arrest of Cells Lacking BNI1, Related to Figure 1 (A and B) BNI1 and bni1Δ cells (both bar1Δ) were arrested in G1 using alpha factor (2 μg/mL) in YEP medium supplemented with either 2% or 0.1% glucose. (A) Cell volume determined on a coulter counter. (B) Representative images of cells treated with alpha factor for the indicated times. (C–E) bni1Δ cells expressing Whi5-tdTomato and CLN2pr-GFP were arrested in G1 with alpha factor as indicated. Alpha factor was removed and cell-cycle progression was analyzed. bni1Δ cells arrested for 4 h with alpha factor had exported Whi5 out of the nucleus before the start of imaging. Cell-cycle phases were therefore measured as cells progressed through the second cell cycle after release from the pheromone arrest. Asterisks indicate p < 0.05 (Mann-Whitney U test). (F) bni1Δ and BNI1 cells expressing GAL1pr-GFP were arrested as indicated in YEPR (2% raffinose) and GAL1pr-GFP was induced by addition of 1% galactose. Induction was quantified microscopically.
Figure 2
Figure 2
Inducible Transcription Is Impaired in Oversized Cells (A–D) Imaging of cells released from a cdc28-13 block expressing Whi5-tdTomato and (A, B) CLN2pr-GFP or (C, D) CLB2pr-GFP into medium containing 2% glucose lacking drugs. Mean GFP intensities were measured on maximal projections and corrected for background and autofluorescence. (A) Traces are aligned when nuclear export of Whi5 was completed. Asterisks indicate p < 0.05 (Mann-Whitney U test). (E–G) cdc28-4 cells were arrested at 35°C as indicated and transcription was induced by addition of galactose or alpha factor (αF). mRNA concentration was determined by (E, F) RT-qPCR relative to ACT1 mRNA or by (G) microarray analysis 0 min and 40 min after αF exposure. Genes induced more than 4-fold in wild-type cells were quantified (27 genes). Asterisks indicate p < 0.01 (Wilcoxon matched-pairs signed rank test). (H) Chromatin immuno-precipitation before and 30 min after galactose addition in arrested cdc28-13 cells, expressing either Gal4-3V5 or 3V5-Gal80. (I) Western blot of phosphorylated Fus3 (P-Fus3) and total Fus3 in cdc28-4 G1 arrested cells 15 min after pheromone exposure. Kar2 was used as a loading control. Asterisks mark P-Fus3 and Fus3. Note: Fus3 phosphorylation occurs most efficiently during G1. Fus3-P in asynchronously growing cells (lane 3) is therefore lower than in small G1 arrested cells (2 h arrest, lane 4). See also Figure S4 and Table S1.
Figure S4
Figure S4
Inefficient Cyclin Induction in Large Cells Causes Checkpoint Independent Cell-Cycle Delays, Related to Figure2 (A) cdc28-13 cells expressing Whi5-tdTomato and CLN2pr-GFP were arrested at 37°C as indicated, shifted to 25°C and imaged. (B) As in A, but cells expressed CLB2pr-GFP. Mean GFP intensity was measured on maximal projections and corrected for background and auto-fluorescence. CLB2pr-GFP tracks were aligned at the GFP intensity minimum.
Figure 3
Figure 3
Macromolecule Biosynthesis Does Not Scale with Cell Size (A–C) Newborn cdc28-13 cells were collected by centrifugal elutriation and arrested at 37°C. (A) Cell volume determined on a coulter counter and (B) growth rate in 4 biological replicates. (C) Volume excluding the vacuole was measured on serial sections of cells expressing Pgk1-mCherry. In an independent experiment, total protein content per cell was determined by Comassie staining of total protein on SDS-PAGE. Soluble protein was determined by Bradford assay in cell lysates prepared without detergent. Total RNA content was measured on a spectrophotometer. (D–G) Logarithmically growing cdc28-13 cells were arrested at 37°C. (D, E) Cells were fixed and total protein was stained using an amine reactive dye and analyzed by flow cytometry. Cell volume was determined as in (C). (F, G) Cells expressing 10 different mCherry- and GFP- fusion proteins were arrested at 37°C for 3 h and 6 h. Representative images in (F). Mean fluorescence intensity in the cytoplasm in (G). (H) Cell volume and density of individual cells arrested in G1 determined on an SMR. See also Figure S5.
Figure S5
Figure S5
Cellular Protein and RNA Quantification during Prolonged G1 arrest, Related to Figure 3 (A–C) Newborn cdc28-13 cells were isolated by centrifugal elutriation and arrested in G1 at 37°C. Equal numbers of cells were collected and total protein was isolated by TCA precipitation of cells, followed by mechanical cell lysis in 8M urea and boiling extracts in 3% SDS. (A) Equal volumes of lysate were run on SDS-PAGE followed by Comassie blue staining. Three biological replicates were performed. (B) Different volumes of extract were loaded as indicated to reduce potential effects of non-linearity in the assay. This gel was used to quantify total protein content for Figure 3C. (C) Quantification of total protein from (A, red) and (B, purple). Soluble protein was extracted by breaking cells in Tris/NaCl (without detergent, complete cell lysis was confirmed microscopically) followed by centrifugation (20 min/21000×g) to clear the lysate. 3 biological replicates were analyzed for cells arrested at 37°C for 1 h, 3 h and 5 h. Protein concentration was analyzed using the Bradford protein assay. Cell volume was measured on a coulter counter (the same data for total cell volume, total protein determined with adjusted input and one replicate of soluble protein quantification are shown in Figure 3C). (D) Same experiment as in (A–C), but isolation of total cellular RNA by phenol extraction followed by ethanol precipitation and column purification. Quantifications were performed before (Qubit assay) and after (Nanodrop) column purification of the RNA. (E and F) cdc28-13 cells were fixed with formaldehyde and subsequently permeabilized in 70% ethanol. Cells were stained with a primary amine reactive dye (Alexa Fluor NHS Ester) to stain total cellular protein and analyzed by flow cytometry. (E) Different numbers of logarithmically growing cells were stained. Cell number is indicated in units of optical density, which correlates with biomass. For logarithmically growing cells, one OD600 unit corresponds to roughly 2107 cells. The same concentration and volume of dye was used for all samples. This analysis shows that the dye does not become limiting. (F) 0.15 OD600 units of logarithmically growing haploid (1n), diploid (2n) and triploid (3n) cells were stained. This analysis confirms that this assay can distinguish protein content in differently sized cells. In addition, it shows that in logarithmically growing cells protein content and forward scatter (an estimate of cell size) correlate. (G) CDC28 and cdc28-4 mutant cells were arrested at 35°C under the indicated conditions. Ten-fold serial dilutions were plated and grown at 25°C on YEPD (2% glucose) or YEPD supplemented with the pan RNA polymerase inhibitor Thiolutin.
Figure 4
Figure 4
RNASeq and Mass Spec Analysis of Oversized Cells Small cdc28-13 cells were isolated by centrifugal elutriation and arrested in G1 at 37°C. (A–C) RNA Seq of a constant number of arrested S. cerevisiae cells of different sizes mixed with a constant number of exponentially growing C. albicans cells before RNA purification. S. cerevisiae reads were normalized to total C. albicans reads (Units are fragments per kb per million C. albicans reads). RNA levels of cells arrested for 3 h (A) and 6 h (B) at 37°C were compared to RNAs of cells arrested for 1h. (C) Gene set enrichment analysis (GSEA) was performed comparing RNA expression levels from cells arrested for 2 h, 2.5 h and 3 h to expression levels from cells arrested for 4.5 h, 5 h and 6 h at 37°C. False discovery rates are indicated in brackets. (D and E) Proteome of equal numbers of cdc28-13 cells arrested for 1 h, 3 h, 5 h and 7 h at 37°C was analyzed. 1 h, 3 h and 5 h arrest points were analyzed in triplicate, the 7 h arrest point in duplicate. 3 h (D) and 7 h (E) time point were compared to the 1 h arrest point. (F) GSEA analysis comparing the 3 h and 5 h time points. The gray line in A-B, D-E indicates where individual data points would fall if gene expression level increased proportional to cell volume (excluding vacuole) increase. See also Figure S6 and Tables S2, S3.
Figure S6
Figure S6
Oversized Cells Induce the Environmental Stress Response (ESR) that Attenuates Macromolecule Synthesis, Related to Figure 4 (A) Data from RNASeq experiment shown in Figure 4. Newborn cdc28-13 cells were isolated by centrifugal elutriation and arrested at 37°C and processed for RNA Seq. Analysis of relative expression levels of ESR genes: A single sample GSEA projection for 279 stress induced and 584 stress repressed genes was generated for each sample and row centered (see Methods). (B and C) Nuclear localization of Sfp1-GFP was analyzed in cdc28-4 cells expressing Sfp1-GFP and NLS-mCherry at permissive temperature (asynchronous), after treatment with rapamycin (1 μM for 30 min) and after the indicated times at 35°C. Quantification of mean nuclear Sfp1-GFP intensity is shown in (C). (D and E) The switch from exponential to linear growth and activation of the ESR are not a consequence of low nutrient concentrations in the growth medium after prolonged G1 arrest: Newborn cdc28-13 cells were isolated by centrifugal elutriation, arrested in G1 at 37°C and diluted to the indicated cell densities 30 min after cell isolation. (D) Cell volume was analyzed on a coulter counter and RNA samples were collected for RNA Seq analysis. (E) ESR strength was determined as described in (A). As comparison, elutriated cells used for other experiments were diluted to an optical density of 0.3 at the same time point of the arrest. (F and G): Newborn cdc28-13 cells were isolated by centrifugal elutriation and arrested in G1 at 37°C. 1 h after cell isolation, 5 nM Rapamycin was added. Samples were taken for RNA Seq analysis: an equal number of arrested cells was mixed with a constant number of logarithmically growing C. albicans cells prior to RNA purification. (F) Total S. cerevisiae RNA normalized to total C. albicans RNA are shown and cell volume was determined on a coulter counter. Total protein was determined from a different experiment and is shown on the same graph for comparison: cdc28-13 cells from a logarithmically growing culture were arrested in G1 at 37°C. Cells were fixed and total cellular protein was stained and quantified using flow cytometry. Data points are normalized to the 1 h arrest time point. (G) ESR strength was determined as described in A. All samples (±Rapamycin) were used for center normalization. The data shown for the 1 h time point is the same in the upper and lower panel (prior to Rapamycin addition).
Figure S7
Figure S7
DNA Content Limits Growth Rate and Cell Function in Large Cells, Related to Figure 5 (A and B) Logarithmically growing haploid (1n), diploid (2n) and triploid (3n) cells homozygous for cdc28-13 were arrested in G1 at 37°C and cell volume was determined on a coulter counter. The genotype at the MAT locus is indicated. (C and D) cdc28-13 mad1Δ bub2Δ cells were grown in YEPD (2% glucose) and arrested in G1 using alpha factor pheromone for 2 h at 25°C. Subsequently, alpha factor was washed out and cells were released at 25°C into fresh medium. 60 min after alpha factor washout, nocodazole or DMSO were added and 15 min later, cultures were shifted to 37°C. Nocodazole and DMSO were removed 2.5 h after the alpha factor washout. (C) Left: Schematic of the experiment. Right: DNA content was determined by flow cytometry and (D) cell volume was measured on a coulter counter. (E) cdc28-13 mad1Δ bub2Δ mutant cells expressing GAL1pr-GFP were treated essentially as described in (C and D) but the arrest was performed in YEPR (2% raffinose) and nocodazole washout was performed at 3.2 h after release from the alpha factor block. GAL1pr-GFP expression was induced 4 h, 5 h and 6 h after alpha factor washout at 25°C by addition of 1% galactose. Samples were taken 3 h after galactose addition and GFP expression was analyzed by flow cytometry. Percent of cells that express GFP in equally sized cell populations is shown. Mean cell volume and arrest times were as follows. DMSO treated samples: (180 fL) – 192 fL, 5 h arrest, (250 fL) – 286 fL, 6 h arrest; Nocodazole treated samples: (180 fL) – 183 fL, 4 h arrest, (250 fL) – 256 fL, 5 h arrest, (360 fL) – 363 fL, 6 h arrest. (F) Haploid (1n) and diploid (2n) logarithmically growing cdc28-13 cells were arrested at 37°C. Cells were fixed and total protein was stained and analyzed on a flow cytometer. Cell volume was determined on a coulter counter. Protein/volume ratio was normalized to logarithmically growing cells.
Figure 5
Figure 5
Low DNA:cytoplasm ratio causes large cell phenotypes (A–C) Haploid (1n) and diploid (2n) cdc28-13 cells expressing Whi5-tdTomato were arrested for different times in G1 to reach an equal cell size (arrest times: 1n: 3 h 30 min, 6 h 15 min; 2n: 2 h 15, 3 h 30 min). Cells were shifted to 25°C and imaged. (D and E) Haploid and diploid cdc28-13 cells expressing GAL1pr-GFP were arrested in raffinose for different amounts of time for cells to reach the same size (arrest times: 1n: 1 h, 4 h, 6 h; 2n: 1 h 30, 3 h, 5 h). GAL1pr-GFP was induced by addition of 1% galactose and GFP expression analyzed by FACS 3 h after galactose addition. (F and G) haploid (MATa) and diploid (MATa/alphaΔ) cdc28-13 cells were arrested for different amounts of time for cells to reach the same size (arrest times: 1n: 1 h 20 min, 3 h 45 min, 6 h 15 min; 2n: 1 h 20 min, 2 h 20 min, 3 h 45 min, 6 h 15 min) and exposed to alpha factor for 5 min to analyze Fus3 phosphorylation. See also Figure S7.
Figure 6
Figure 6
Effects of cell size on replicative aging (A–C) Aged wild-type yeast cells were isolated (50% purity). Average age of old cells was 16.3 ± 2.8 cell divisions, young cells were less than 2 divisions old. (A) Cell volume measured on a coulter counter and (B) cell volume and density measured on an SMR. Data pooled from 3 measurements were normalized to cell density of cells < 200 fL. For comparison, the data of the aged cells are compared to the density of large young cells shown in Figure 3H. (C) Young unlabeled (age: < 2), Young (age: 5.4 ± 1.7) and aged (age: 17.2 ± 1.8) cells labeled with Biotin expressing FIG1-GFP (hmlΔ) were exposed to 20 μg/mL alpha factor to analyze Fig1-GFP expression (FACS). (D) GAL1pr-GFP induction in young (age: 1.6 ± 1.5) and aged (age: 10.5 ± 2.2) cells (microscope). (E, F) Single molecule RNA FISH in cells before (n > 50) or after 1 h (n > 150) of galactose addition (age: young = 2.0 ± 1.4, old = 14.0 ± 2.6). (E) Quantification of ACT1 mRNA (control) and GAL1 mRNA. (F) Representative images. Calcofluor staining identifies old cells. (G) Pedigree analysis of GPD1pr-cdc28-13 expressing cells released from the indicated G1 arrest. Asterisks indicate statistical significant (p < 0.01) median survival (Mann-Whitney U test). Number of cells included in the analysis is shown in brackets.
Figure 7
Figure 7
Increased cell size interferes with proliferation in human fibroblasts (A–C) IMR90 cells were treated with Doxorubicin or Palbociclib. (A) Representative images of cells stained with an amine reactive dye. (B) Cell volume was determined on a coulter counter. Error bars show standard deviation of three biological replicates. (C) DNA content determined by flow cytometry. (D and E) IMR90 cells were arrested in G1 with Palbociclib (1 μM) and grown in either 10% FBS or 0.2% FBS (starve). After 4 days, cell volume (D) was determined, Palbociclib removed, and EdU incorporation assayed 48 h thereafter (E). Asterisks indicate p < 0.05 (Student’s t test). (F–H) IMR90 cells expressing genetically encoded fluorescent nanoparticles (40 nm) were treated with Doxorubicin or Palbociclib and diffusion rates determined. (G, H) Diffusion coefficients in treated samples were significantly different from the controls (p < 510−120, Kolmogorov-Smirnov Test, Error bars show SEM).

Comment in

References

    1. Atay O., Skotheim J.M. Spatial and temporal signal processing and decision making by MAPK pathways. J. Cell Biol. 2017;216:317–330. - PMC - PubMed
    1. Baldwin W.W., Kubitschek H.E. Buoyant density variation during the cell cycle of Saccharomyces cerevisiae. J. Bacteriol. 1984;158:701–704. - PMC - PubMed
    1. Biran A., Zada L., Abou Karam P., Vadai E., Roitman L., Ovadya Y., Porat Z., Krizhanovsky V. Quantitative identification of senescent cells in aging and disease. Aging Cell. 2017;16:661–671. - PMC - PubMed
    1. Bryan A.K., Goranov A., Amon A., Manalis S.R. Measurement of mass, density, and volume during the cell cycle of yeast. Proc. Natl. Acad. Sci. USA. 2010;107:999–1004. - PMC - PubMed
    1. Cermak N., Olcum S., Delgado F.F., Wasserman S.C., Payer K.R.A., A Murakami M., Knudsen S.M., Kimmerling R.J., Stevens M.M., Kikuchi Y. High-throughput measurement of single-cell growth rates using serial microfluidic mass sensor arrays. Nat. Biotechnol. 2016;34:1052–1059. - PMC - PubMed

Publication types

MeSH terms