. 2017 Fall;2017(2):1-87.
doi: 10.1353/eca.2017.0012.

Where Have All the Workers Gone? An Inquiry into the Decline of the U.S. Labor Force Participation Rate

Affiliations

Where Have All the Workers Gone? An Inquiry into the Decline of the U.S. Labor Force Participation Rate

Alan B Krueger. Brookings Pap Econ Act. 2017 Fall.

Abstract

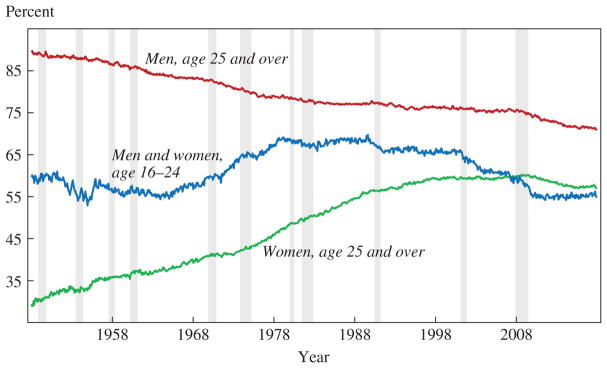
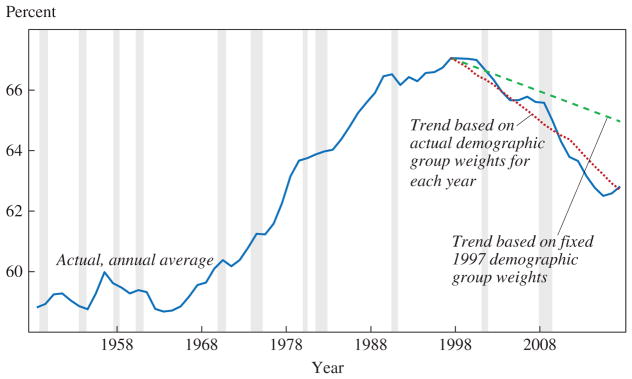
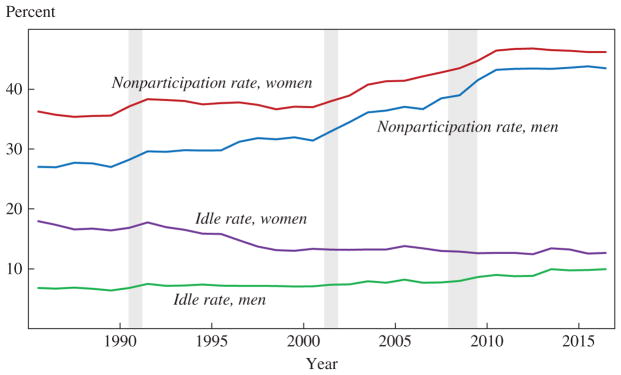
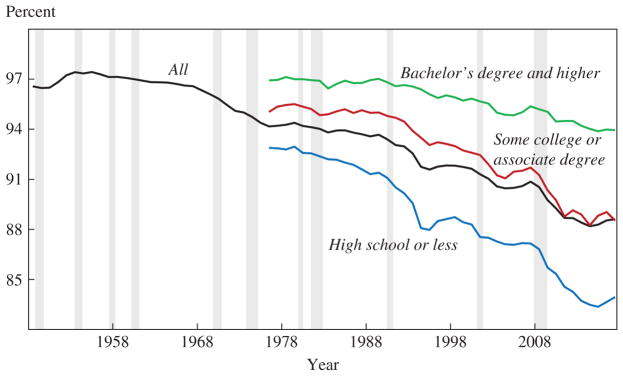
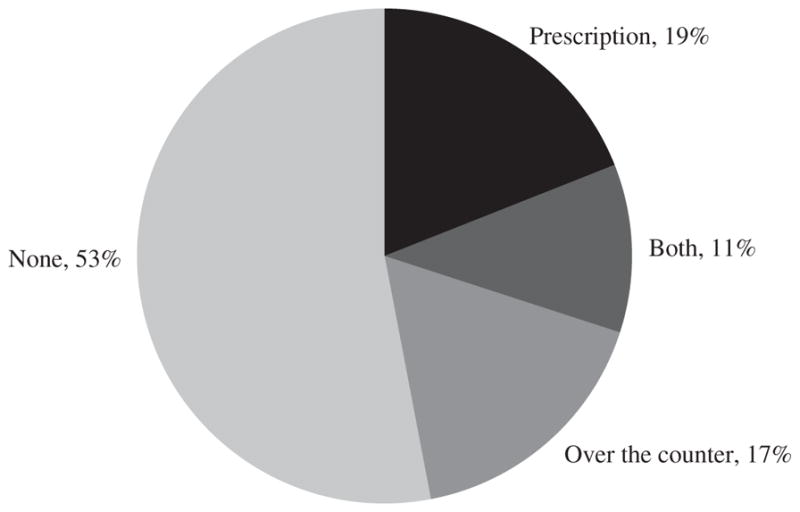
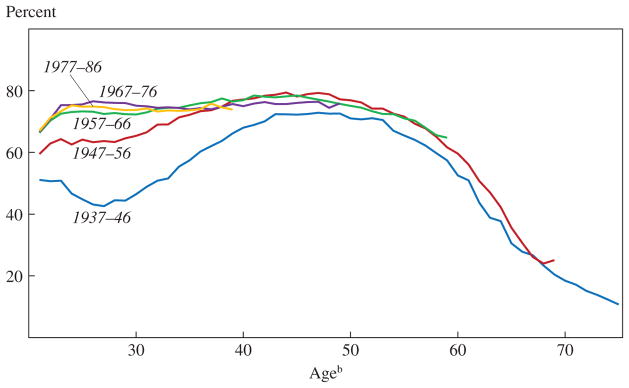
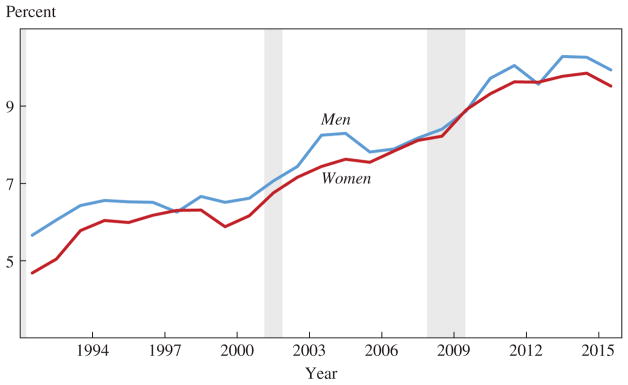
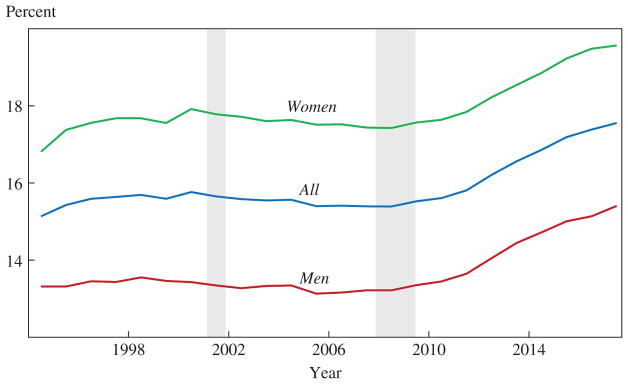
The U.S. labor force participation rate has declined since 2007, primarily because of population aging and ongoing trends that preceded the Great Recession. The labor force participation rate has evolved differently, and for different reasons, across demographic groups. A rise in school enrollment has largely offset declining labor force participation for young workers since the 1990s. Labor force participation has been declining for prime age men for decades, and about half of prime age men who are not in the labor force may have a serious health condition that is a barrier to working. Nearly half of prime age men who are not in the labor force take pain medication on any given day; and in nearly two-thirds of these cases, they take prescription pain medication. Labor force participation has fallen more in U.S. counties where relatively more opioid pain medication is prescribed, causing the problem of depressed labor force participation and the opioid crisis to become intertwined. The labor force participation rate has stopped rising for cohorts of women born after 1960. Prime age men who are out of the labor force report that they experience notably low levels of emotional well-being throughout their days, and that they derive relatively little meaning from their daily activities. Employed women and women not in the labor force, by contrast, report similar levels of subjective well-being; but women not in the labor force who cite a reason other than "home responsibilities" as their main reason report notably low levels of emotional well-being. During the past decade, retirements have increased by about the same amount as aggregate labor force participation has.


Conflict of interest statement

Conflict of Interest Disclosure: The author received financial support for this work from the Federal Reserve Bank of Boston and the National Institute on Aging. With the exception of the aforementioned, the author did not receive financial support from any firm or person for this paper or from any firm or person with a financial or political interest in this paper. He is currently not an officer, director, or board member of any organization with an interest in this paper. No outside party had the right to review this paper before publication. declined, and the retirement rate is expected to continue to rise. A meaningful rise in labor force participation will require a reversal in the secular trends affecting various demographic groups, and perhaps immigration reform.

Figures

Figure 1
Figure 1
The U.S. Labor Force Participation Rate, 1948–2017a Sources: U.S. Bureau of Labor Statistics; National Bureau of Economic Research; author’s calculations. a. Shading denotes recessions. The data are seasonally adjusted. b. Data for 1990 to 2016 have been adjusted to account for the effects of the annual population control adjustments to the Current Population Survey.
Figure 2
Figure 2
Labor Force Participation Rates by Age and Gender, 1948–2017a Sources: U.S. Bureau of Labor Statistics; National Bureau of Economic Research. a. Shading denotes recessions. The data are seasonally adjusted.
Figure 3
Figure 3
Labor Force Participation Rate, 1948–2017a Sources: U.S. Bureau of Labor Statistics; National Bureau of Economic Research; author’s calculations. a. Shading denotes recessions. The data are not seasonally adjusted, annual averages. The 2017 data point is the average of data from January through June. Data for 1990 to 2016 have been adjusted to account for the effects of the annual population control adjustments to the Current Population Survey.
Figure 4
Figure 4
Labor Force Nonparticipation and Idle Rates by Gender for Age 16–24, 1985–2016a Sources: U.S. Bureau of Labor Statistics; National Bureau of Economic Research. a. Shading denotes recessions. The data are not seasonally adjusted, annual averages. “Idle” refers to persons who are neither enrolled in school nor participating in the labor force.
Figure 5
Figure 5
The Labor Force Participation Rate for Men Age 25–54 by Educational Attainment, 1948–2017a Sources: U.S. Bureau of Labor Statistics; National Bureau of Economic Research. a. Shading denotes recessions. The data are not seasonally adjusted, annual averages. The 2017 data point is the average of data from January through May.
Figure 6
Figure 6
Probability of Men Age 25–54 Not Being in the Labor Force, 2009–17 Sources: Current Population Survey; author’s calculations. a. The 2017 data point is the average of data from January through May. b. The bar heights are averages of data from January 2009 through May 2017.
Figure 7
Figure 7
Percentage of Men Age 25–54 Reporting Pain, by Labor Force Status, and Probability of Men Age 25–54 Being Employed, by Pain Status, 1997–2015a Sources: Centers for Disease Control and Prevention, National Health Interview Survey; National Bureau of Economic Research; author’s calculations. a. Shading denotes recessions. Pain must last a whole day or more, and includes back pain, neck pain, leg pain, jaw pain, severe headaches, and migraines. The intervals shown for each year represent one standard error. b. Not employed includes both unemployed and not in the labor force.
Figure 8
Figure 8
Consumption of Pain Medication by Men Age 25–54 Who Are Out of the Labor Forcea Source: Princeton Pain Survey. a. The data are based on 571 responses to the question, “Did you take any pain medication yesterday?” The survey was administered between September 30, 2016, and October 2, 2016.
Figure 9
Figure 9
Female Labor Force Participation Rates by Birth Cohort and Agea Sources: Current Population Survey, Annual Social and Economic Supplement; National Bureau of Economic Research; author’s calculations. a. The data are from 1962 to 2016. The line captions mark the birth year cohorts. b. The horizontal axis marks the age of the middle birth year cohort.
Figure 10
Figure 10
Persons Age 25–54 Who Were Not in the Labor Force during the Past Year for Reasons Other Than “Home Responsibilities,” 1991–2015a Sources: Current Population Survey, Annual Social and Economic Supplement (data provided by Steven Hipple); U.S. Bureau of Labor Statistics (data provided by Steven Hipple); National Bureau of Economic Research. a. Shading denotes recessions.
Figure 11
Figure 11
Retirement Rates by Gender, 1994–2017a Sources: Current Population Survey; National Bureau of Economic Research; author’s calculations. a. Shading denotes recessions. The retirement rate is the share of the population age 16 and older that reports being retired. The data are not seasonally adjusted, annual averages. The 2017 data point is the average of data from January through May.
Figure 12
Figure 12
Cumulative Distributions of Cantril Ladder by Age and Gendera Source: U.S. Bureau of Labor Statistics, American Time Use Survey, Well-Being Module. a. The sample is pooled over 2012 and 2013. The Cantril ladder question is weighted using the Well-Being Module’s final weights, and is measured on a 0–10 scale from “worst possible life” to “best possible life.” See the text for the exact wording of the survey question.
Figure 12
Figure 12
Cumulative Distributions of Cantril Ladder by Age and Gendera Source: U.S. Bureau of Labor Statistics, American Time Use Survey, Well-Being Module. a. The sample is pooled over 2012 and 2013. The Cantril ladder question is weighted using the Well-Being Module’s final weights, and is measured on a 0–10 scale from “worst possible life” to “best possible life.” See the text for the exact wording of the survey question.

References

    1. Aaronson Stephanie, Cajner Tomaz, Fallick Bruce, Galbis-Reig Felix, Smith Christopher, Wascher William. Labor Force Participation: Recent Developments and Future Prospects. Brookings Papers on Economic Activity, Fall. 2014:197–255.
    1. Aaronson Stephanie, Fallick Bruce, Figura Andrew, Pingle Jonathan, Wascher William. The Recent Decline in the Labor Force Participation Rate and Its Implications for Potential Labor Supply. Brookings Papers on Economic Activity. 2006 Spring;:69–134.
    1. Abraham Katharine G, Kearney Melissa S. Working Paper no. 24333. Cambridge, Mass: National Bureau of Economic Research; 2018. Explaining the Decline in the U.S. Employment-to-Population Ratio: A Review of the Evidence.
    1. Aguiar Mark, Bils Mark, Charles Kerwin Kofi, Hurst Erik. Working Paper no. 23552. Cambridge, Mass: National Bureau of Economic Research; 2017. Leisure Luxuries and the Labor Supply of Young Men.
    1. Autor David H, Dorn David, Hanson Gordon H. The China Syndrome: Local Labor Market Effects of Import Competition in the United States. American Economic Review. 2013;103(6):2121–68.

LinkOut - more resources