. 2019 May 1:323:1-15.
doi: 10.1016/j.icarus.2019.01.012. Epub 2019 Jan 21.

Near-equilibrium isotope fractionation during planetesimal evaporation

Affiliations

Near-equilibrium isotope fractionation during planetesimal evaporation

E D Young et al. Icarus. .

Abstract

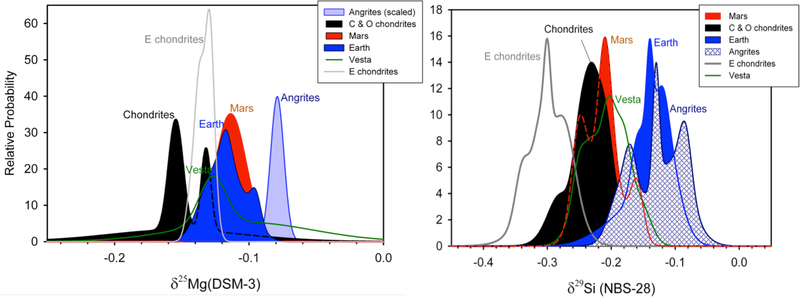
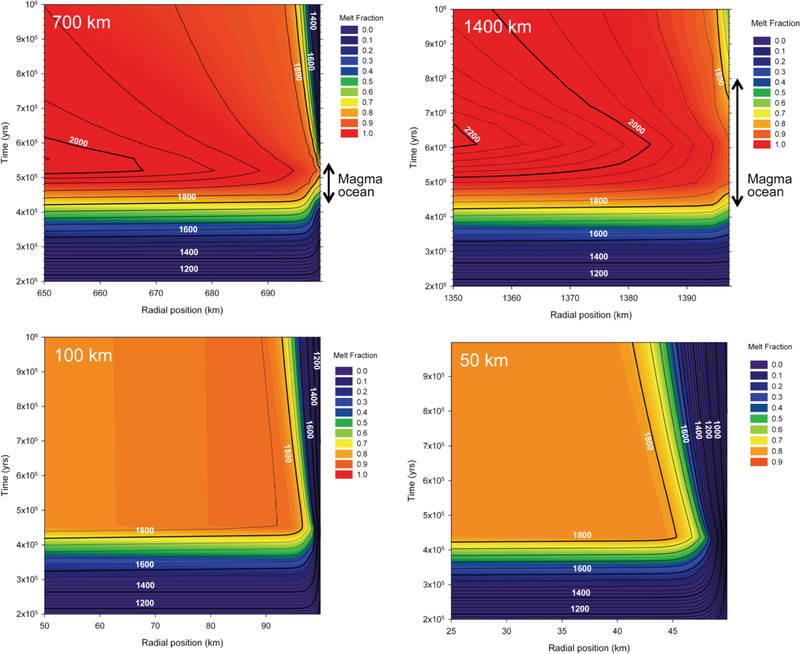
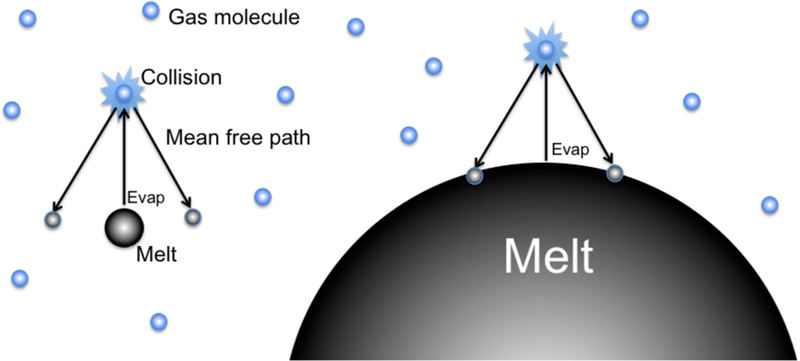
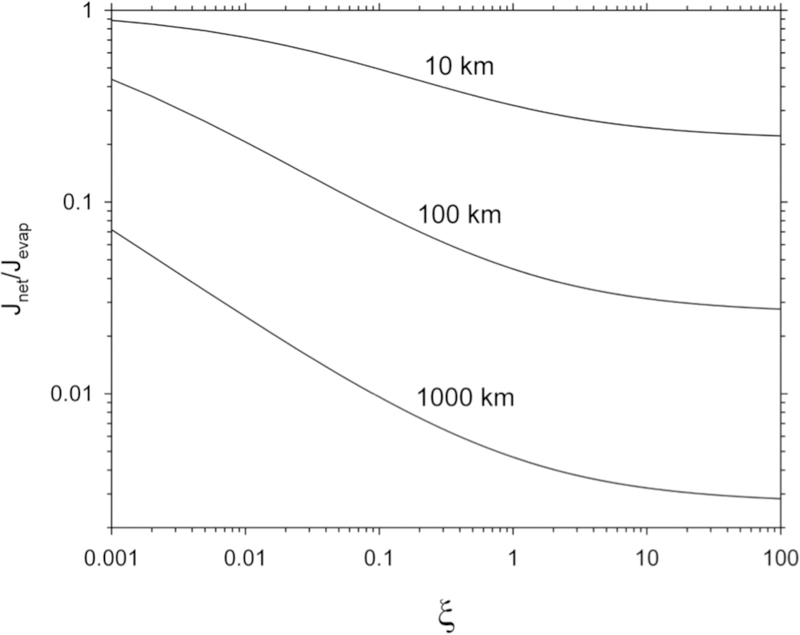
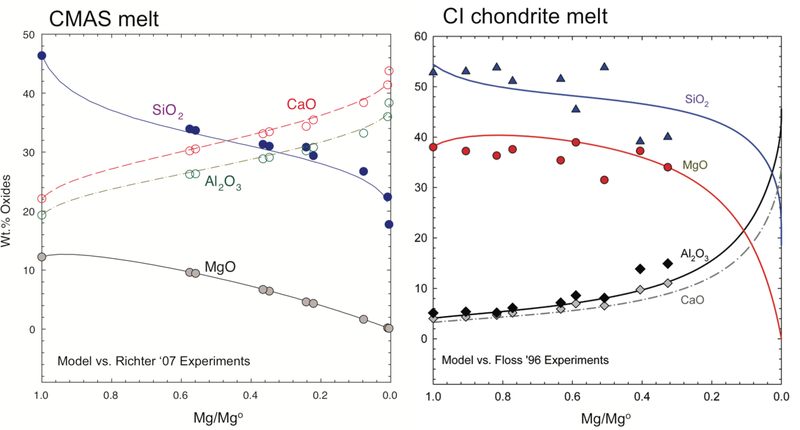
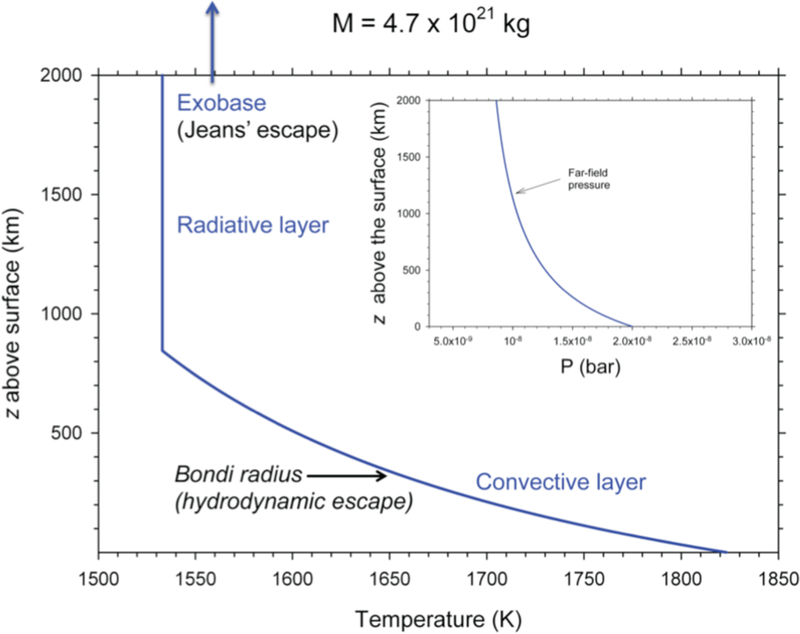
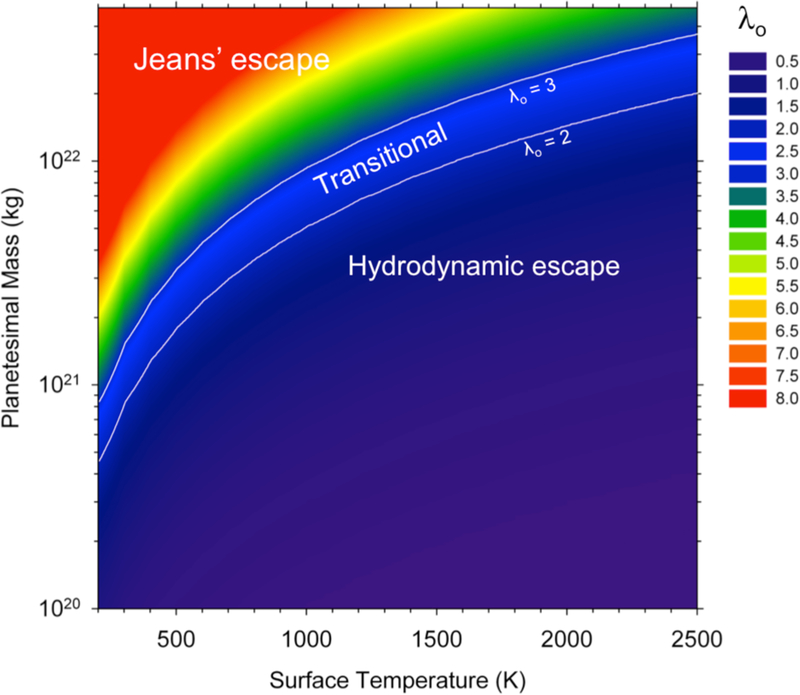
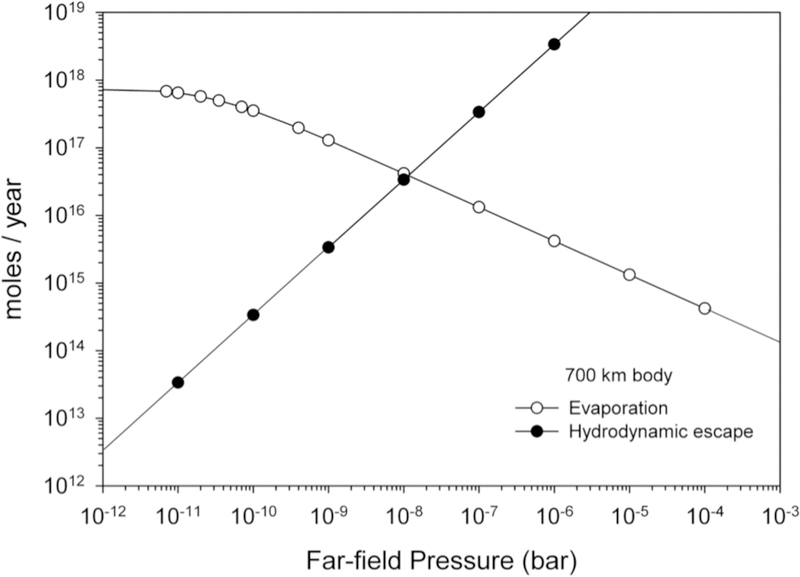
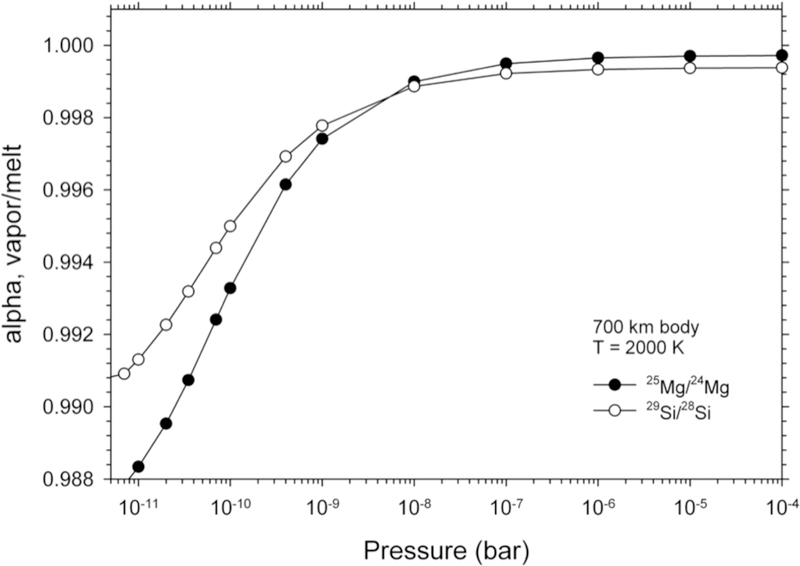
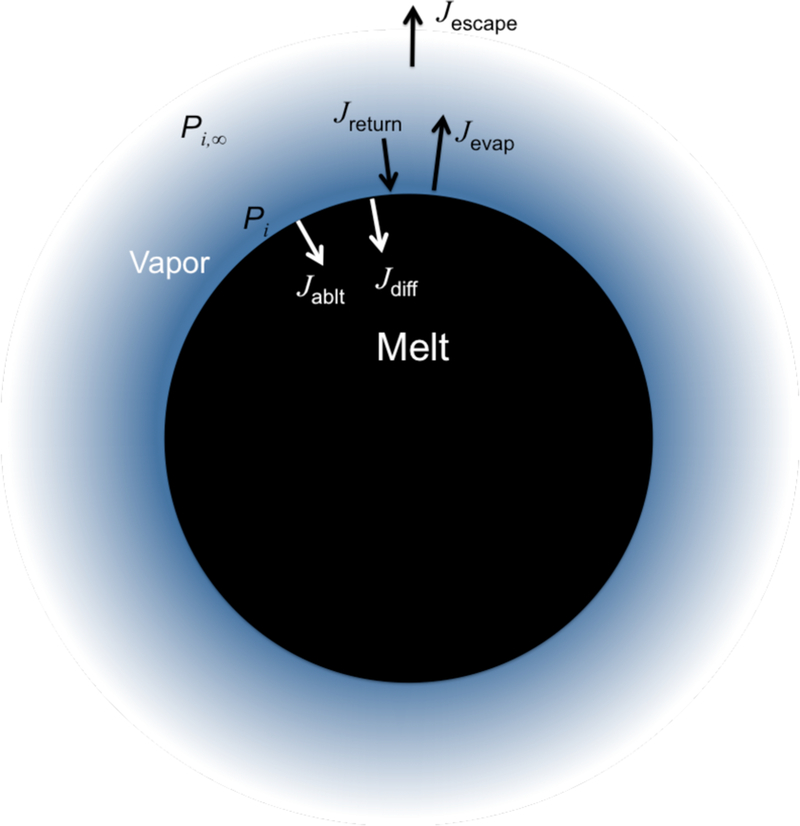
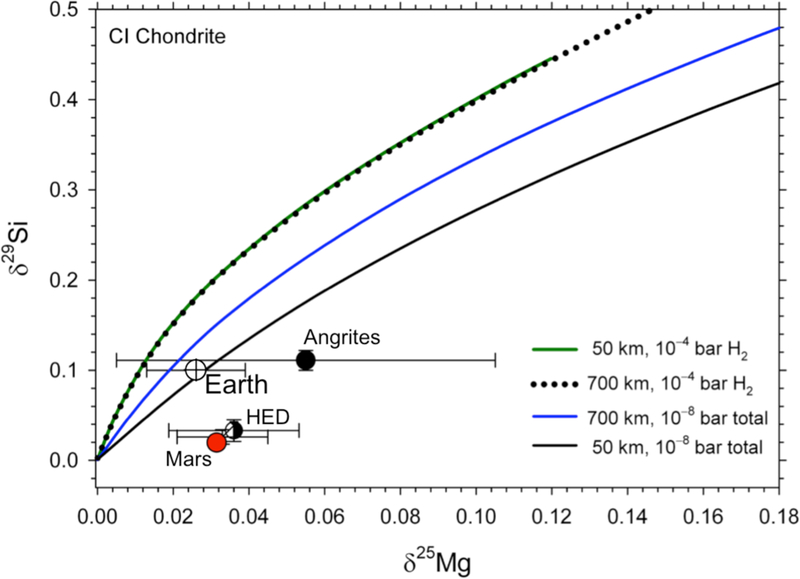
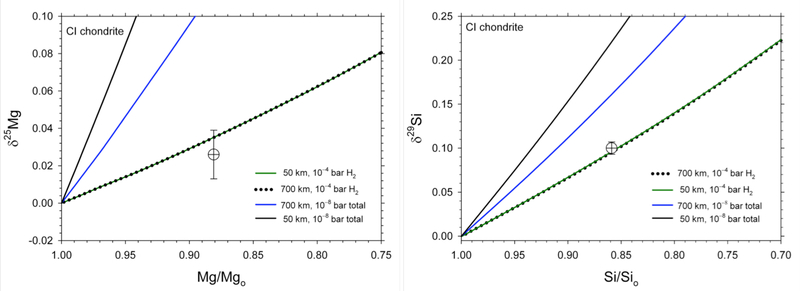
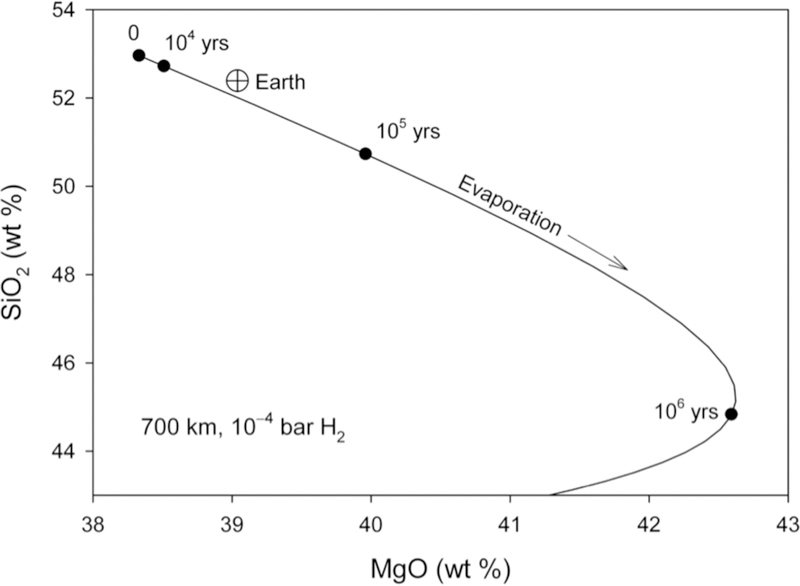
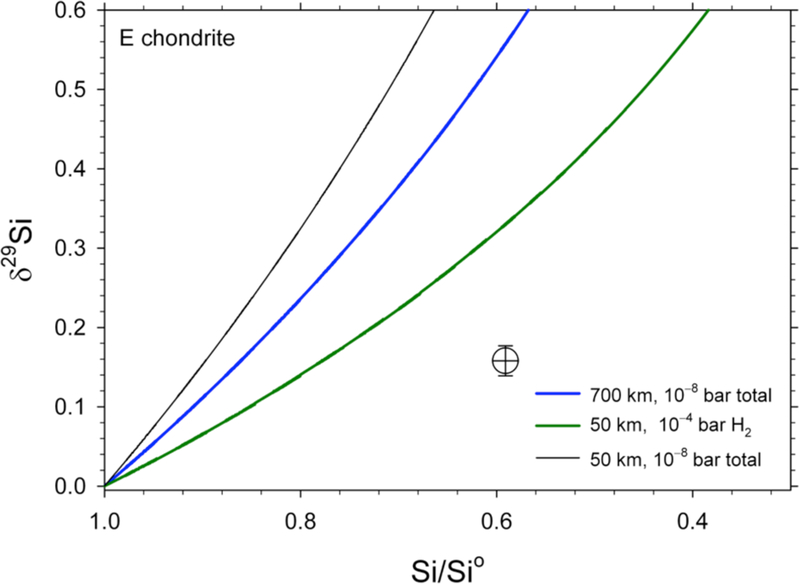
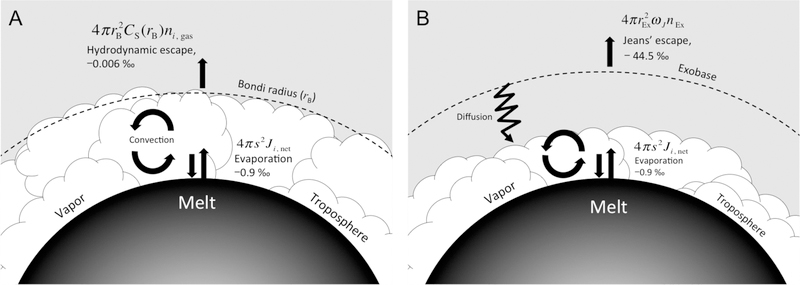
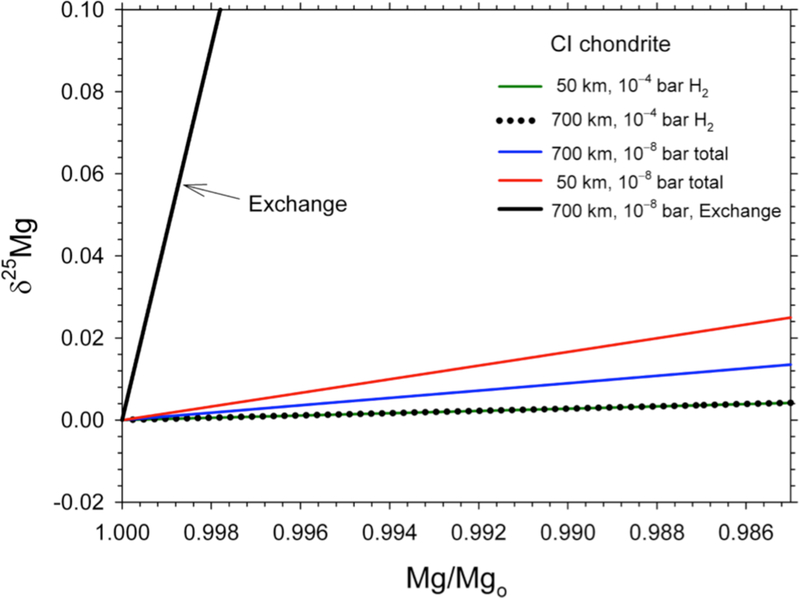
Silicon and Mg in differentiated rocky bodies exhibit heavy isotope enrichments that have been attributed to evaporation of partially or entirely molten planetesimals. We evaluate the mechanisms of planetesimal evaporation in the early solar system and the conditions that controled attendant isotope fractionations. Energy balance at the surface of a body accreted within ~1 Myr of CAI formation and heated from within by 26Al decay results in internal temperatures exceeding the silicate solidus, producing a transient magma ocean with a thin surface boundary layer of order < 1 meter that would be subject to foundering. Bodies that are massive enough to form magma oceans by radioisotope decay (≥ 0.1% M ) can retain hot rock vapor even in the absence of ambient nebular gas. We find that a steady-state rock vapor forms within minutes to hours and results from a balance between rates of magma evaporation and atmospheric escape. Vapor pressure buildup adjacent to the surfaces of the evaporating magmas would have inevitably led to an approach to equilibrium isotope partitioning between the vapor phase and the silicate melt. Numerical simulations of this near-equilibrium evaporation process for a body with a radius of ~ 700 km yield a steady-state far-field vapor pressure of 10-8 bar and a vapor pressure at the surface of 10-4 bar, corresponding to 95% saturation. Approaches to equilibrium isotope fractionation between vapor and melt should have been the norm during planet formation due to the formation of steady-state rock vapor atmospheres and/or the presence of protostellar gas. We model the Si and Mg isotopic composition of bulk Earth as a consequence of accretion of planetesimals that evaporated subject to the conditions described above. The results show that the best fit to bulk Earth is for a carbonaceous chondrite-like source material with about 12% loss of Mg and 15% loss of Si resulting from near-equilibrium evaporation into the solar protostellar disk of H2 on timescales of 104 to 105 years.

Keywords: Asteroids; Cosmochemistry; Planetesimals; composition.


Conflict of interest statement

Declarions of interest: none

Figures

Figure 1.
Figure 1.
Literature compilation of 25Mg/24Mg and 29Si/28Si for various solar system rocky bodies (Pringle et al. 2013; Savage and Moynier 2013; Zambardi et al. 2013; Hin et al. 2017) represented here as probability density plots. Both isotope ratios are shown as per mil deviations from the standard DSM-3 and NBS-28 materials for Mg and Si, respectively.
Figure 2.
Figure 2.
Results of thermal models for planetesimals with radii ranging from 50 km to 1400 km that accreted 0.2 Myr post CAI from chondritic material. The abscissa and ordinate in each panel are the radial position in the body and time elapsed after instantaneous accretion, respectively. Colors represent melt fractions while contours show temperature in degrees K. Only the outer-most few kilometers are shown for illustration. A magma ocean exposed to the surface is viable for the two largest bodies depicted here, but not the two smaller bodies. The approximate durations of the surface magma oceans are shown by vertical arrows.
Figure 3.
Figure 3.
Schematic illustration of the effect of droplet size on return flux of gas. Evaporation is depicted by the upward vertical arrows. Evaporated molecules (small black spheres) collide with surrounding gas molecules (blue spheres). Droplets that are small in diameter compared with the mean free path (left side) capture less of the return flux than droplets that are large relative to the mean free path (right side).
Figure 4.
Figure 4.
Plot of the ratio of net flux to evaporation flux vs dimensionless time ξ for an evaporating spherical body according to Equation (7) with DMg evaluated at 2000 K and 10−8 bar total pressure. Contours for three planetesimal radii, s, are shown.
Figure 5.
Figure 5.
Left: UCLA model for evaporation of a CMAS melt compared with experiments at 1675K for the same bulk composition (Richter et al. 2007). Right: UCLA model applied to evaporation of a carbonaceous chondrite bulk composition compared with experiments on evaporation of the Allende chondrite (Floss et al. 1996) projected into the iron-free CMAS composition space. The abscissa is the mass of Mg relative to the initial mass of Mg, Mgo.
Figure 6.
Figure 6.
Rock vapor atmospheric temperature and pressure as a function of altitude above the melt surface z based on the calculations described in the text for a body that has a mass ~ ½ that of Pluto. Above the Bondi radius that is within the troposphere in this example, the atmosphere would no longer be bound, but the complete profile with z is shown for reference.
Figure 7.
Figure 7.
Contours of the escape parameter evaluated at the melt surface, λO, of bodies with different masses and surface temperatures.
Figure 8.
Figure 8.
Comparison of the surface-integrated fluxes due to evaporation of a molten body half the mass of Pluto composed of E chondrite, excluding iron (E chondrite bulk composition projected into the CMAS composition space) and hydrodynamic escape of the resulting atmosphere. The cross-over pressure represents the steady-state pressure of the rock-vapor atmosphere surrounding the body.
Figure 9.
Figure 9.
Net isotope fractionation factors for 25Mg/24Mg and 29Si/28Si as a function of total far-field gas pressure based on Equation (9). These results are for the same body depicted in Figure 8.
Figure 10.
Figure 10.
Schematic illustrating the fluxes involved in evaporation of a magma ocean body with a rock vapor atmosphere. See text for definitions.
Figure 11.
Figure 11.
Model curves depicting the Mg and Si isotopic compositions of planetesimals of CI composition subjected to evaporation. Each point on the curves represents a particular time during the evaporation process. Four models representing two different planetesimal radii and two different pressure environments are shown. The 700 km model at 10−8 bar represents evaporation that forms a steady-state rock vapor for the ½ MPluto body absent protostellar nebular gas. The 700 km and 50 km bodies at 10−4 bar of H2 represent evaporation in the presence of protostellar gas. Estimates for the isotopic compositions of silicate Earth, Mars, the HED parent body (Vesta), and the angrite parent body are shown for reference (same data sources as for Figure 1).
Figure 12.
Figure 12.
Mg and Si isotopic shifts with evaporation of CI-like planetesimals vs. fractions of Mg and Si remaining in the melt, respectively. The composition of Earth as represented by BSE relative to a CI chondrite starting material is shown for comparison (circle with cross).
Figure 13.
Figure 13.
Plot of weight per cent SiO2 vs MgO for the ½ MPluto evaporation model based on a CI starting composition projected into the CMAS chemical system. Earth is shown for comparison (circle with cross). Black dots mark the time evolution, suggesting a cessation of evaporation between ~ 104 and 105 years.
Figure 14.
Figure 14.
Mg and Si isotopic shifts with evaporation of E chondrite-like planetesimals vs. fractions of M and Si remaining in the melt, respectively. The composition of Earth relative to the EL chondrit starting material is shown for comparison (circle with cross).
Figure 15.
Figure 15.
Schematic illustration of the balance between evaporative losses of Mg gas from a molten silicate surface and concurrent losses of Mg from the vapor by either hydrodynamic escape (A) or Jeans’ escape (B). The 25Mg/24Mg isotopic fractionation of the gas emanating from the melt (−0.9 ‰ relative to the melt) and that of the gas leaving the atmosphere (−0.006 and −44.5 ‰ for hydrodynamic escape and Jeans’ escape relative to the gas, respectively) are shown in both cases. The positions of the Bondi radius and the exobase relative to the mixed layer (troposphere) are indicated for the two different scenarios by the dashed curves. Mixing by convection is indicated by the circular arrows and possible mixing by diffusion is shown by the zigzag arrow.
Figure 16.
Figure 16.
Melt δ25Mg vs. Mg/Mgo due to exchange between melt and a steady-state rock vapor atmosphere affected by Jeans’ escape (steep, heavy black curve). Calculations are described in the text. Curves from Figure 12 are shown for comparison.

References

    1. Alexander CMOD (2001) Exploration of quantitative kinetic models for the evaporation of silicate melts in vacuum and in hydrogen. Meteoritical & Planetary Science 36: 255–283
    1. Badro J, Brodholt JP, Piet H, Siebert J and Ryerson FJ (2015) Core formation and core composition from coupled geochemical and geophysical constraints. Proceedings of the National Academy of Sciences 112: 12310–12314 - PMC - PubMed
    1. Carslaw HS and Jaeger JC (1959). Conduction of Heat in Solids Oxford, Clarendon Press.
    1. Carter PJ, Leinhardt Z, Elliott T, Walter MJ and Stewart ST (2015) Compositional evolution during rocky protoplanet accretion. The Astrophysical Journal 813: doi:10.1088/0004-1637x/1813/1081/1072 - DOI
    1. Courtial P and Dingwell DB (1999) Densities of melts in the CaO-MgO-Al2O3-SiO2 system. American Mineralogist 84: 465–476