

Morphology and physiology of rat placenta for toxicological evaluation
- PMID: 30739991
- PMCID: PMC6361663
- DOI: 10.1293/tox.2018-0042
Morphology and physiology of rat placenta for toxicological evaluation
Abstract
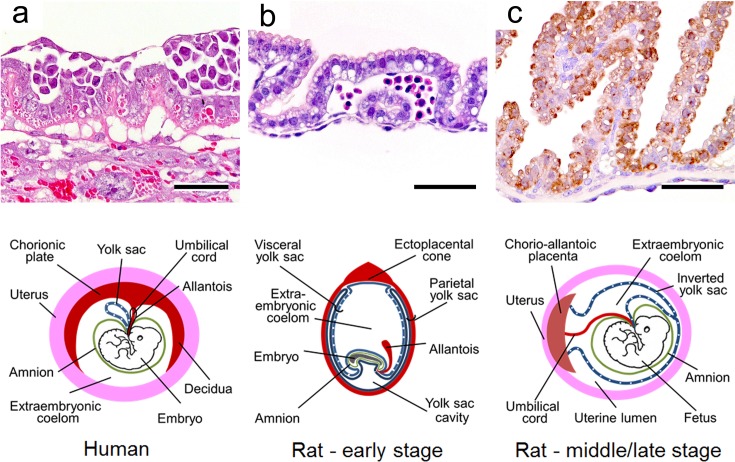
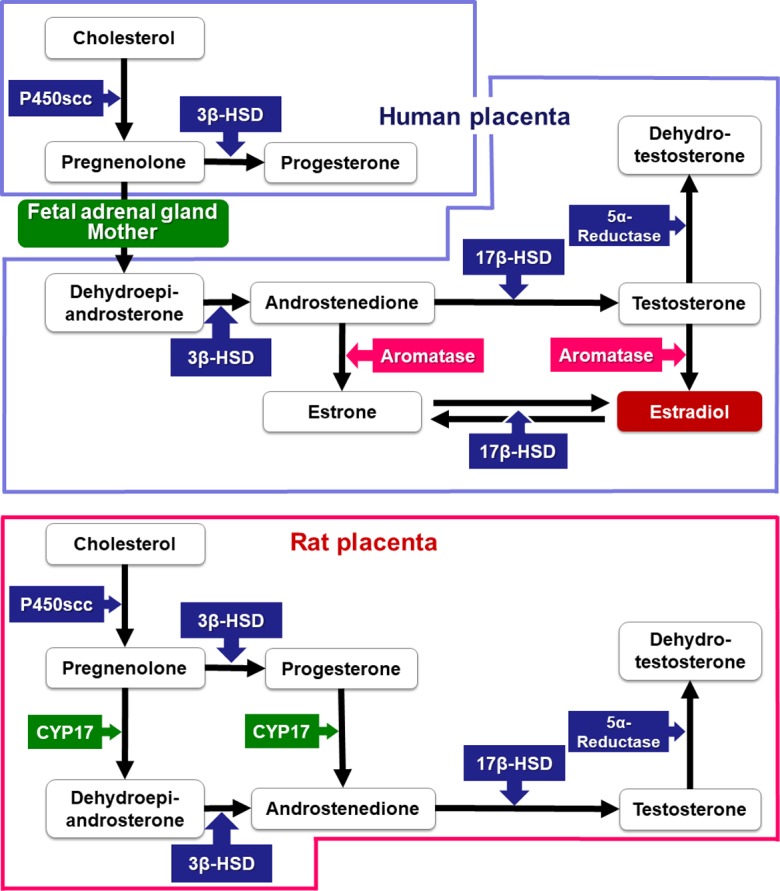
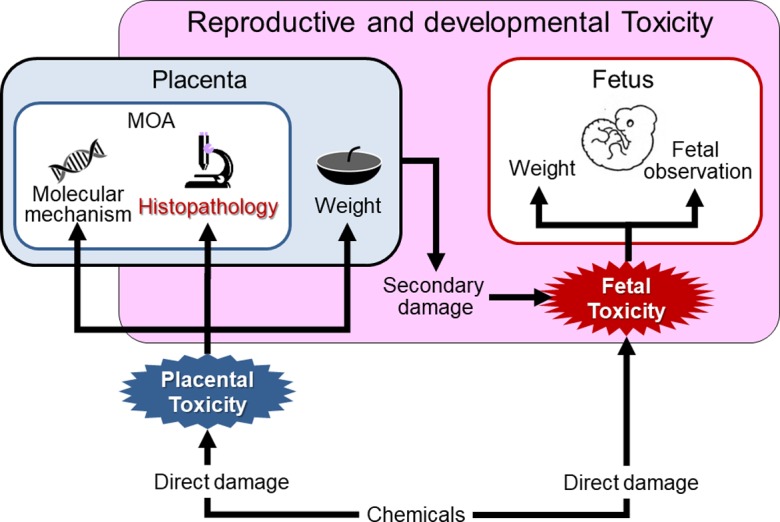
The placenta plays a pivotal role in fetal growth, and placental dysfunction and injury are associated with embryo/fetal toxicity. Histological examination of the rat placenta for safety evaluation provides valuable clues to the mechanisms of this toxicity. However, the placenta has specific and complex biological features unlike those of other organs, and placental structure dramatically changes depending on the time during the gestation period. Thus, time-dependent histopathological examination of the rat placenta should be performed based on the understanding of normal developmental changes in morphology and function. The placentas of rats and humans are both anatomically classified as discoid and hemochorial types. However, there are differences between rats and humans in terms of placental histological structure, the fetal-maternal interface, and the function of the yolk sac. Therefore, extrapolation of placental toxicity from rats to humans should be done cautiously in the evaluation of risk factors. This review describes the development, morphology, physiology, and toxicological features of the rat placenta and the differences between the rat and human placenta to enable accurate evaluation of reproductive and developmental toxicity in studies.
Keywords: histopathology; human; placenta; rat; reproduction.
Figures
Similar articles
-
Toxicological pathology in the rat placenta.J Toxicol Pathol. 2011 Jun;24(2):95-111. doi: 10.1293/tox.24.95. Epub 2011 Jun 30. J Toxicol Pathol. 2011. PMID: 22272049 Free PMC article.
-
Effect of dibutyltin on placental and fetal toxicity in rat.J Toxicol Sci. 2017;42(6):741-753. doi: 10.2131/jts.42.741. J Toxicol Sci. 2017. PMID: 29142173
-
Histomorphologic Analysis of the Late-term Rat Fetus and Placenta.Toxicol Pathol. 2018 Feb;46(2):158-168. doi: 10.1177/0192623318755135. Epub 2018 Feb 5. Toxicol Pathol. 2018. PMID: 29400254
-
Evaluation of the placenta: suggestions for a greater role in developmental toxicology.Adv Exp Med Biol. 1998;444:129-36. doi: 10.1007/978-1-4899-0089-0_15. Adv Exp Med Biol. 1998. PMID: 10026942 Review.
-
A comparison of the histological structure of the placenta in experimental animals.J Toxicol Pathol. 2014 Apr;27(1):11-8. doi: 10.1293/tox.2013-0060. Epub 2014 Apr 30. J Toxicol Pathol. 2014. PMID: 24791062 Free PMC article. Review.
Cited by
-
Periconceptional 1,3-butanediol supplementation suppresses the superimposed preeclampsia-like phenotype in the Dahl salt-sensitive rat.Am J Physiol Heart Circ Physiol. 2022 Feb 1;322(2):H285-H295. doi: 10.1152/ajpheart.00060.2021. Epub 2021 Dec 17. Am J Physiol Heart Circ Physiol. 2022. PMID: 34919457 Free PMC article.
-
Increased uterine androgen receptor protein abundance results in implantation and mitochondrial defects in pregnant rats with hyperandrogenism and insulin resistance.J Mol Med (Berl). 2021 Oct;99(10):1427-1446. doi: 10.1007/s00109-021-02104-z. Epub 2021 Jun 28. J Mol Med (Berl). 2021. PMID: 34180022 Free PMC article.
-
Oxytocin-induced birth causes sex-specific behavioral and brain connectivity changes in developing rat offspring.iScience. 2024 Jan 22;27(2):108960. doi: 10.1016/j.isci.2024.108960. eCollection 2024 Feb 16. iScience. 2024. PMID: 38327784 Free PMC article.
-
Placental outcomes of phthalate exposure.Reprod Toxicol. 2021 Aug;103:1-17. doi: 10.1016/j.reprotox.2021.05.001. Epub 2021 May 17. Reprod Toxicol. 2021. PMID: 34015474 Free PMC article. Review.
-
Extended Prophylactic Effect of N-tert-Butyl-α-phenylnitron against Oxidative/Nitrosative Damage Caused by the DNA-Hypomethylating Drug 5-Azacytidine in the Rat Placenta.Int J Mol Sci. 2022 Jan 6;23(2):603. doi: 10.3390/ijms23020603. Int J Mol Sci. 2022. PMID: 35054786 Free PMC article.
References
-
- Bauer MK, Harding JE, Bassett NS, Breier BH, Oliver MH, Gallaher BH, Evans PC, Woodall SM, and Gluckman PD. Fetal growth and placental function. Mol Cell Endocrinol. 140: 115–120. 1998. - PubMed
-
- Sankaran S, and Kyle PM. Aetiology and pathogenesis of IUGR. Best Pract Res Clin Obstet Gynaecol. 23: 765–777. 2009. - PubMed
-
- Goodman DR, James RC, and Harbison RD. Placental toxicology. Food Chem Toxicol. 20: 123–128. 1982. - PubMed
-
- Gupta RK, and Gupta RC. Placental toxicity. In: Reproductive and Developmental Toxicology, 2nd ed. RC Gupta (ed). Elsevier, London. 1301–1325. 2017.