. 2017 Jul;17(13):8357-8370.
doi: 10.5194/acp-17-8357-2017. Epub 2017 Jul 10.

Comprehensive atmospheric modeling of reactive cyclic siloxanes and their oxidation products

Affiliations

Comprehensive atmospheric modeling of reactive cyclic siloxanes and their oxidation products

Nathan J Janechek et al. Atmos Chem Phys. 2017 Jul.

Abstract

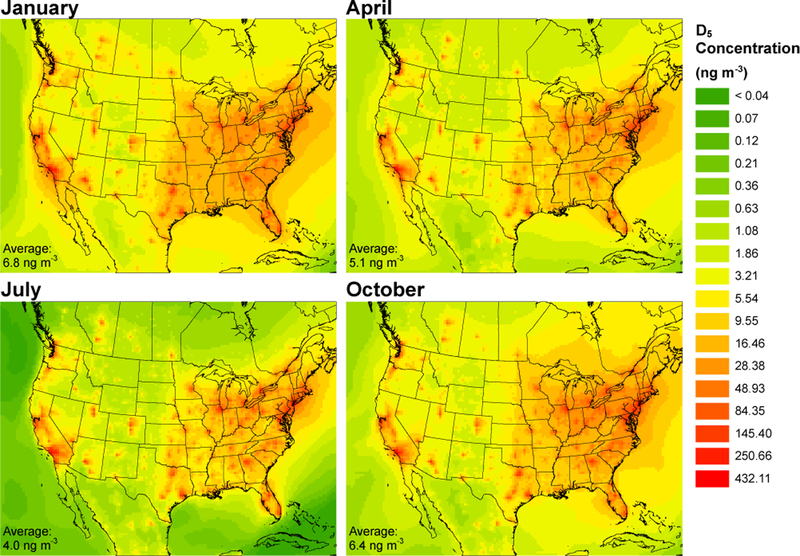
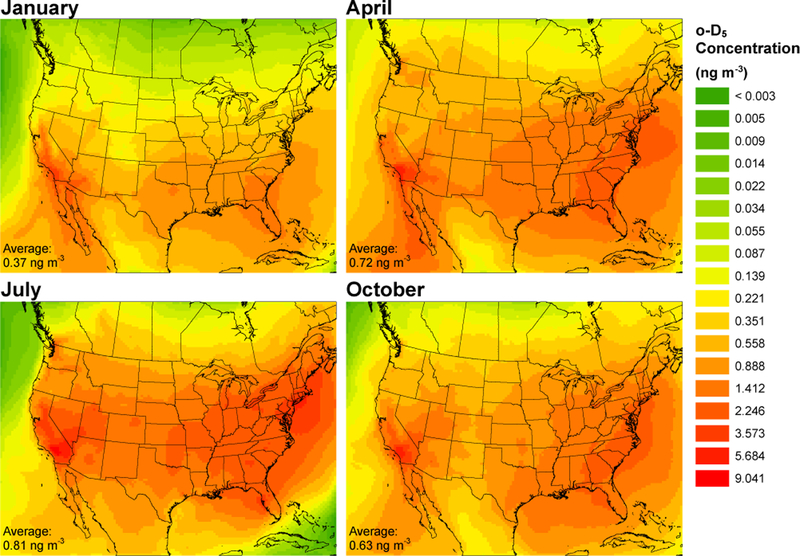
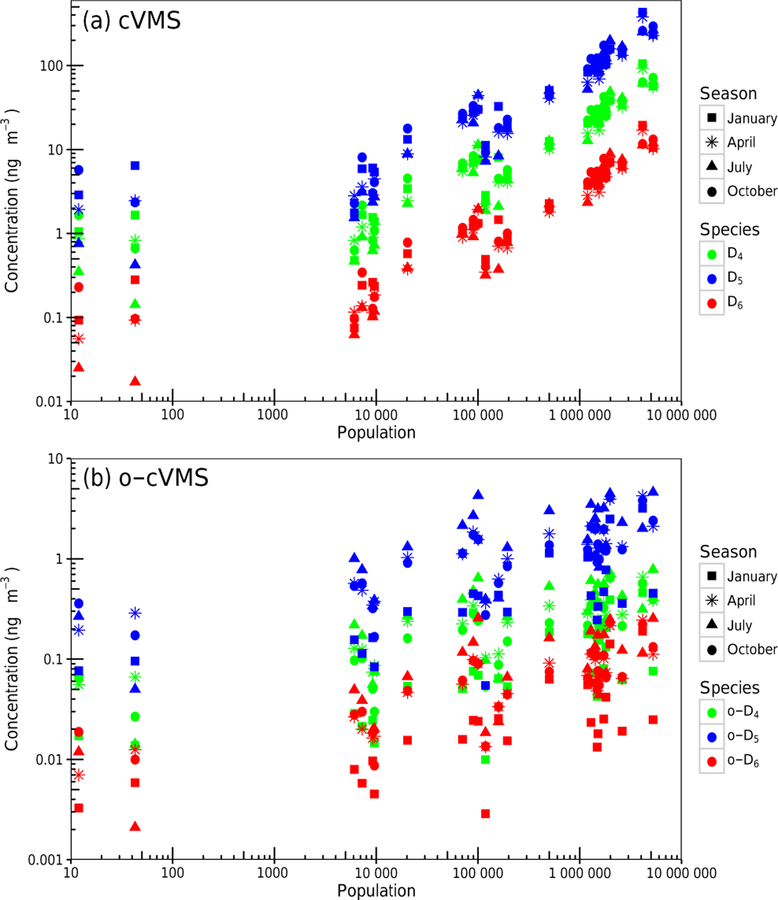
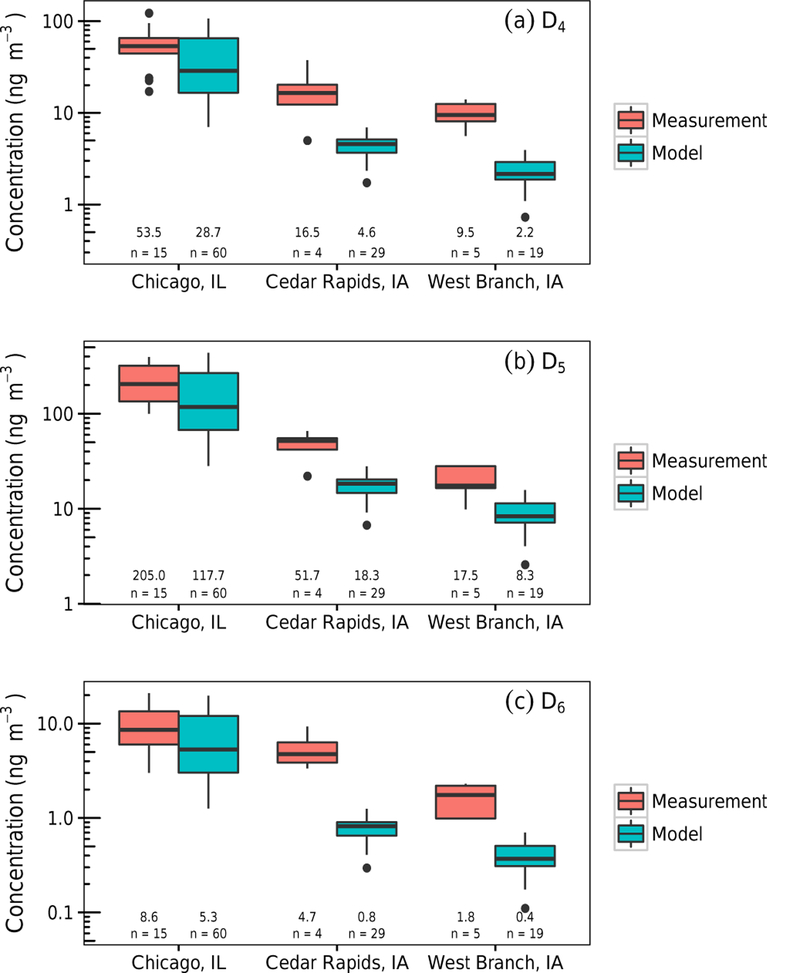
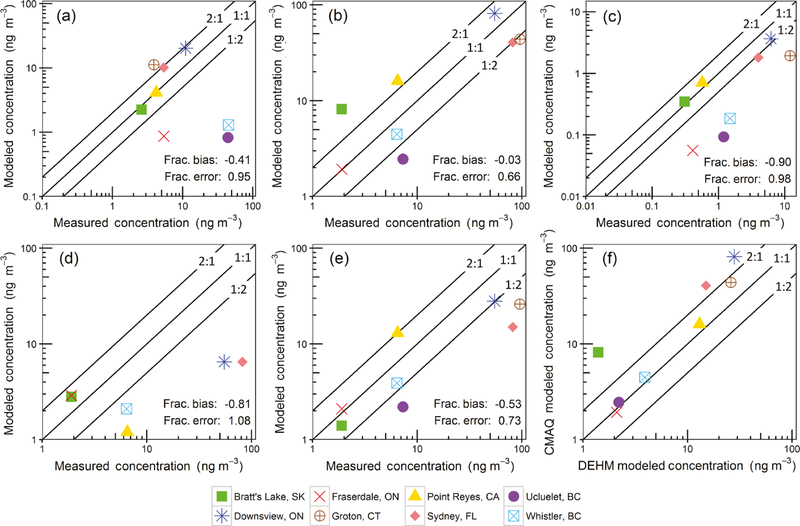
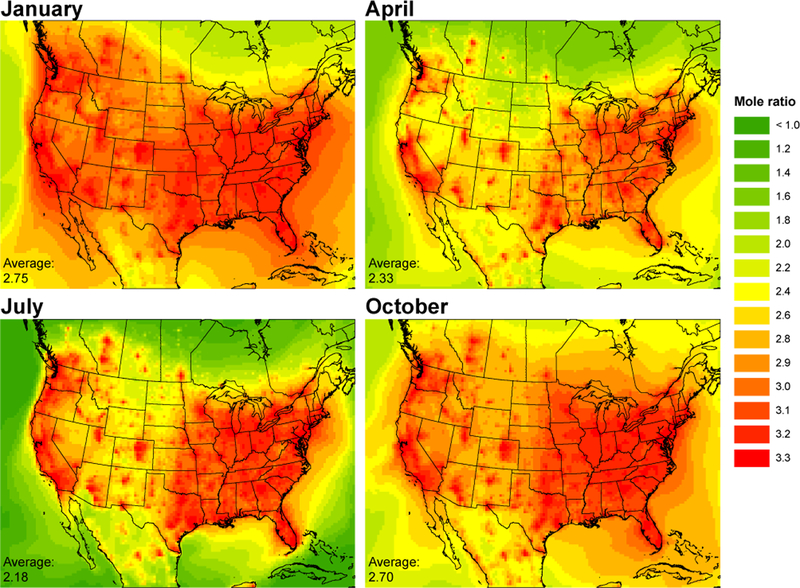
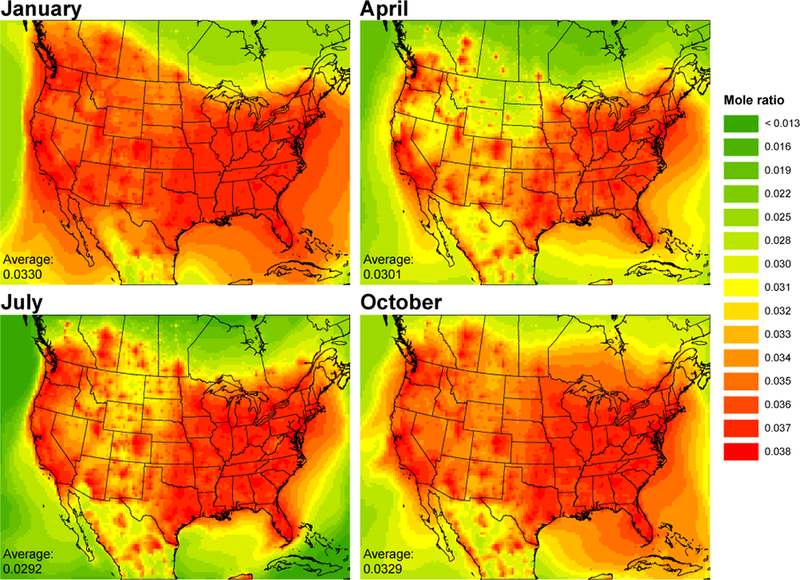
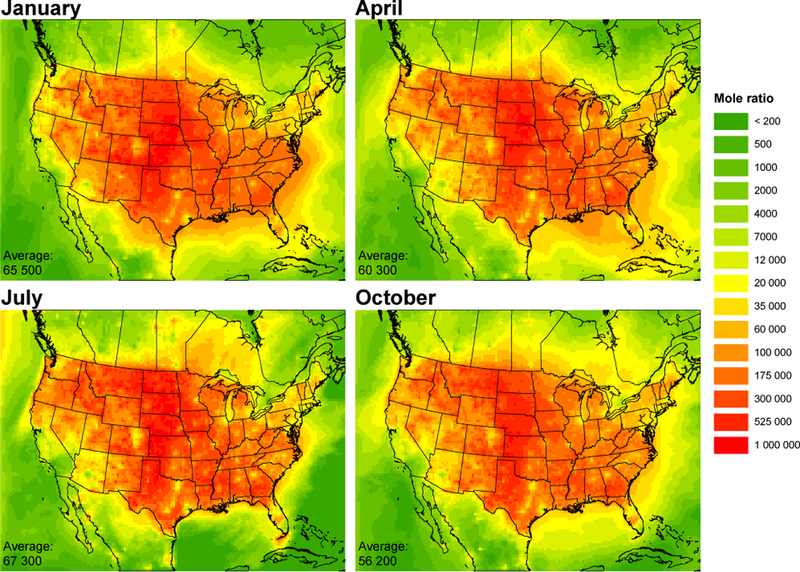
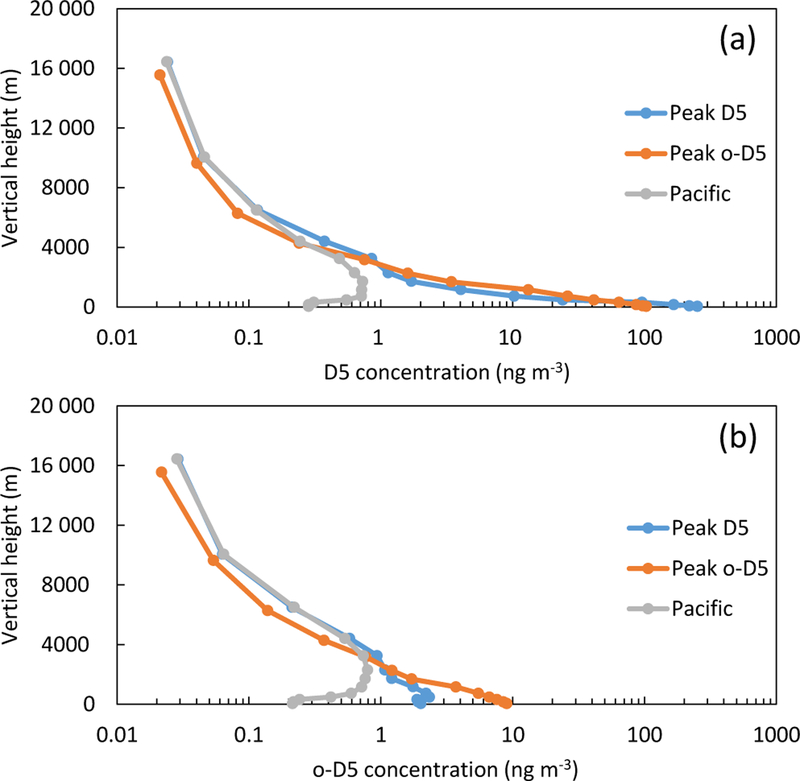
Cyclic volatile methyl siloxanes (cVMSs) are important components in personal care products that transport and react in the atmosphere. Octamethylcyclotetrasiloxane (D4), decamethylcyclopentasiloxane (D5), dodecamethylcyclohexasiloxane (D6), and their gas-phase oxidation products have been incorporated into the Community Multiscale Air Quality (CMAQ) model. Gas-phase oxidation products, as the precursor to secondary organic aerosol from this compound class, were included to quantify the maximum potential for aerosol formation from gas-phase reactions with OH. Four 1-month periods were modeled to quantify typical concentrations, seasonal variability, spatial patterns, and vertical profiles. Typical model concentrations showed parent compounds were highly dependent on population density as cities had monthly averaged peak D5 concentrations up to 432ngm-3. Peak oxidized D5 concentrations were significantly less, up to 9ngm-3, and were located downwind of major urban areas. Model results were compared to available measurements and previous simulation results. Seasonal variation was analyzed and differences in seasonal influences were observed between urban and rural locations. Parent compound concentrations in urban and peri-urban locations were sensitive to transport factors, while parent compounds in rural areas and oxidized product concentrations were influenced by large-scale seasonal variability in OH.


Conflict of interest statement

Competing interests. The authors declare that they have no conflict of interest.

Figures

Figure 1.
Figure 1.
Monthly averaged surface layer D5 concentrations. The domain average concentration is shown in the lower left for each month.
Figure 2.
Figure 2.
Monthly average surface layer oxidized D5 (o-D5) concentrations. The domain average concentration is shown in the lower left for each month.
Figure 3.
Figure 3.
Average monthly CMAQ modeled surface (a) cVMS and (b) oxidized cVMS concentrations are plotted versus 36km grid cell population for 26 US and Canadian sites. These sites include the 10 most populous US metropolitan areas, previous siloxane measurement sites, and NOAA Climate Monitoring and Diagnostics Laboratory (CMDL) sites. See Table S3 for the listing of these sites.
Figure 4.
Figure 4.
Model comparison to Yucuis et al. (2013). Model results from CMAQ (1–30 July simulation); measurements were conducted in 2011 from 13 to 21 August (Chicago), 29 June to 26 July (Cedar Rapids), and 6 to 22 July (West Branch), respectively. Hourly model data were averaged to 12, 24, and 36h periods, starting at typical measurement start times. Median concentrations and number of observations are tabulated under the box plots.
Figure 5.
Figure 5.
Plot (a) shows CMAQ D4, (b) CMAQ D5, (c) CMAQ D6, (d) BETR D5, and (e) DEHM D5 modeled concentrations compared to Genualdi et al. (2011) measurements. Plot (f) compares modeled CMAQ D5 versus DEHM D5 concentrations. CMAQ model results are the April averaged concentrations while BETR and DEHM model results are from Genualdi et al. (2011) and represent the same period as the measurements. Model resolution was 36km for CMAQ, 150km for DEHM, and 15 for BETR.
Figure 6.
Figure 6.
Modeled monthly averaged D5 /D4 mole ratios by season. Larger cVMS species react faster with OH. More reactive species are in the numerator; therefore, ratios decrease with air mass age.
Figure 7.
Figure 7.
Modeled monthly averaged D6 /D5 mole ratios by season. Larger cVMS species react faster with OH. More reactive species are in the numerator; therefore, ratios decrease with air mass age.
Figure 8.
Figure 8.
Modeled monthly averaged SO2 /(D4+D5+D6) mole ratio by season.
Figure 9.
Figure 9.
Monthly averaged vertical profiles for grid cells near Los Angeles. Plot (a) shows D5 and (b) o-D5 model concentrations. Grid cells refer to the location of maximum July D5, maximum July o-D5, and a grid cell over the Pacific Ocean.

References

    1. Ahrens L, Harner T, and Shoeib M: Temporal variations of cyclic and linear volatile methylsiloxanes in the atmosphere using passive samplers and high-volume air samplers, Environ. Sci. Technol, 48, 9374–9381, 10.1021/es502081j, 2014. - DOI - PubMed
    1. Atkinson R: Kinetics of the Gas-Phase Reactions of a Series of Organosilicon Compounds with OH and NO3 Radicals and O3 at 297 +/−2K, Environ. Sci. Technol, 25, 863–866, 10.1021/es00017a005, 1991. - DOI
    1. Brooke D, Crookes M, Gray D, and Robertson S: Environmental Risk Assessment Report: Dodecamethylcyclohexasiloxane, Environment Agency of England and Wales, Bristol, UK, 2009a.
    1. Brooke D, Crookes M, Gray D, and Robertson S: Environmental Risk Assessment Report: Decamethylcyclopentasiloxane, Environment Agency of England and Wales, Bristol, UK, 2009b.
    1. Brooke D, Crookes M, Gray D, and Robertson S: Environmental Risk Assessment Report: Octamethylcyclotetrasiloxane, Environment Agency of England and Wales, Bristol, UK, 2009c.

LinkOut - more resources