. 2019 Jan 23;8(2):155-165.
doi: 10.1002/open.201800261. eCollection 2019 Feb.

Manganese-Zinc Ferrites: Safe and Efficient Nanolabels for Cell Imaging and Tracking In Vivo

Affiliations

Manganese-Zinc Ferrites: Safe and Efficient Nanolabels for Cell Imaging and Tracking In Vivo

Vít Herynek et al. ChemistryOpen. .

Abstract

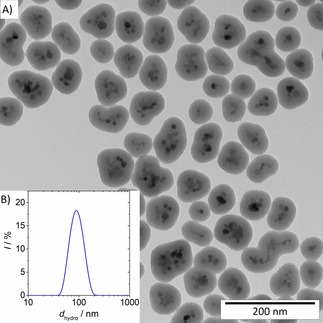
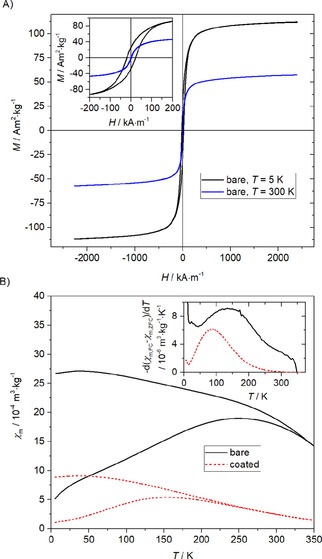
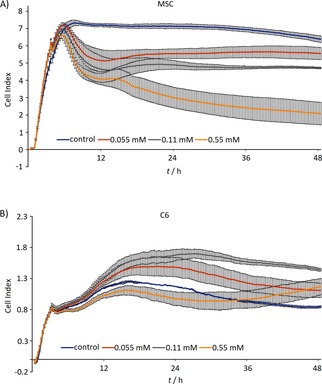
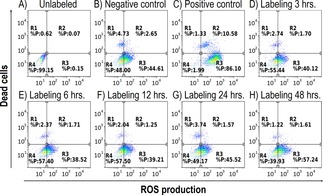
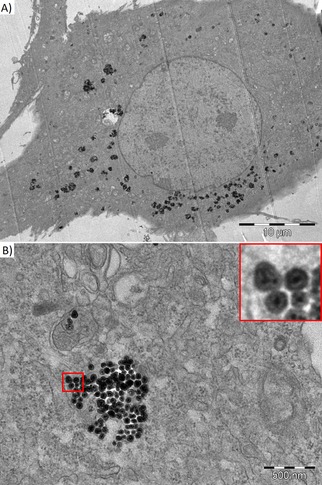
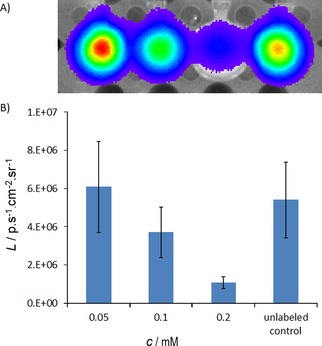
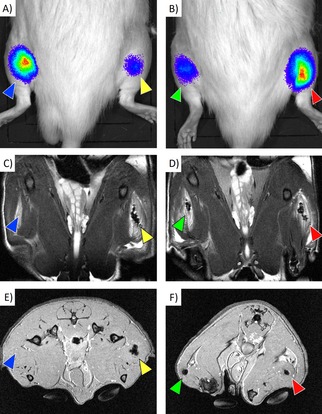
Manganese-zinc ferrite nanoparticles were synthesized by using a hydrothermal treatment, coated with silica, and then tested as efficient cellular labels for cell tracking, using magnetic resonance imaging (MRI) in vivo. A toxicity study was performed on rat mesenchymal stem cells and C6 glioblastoma cells. Adverse effects on viability and cell proliferation were observed at the highest concentration (0.55 mM) only; cell viability was not compromised at lower concentrations. Nanoparticle internalization was confirmed by transmission electron microscopy. The particles were found in membranous vesicles inside the cytoplasm. Although the metal content (0.42 pg Fe/cell) was lower compared to commercially available iron oxide nanoparticles, labeled cells reached a comparable relaxation rate R 2, owing to higher nanoparticle relaxivity. Cells from transgenic luciferase-positive rats were used for in vivo experiments. Labeled cells were transplanted into the muscles of non-bioluminescent rats and visualized by MRI. The cells produced a distinct hypointense signal in T2- or T2*-weighted MR images in vivo. Cell viability in vivo was verified by bioluminescence.

Keywords: cell labeling; cell transplantation; doping; magnetic resonance imaging; nanoparticles.


Conflict of interest statement

The authors declare no conflict of interest.

Figures

Figure 1
Figure 1
Representative transmission electron microscopy image of silica‐coated MZF nanoparticles (A) and distribution of their hydrodynamic size in an aqueous suspension (B).
Figure 2
Figure 2
Magnetic properties: hysteresis loops of bare MZF particles at low and room temperatures (A) and ZFC/FC susceptibility measurements for the bare and silica‐coated products (B). The inset show the temperature derivative of the ZFC‐FC susceptibility difference.
Figure 3
Figure 3
Real‐time proliferation of cells after labeling assessed by impedance measurement in microplates seeded with BM‐MSCs (A) and C6 cells (B).
Figure 4
Figure 4
FACS analysis of ROS production in unlabeled cells (A), negative control (B), positive control (C), cells labeled at 0.11 mM(Mn0.61Zn0.42Fe1.97O4) concentration 3 hours (D), 6 hours (E), 12 hours (F), 24 hours (G) and 48 hours (H). Dot plots show multiparametric analysis of ROS production and cell death. Horizontal axis: CELLRox DeepRed Reagent, vertical axis: SYTOXBlue. Quadrant gate: region R1: dead cells negative for ROS, R2: dead cells positive for ROS, R3: ROS production in living cells, R4: live intact cells without ROS production. No significant difference between negative cells and NPs‐treated cells was found. As depicted on negative control, BM‐MSCs have basal ROS production.
Figure 5
Figure 5
Transmission electron microscopy of BM‐MSC labeled by silica‐coated MZF nanoparticles at 0.11 mM(Mn0.61Zn0.42Fe1.97O4) concentration. The nanoparticles were found in the cytoplasm outside the nucleus (A) and in composing clusters in membranous vesicles (B). The insert (a detailed view of the red‐bordered area) shows single particles formed by small clusters of Mn−Zn ferrite crystallites coated by an intact silica layer.
Figure 6
Figure 6
In vitro bioluminescence of cells (from left to right: cells labeled at concentrations c=0.05, 0.1, 0.2 mM(Mn0.61Zn0.42Fe1.97O4) and unlabeled cells) after the addition of luciferin to the medium (A). Quantified average radiance L plotted for different concentrations shows quenching of the signal by high nanoparticle concentrations in the cell pellet (B).
Figure 7
Figure 7
In vivo imaging of the engrafted cells: Bioluminescence images (A, B), coronal T2‐weighted MR images (C, D), and transversal T2*‐weighted MR images (E, F) of rats with transplanted cells. Both labeled and unlabeled cells were detectable by bioluminescence imaging. Unlabeled cells (blue arrows) provided no detectable MR signal, whereas cells labeled at 0.2 mM (yellow arrows), 0.1 mM (green arrows) and 0.05 mM (red arrows) were detectable as distinct hypointense areas.

References

    1. Mahla R. S., Int J Cell Biol 2016, 6940283. - PMC - PubMed
    1. Liew C. G., Moore H., Ruban L., Shah N., Cosgrove K., Dunne M., Andrews P., Ann. Med. 2005, 37, 521–532. - PubMed
    1. None
    1. Berebichez-Fridman R., Gomez-Garcia R., Granados-Montiel J., Berebichez-Fastlicht E., Olivos-Meza A., Granados J., Velasquillo C., Ibarra C., Stem Cells Int 2017, 2638305; - PMC - PubMed
    1. Chang C. A., Lawrence M. C., Naziruddin B., Curr Opin Organ Transplant 2017, 22, 437–443; - PubMed

LinkOut - more resources