. 2019 Jan 3:2:3.
doi: 10.1038/s42003-018-0246-9. eCollection 2019.

Mitochondrial protein E2F3d, a distinctive E2F3 product, mediates hypoxia-induced mitophagy in cancer cells

Affiliations

Mitochondrial protein E2F3d, a distinctive E2F3 product, mediates hypoxia-induced mitophagy in cancer cells

Keigo Araki et al. Commun Biol. .

Abstract

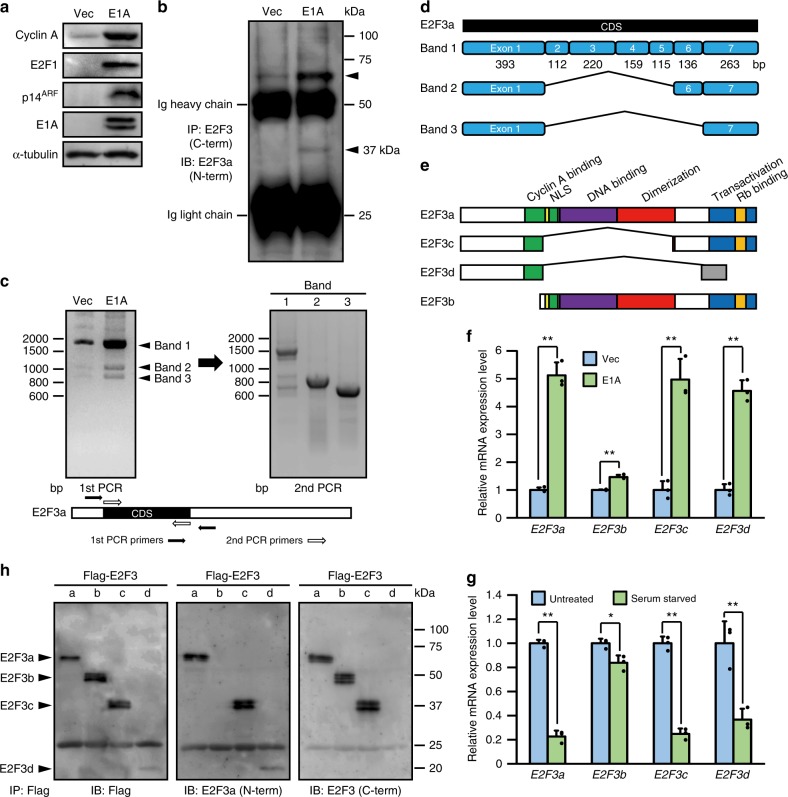
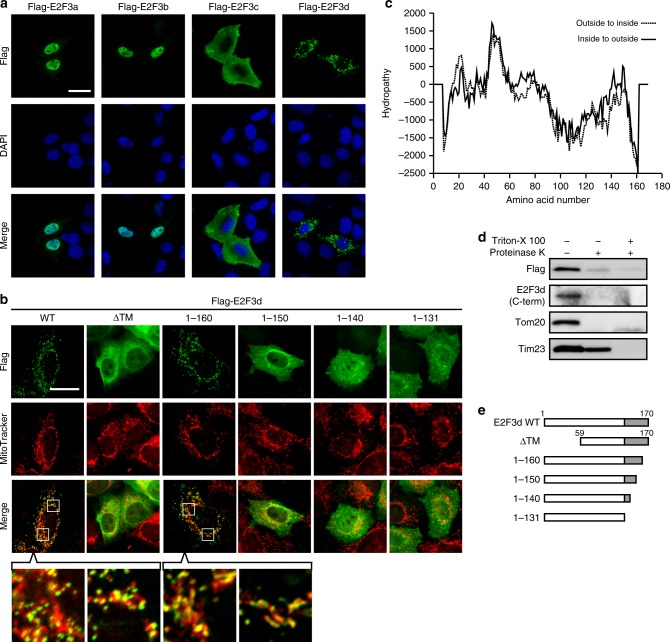
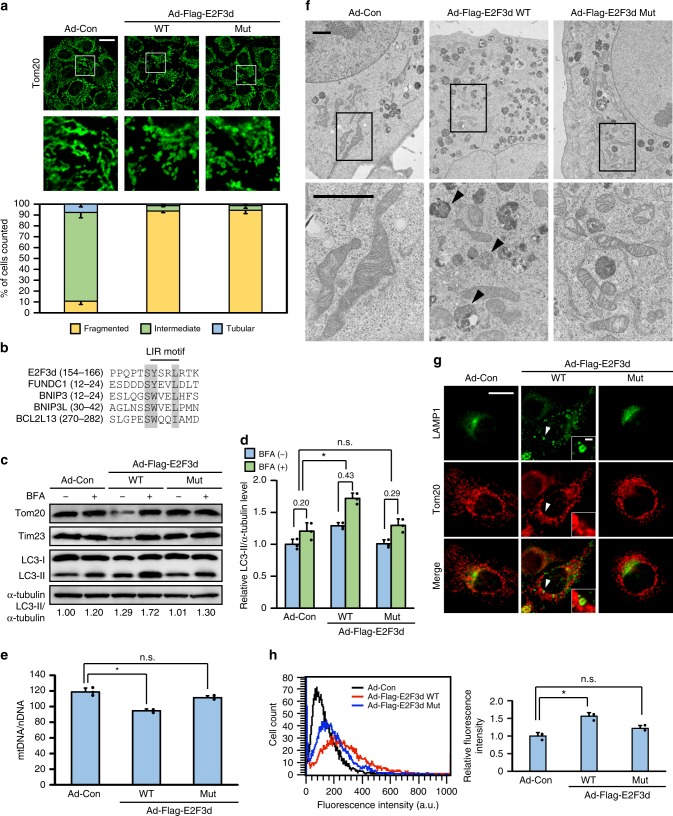
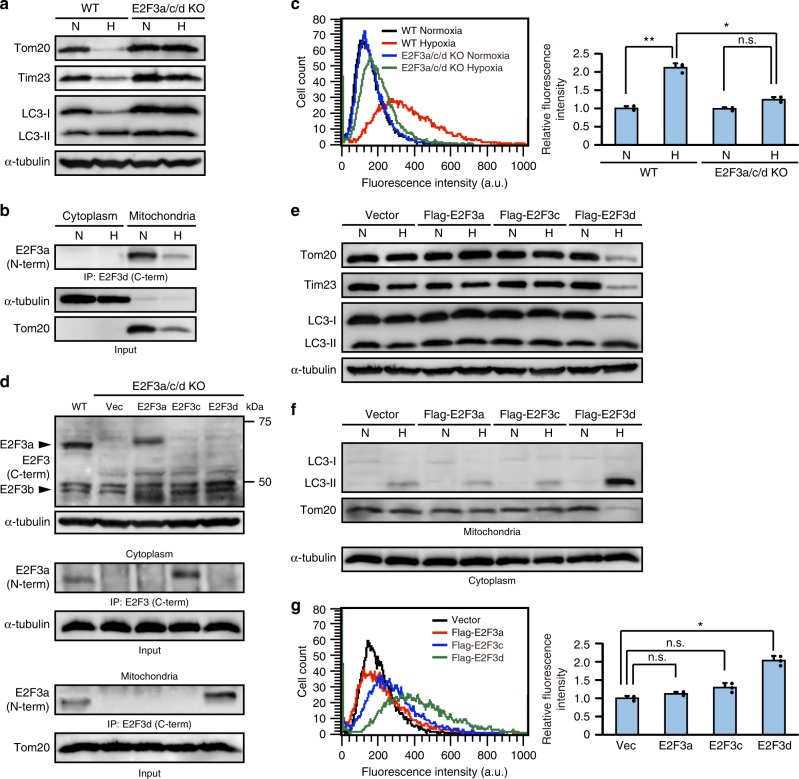
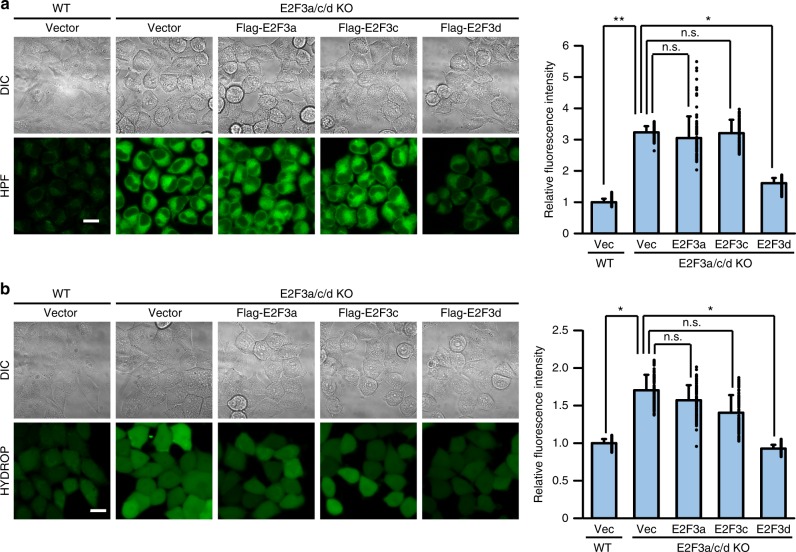
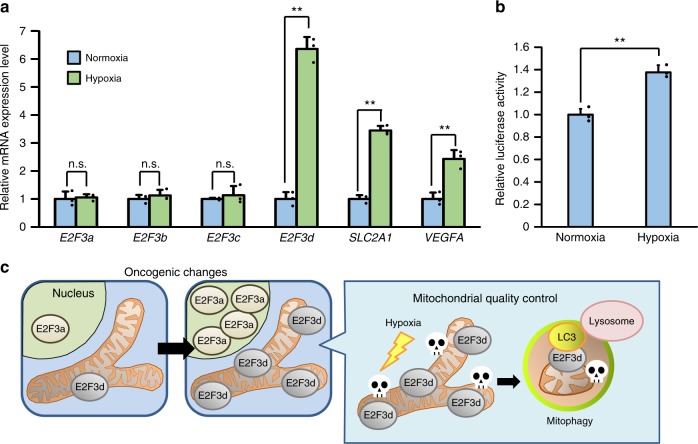
Mitochondrial damage is caused by changes in the micro-environmental conditions during tumor progression. Cancer cells require mechanisms for mitochondrial quality control during this process; however, how mitochondrial integrity is maintained is unclear. Here we show that E2F3d, a previously unidentified E2F3 isoform, mediates hypoxia-induced mitophagy in cancer cells. Aberrant activity and expression of the E2F3 transcription factor is frequently observed in many cancer cells. Loss of retinoblastoma (Rb) protein family function increases the expression of E2F3d and E2F3a. E2F3d localizes to the outer mitochondrial membrane and its cytosolic domain contains an LC3-interacting region motif. Overexpression of E2F3d induces mitochondrial fragmentation and mitophagy, suggesting that E2F3d plays an important role in mitophagy. Furthermore, depletion of E2F3s attenuates hypoxia-induced mitophagy and increases intracellular levels of reactive oxygen species, which is reversed by the reintroduction of E2F3d. This study presents another key player that regulates mitochondrial quality control in cancer cells.


Conflict of interest statement

The authors declare no competing interests.

Figures

Fig. 1
Fig. 1
E2F3c and E2F3d are newly identified E2F3 products. af HFFs were infected with control (Vec) or E1A-expressing retroviruses. a Cell lysates were analyzed by immunoblotting to examine the protein levels of E2F target genes. b Cell lysates were immunoprecipitated with an antibody against the C-terminal domain of human E2F3 proteins and probed with an antibody against the N-terminal domain of human E2F3a protein. c Total mRNAs were subjected to RT-PCR. The RT-PCR products observed in E1A-expressing cells (bands 1–3) were extracted separately and further amplified in the second reaction using inner primers nested within the first primers. d mRNA structure of newly identified E2F3 members. Schematic diagrams represent the exon composition of the RT-PCR products. e Domain structure of E2F3 members. f cDNA samples were subjected to qRT-PCR using primer sets specific for each E2F3 member. Values shown represent the means of three independent experiments. Error bars represent SD. **P < 0.01. g cDNA samples from asynchronously growing (untreated) and quiescent (serum starved) HFFs were subjected to qRT-PCR as described in f. Values shown represent the means of three independent experiments. Error bars represent SD. *P < 0.05 and **P < 0.01. h 293 T cells were transfected with expression vectors encoding Flag-tagged individual E2F3 members. Cell lysates were subjected to immunoprecipitation with anti-Flag antibody-agarose beads followed by immunoblotting with antibodies directed against Flag or the N- or C-terminal domain of human E2F3a protein. Full-size scans of immunoblots are shown in Supplementary Information
Fig. 2
Fig. 2
E2F3d localizes to the OMM. a HeLa cells were transfected with expression vectors encoding Flag-tagged individual E2F3 members and then immunostained with anti-Flag antibody. Scale bar, 20 μm. b HeLa cells were transfected with Flag-tagged WT or deletion mutant E2F3d constructs and incubated with MitoTracker Red CMXRos (200 nM) for 30 min. Cells were then immunostained with anti-Flag antibody. The boxed areas are shown at higher magnification in the lowest panel. Scale bar, 20 μm. c Prediction of TM domains for E2F3d. A hydropathy plot was created using the TMpred algorithm. d Mitochondria were isolated from HeLa cells transfected with a Flag-tagged WT E2F3d construct and treated with proteinase K in the absence or presence of Triton X-100, followed by immunoblotting. e Schematic diagrams of full-length E2F3d (WT) and a series of its deletion mutants. Unique C-terminal domains of E2F3d are highlighted in gray. Full-size scans of immunoblots are shown in Supplementary Information. Please see Supplementary Fig. 1
Fig. 3
Fig. 3
E2F3d induces mitochondrial fragmentation and mitophagy. HeLa cells were infected with control adenovirus (Ad-Con) or adenoviruses expressing Flag-tagged WT or LIR mutant E2F3d (Ad-Flag-E2F3d WT or Mut). a Cells were immunostained with anti-Tom20 antibody. The bottom images show magnifications of the boxed areas in the top images. Scale bar, 20 μm. The graph shows the percentage of cells exhibiting fragmented, intermediate, or tubular mitochondrial morphologies. Data are presented as the mean of three independent experiments (≥100 cells). Error bars represent SD. b Sequence alignment of the putative LIR motif in E2F3d and other known mitophagy receptors. The shaded regions indicate highly conserved residues. c Cells were treated with BFA (100 nM) for 16 h and cell lysates were examined by immunoblotting. LC3-II protein levels were normalized to α-tubulin to determine the differences in levels between the absence and presence of BFA. d Statistical analysis of quantified LC3-II protein levels in c. Data are presented as the mean of three independent experiments. Error bars represent SD. *P < 0.05. n.s. not significant. e Mitochondrial DNA (mtDNA) content was normalized to nuclear DNA (nDNA). Data are presented as the mean of three independent experiments. Error bars represent SD. *P < 0.05. n.s. not significant. f Cells were analyzed by electron microscopy. The boxed areas are shown at higher magnification. Arrowheads represent mitochondrion-like structures surrounded by a limiting membrane. Scale bars, 2 μm. g Cells were immunostained with anti-LAMP1 and anti-Tom20 antibodies. Scale bar, 20 μm. The areas pointed by arrowheads are shown at higher magnification. Scale bar, 2 μm. h The uptake of mitochondria by lysosomes was evaluated by mitophagy assay. Data are presented as the mean of three independent experiments (≥10,000 cells). Error bars represent SD. *P < 0.05. n.s. not significant, a.u. arbitrary units. Full-size scans of immunoblots are shown in Supplementary Information. Please see Supplementary Figs. 2–4
Fig. 4
Fig. 4
E2F3d is important for hypoxia-induced mitophagy. ac Parental WT and E2F3a/c/d KO HeLa cells were cultured under normoxic (N; 21% O2) or hypoxic (H; 1% O2) conditions for 24 h. a Cell lysates were examined by immunoblotting. b Cytoplasmic and mitochondrial lysates from parental WT cells were immunoprecipitated with the antibody against the C-terminal domain of human E2F3d protein and probed with the antibody against the N-terminal domain of human E2F3a protein. c The uptake of mitochondria by lysosomes was evaluated by mitophagy assay. Data are presented as the mean of three independent experiments (≥10,000 cells). Error bars represent SD. *P < 0.05 and **P < 0.01. n.s. not significant, a.u. arbitrary units. dg E2F3a/c/d KO HeLa cells were infected with control retrovirus (Vec) or retroviruses expressing Flag-E2F3a, Flag-E2F3c, or Flag-E2F3d. d Cell lysates were examined by immunoblotting (top). Cytoplasmic (middle) and mitochondrial (bottom) lysates were immunoprecipitated with the antibodies against the C-terminal domains of human E2F3a or E2F3d proteins, and probed with the antibody against the N-terminal domain of human E2F3a protein. e, f Cells were cultured under normoxic or hypoxic conditions for 24 h. Cell lysates (e) and cytoplasmic lysates and mitochondria (f) were examined by immunoblotting. g Cells were cultured under hypoxic conditions for 24 h and the uptake of mitochondria by lysosomes was analyzed as described in c. *P < 0.05. n.s. not significant. Full-size scans of immunoblots are shown in Supplementary Information. Please see Supplementary Fig. 5
Fig. 5
Fig. 5
E2F3d affects intracellular ROS levels. a, b E2F3a/c/d KO HeLa cells were infected with control retrovirus (Vec) or retroviruses expressing Flag-E2F3a, Flag-E2F3c, or Flag-E2F3d. Intracellular ROS levels were analyzed using the fluorescent probes hydroxyl radical and peroxynitrite sensor HPF (a) and hydrogen peroxide sensor HYDROP (b). Differential interference contrast (DIC) and fluorescent images of HPF or HYDROP are shown. Scale bar, 20 μm. The mean fluorescence intensity was quantified (n = 200). Relative fluorescence intensities to parental WT cells infected with control retrovirus (Vec) are shown. Error bars represent SD. *P < 0.05 and **P < 0.01. n.s. not significant
Fig. 6
Fig. 6
Hypoxia increases E2F3d transcripts. a HeLa cells were cultured under normoxic (21% O2) or hypoxic (1% O2) conditions for 24 h. cDNA samples were subjected to qRT-PCR using primer sets specific for each E2F3 member and HIF-1 target genes. Values shown represent the means of three independent experiments. Error bars represent SD. **P < 0.01. n.s. not significant. b HeLa cells were co-transfected with an E2F3a promoter (−740 to +160) luciferase reporter plasmid and pCMV-RL. After 24 h of transfection, cells were cultured for a further 24 h under normoxic or hypoxic conditions. Values shown represent the means of three independent experiments. Error bars represent SD. **P < 0.01. c Model for E2F3d-mediated mitophagy for mitochondrial quality control in cancer cells

References

    1. Trotta AP, Chipuk JE. Mitochondrial dynamics as regulators of cancer biology. Cell. Mol. Life Sci. 2017;74:1999–2017. doi: 10.1007/s00018-016-2451-3. - DOI - PMC - PubMed
    1. Mishra P, Chan DC. Metabolic regulation of mitochondrial dynamics. J. Cell Biol. 2016;212:379–387. doi: 10.1083/jcb.201511036. - DOI - PMC - PubMed
    1. Vyas S, Zaganjor E, Haigis MC. Mitochondria and cancer. Cell. 2016;166:555–566. doi: 10.1016/j.cell.2016.07.002. - DOI - PMC - PubMed
    1. Boland ML, Chourasia AH, Macleod KF. Mitochondrial dysfunction in cancer. Front. Oncol. 2013;3:292. doi: 10.3389/fonc.2013.00292. - DOI - PMC - PubMed
    1. Yamauchi S, et al. p53-mediated activation of the mitochondrial protease HtrA2/Omi prevents cell invasion. J. Cell Biol. 2014;204:1191–1207. doi: 10.1083/jcb.201309107. - DOI - PMC - PubMed

Publication types