. 2019 Apr;234(4):438-455.
doi: 10.1111/joa.12942. Epub 2019 Feb 10.

Bioengineering the microanatomy of human skin

Affiliations

Bioengineering the microanatomy of human skin

Mathilde Roger et al. J Anat. 2019 Apr.

Abstract

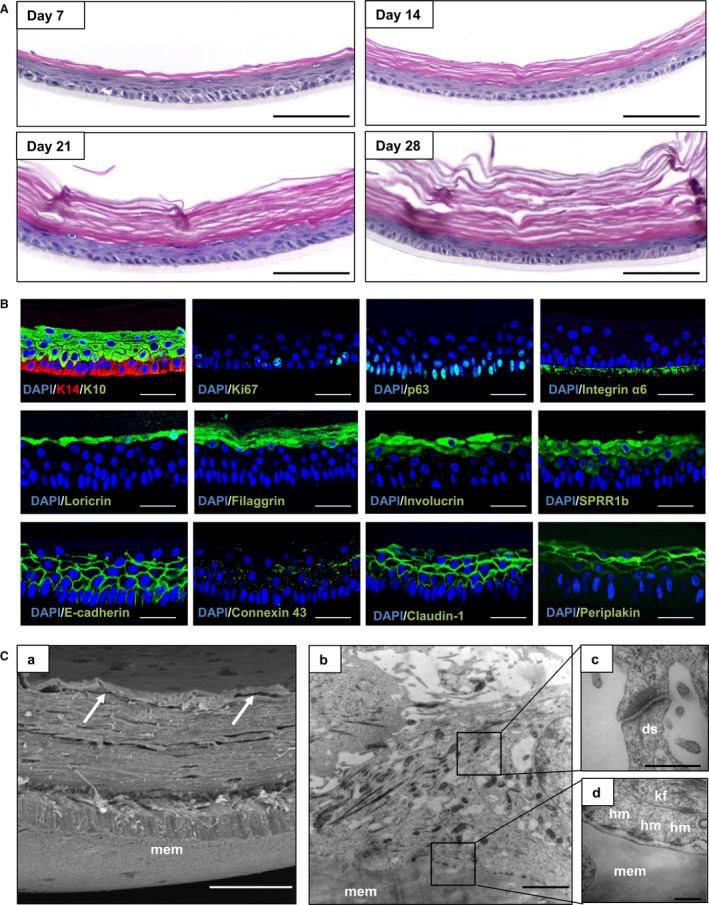
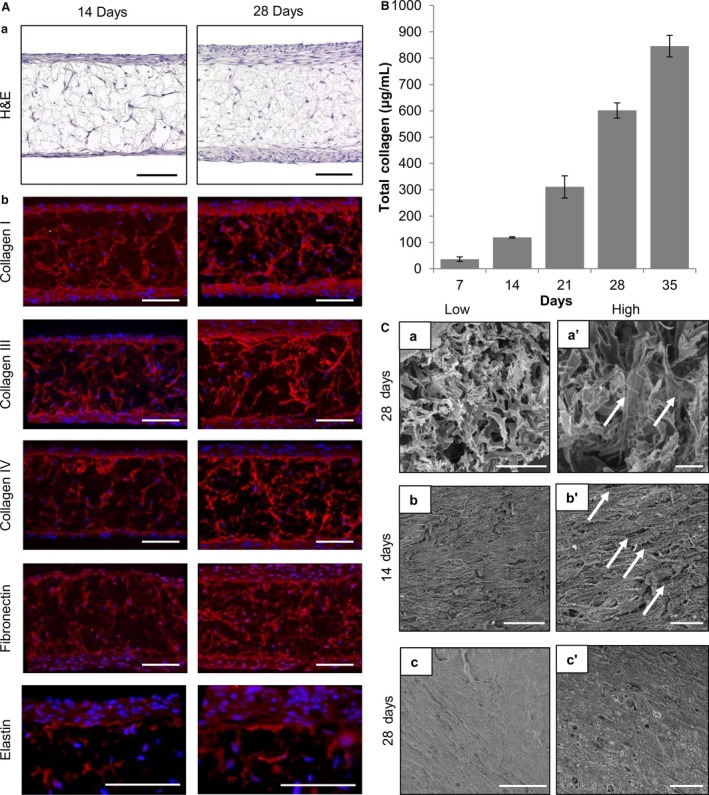
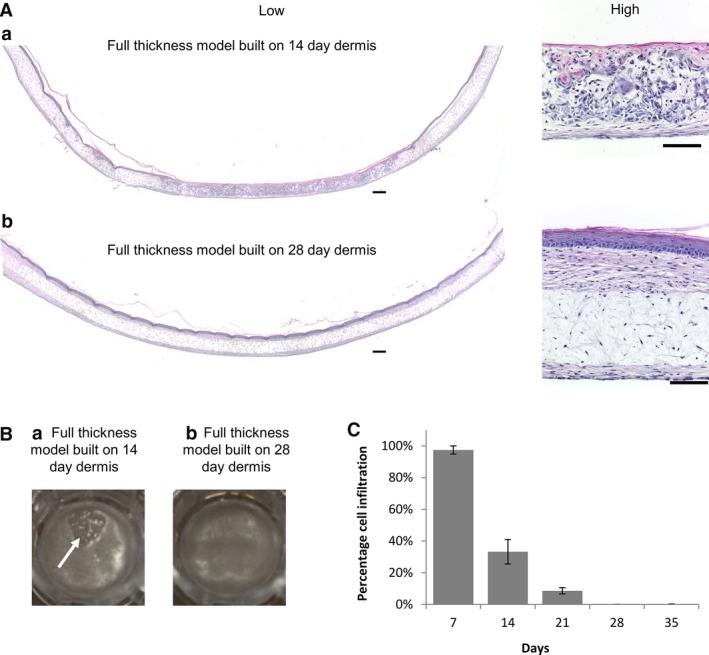
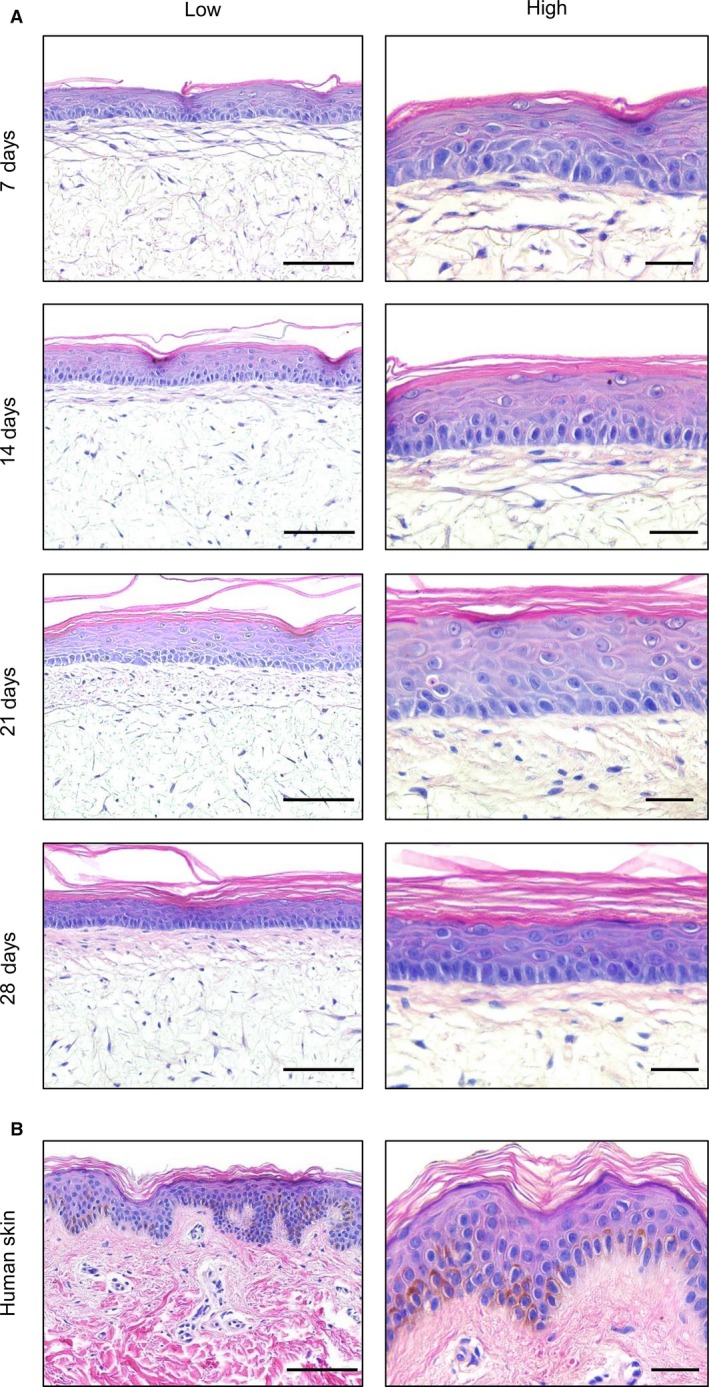
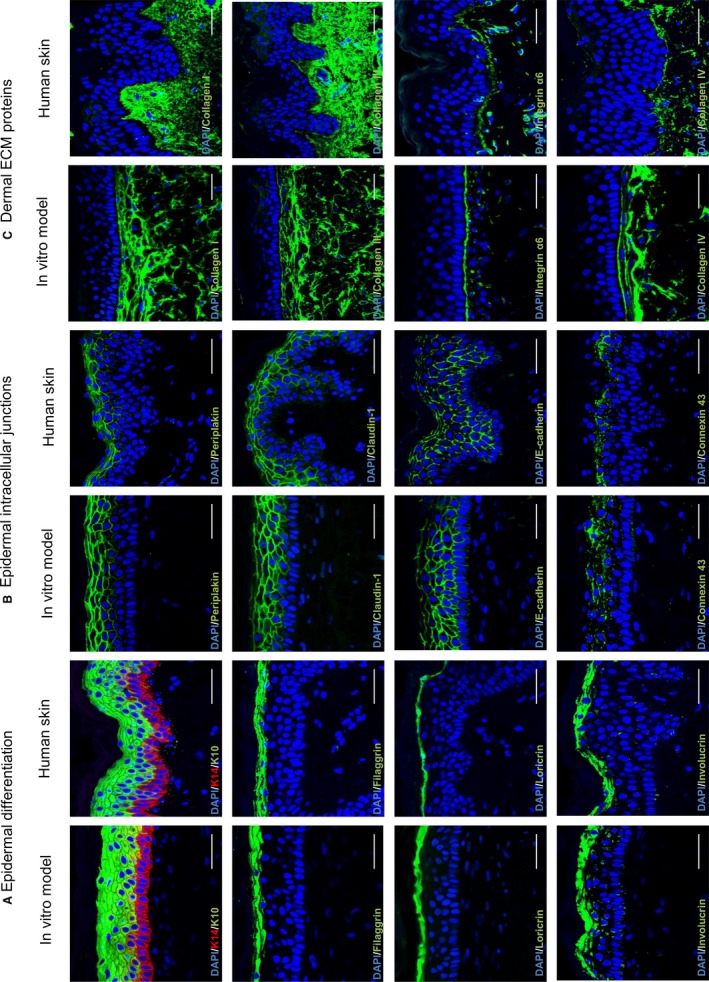
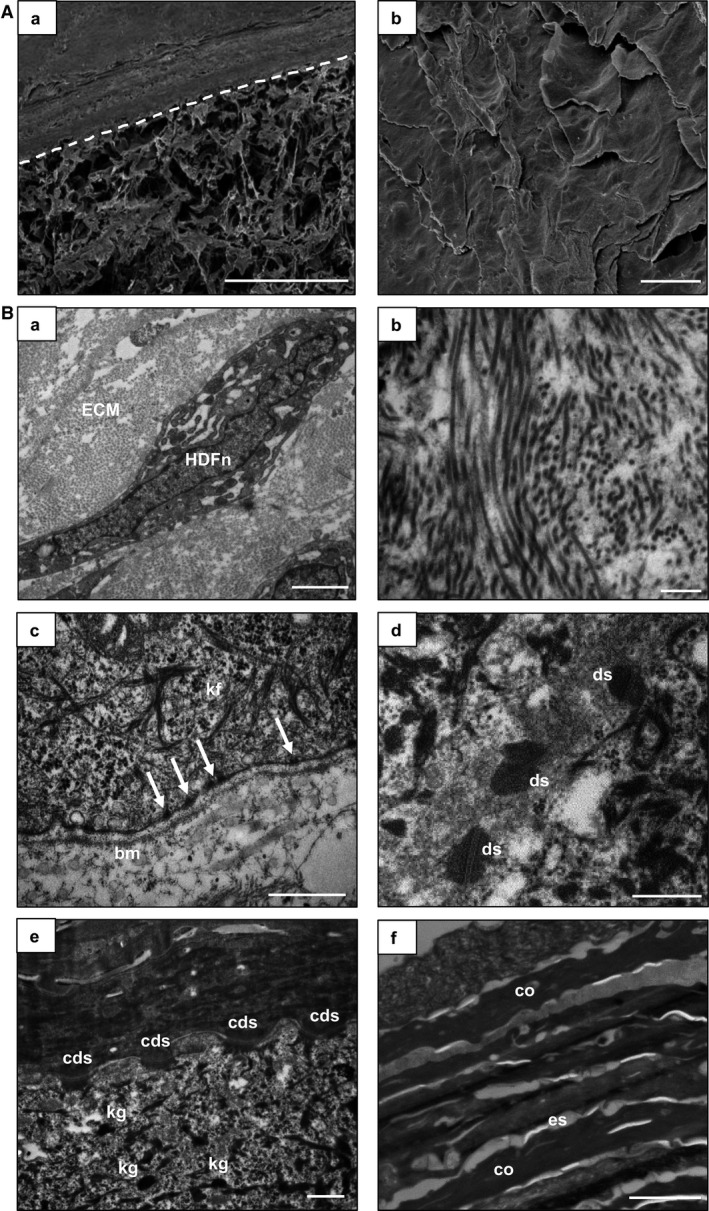
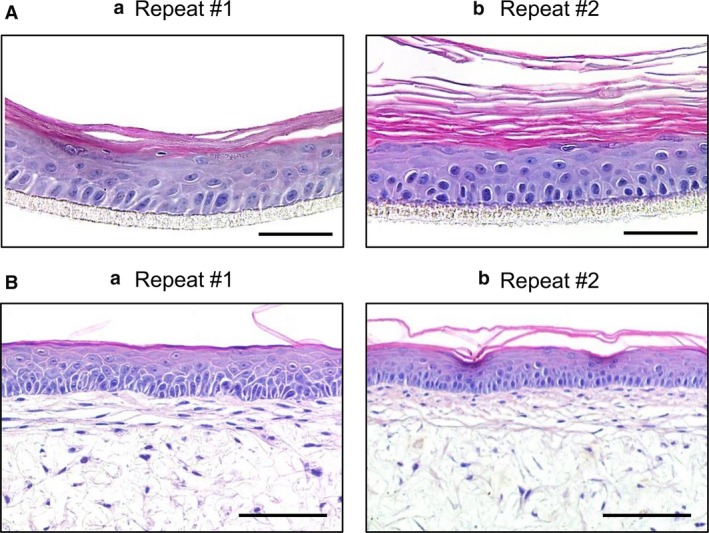
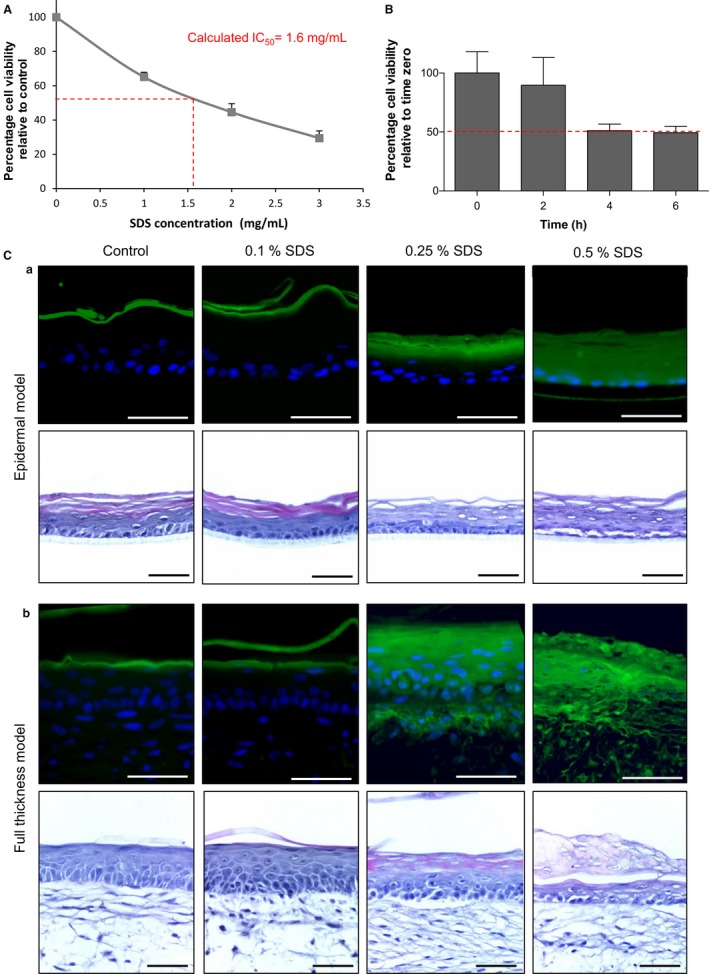
Recreating the structure of human tissues in the laboratory is valuable for fundamental research, testing interventions, and reducing the use of animals. Critical to the use of such technology is the ability to produce tissue models that accurately reproduce the microanatomy of the native tissue. Current artificial cell-based skin systems lack thorough characterisation, are not representative of human skin, and can show variation. In this study, we have developed a novel full thickness model of human skin comprised of epidermal and dermal compartments. Using an inert porous scaffold, we created a dermal construct using human fibroblasts that secrete their own extracellular matrix proteins, which avoids the use of animal-derived materials. The dermal construct acts as a foundation upon which epidermal keratinocytes were seeded and differentiated into a stratified keratinised epithelium. In-depth morphological analyses of the model demonstrated very close similarities with native human skin. Extensive immunostaining and electron microscopy analysis revealed ultrastructural details such as keratohyalin granules and lamellar bodies within the stratum granulosum, specialised junctional complexes, and the presence of a basal lamina. These features reflect the functional characteristics and barrier properties of the skin equivalent. Robustness and reproducibility of in vitro models are important attributes in experimental practice, and we demonstrate the consistency of the skin construct between different users. In summary, a new model of full thickness human skin has been developed that possesses microanatomical features reminiscent of native tissue. This skin model platform will be of significant interest to scientists researching the structure and function of human skin.

Keywords: barrier function; dermis; epidermis; human; methodology; reproducible; skin equivalent; tissue engineering.


Figures

Figure 1
Figure 1
Formation and characterisation of epidermal construct. (A) Histological assessment of epidermal structure over time shown by representative H&E images of epidermal models cultured for up to 28 days at the air–liquid interface. Scale bars: 100 μm. (B) Representative immunofluorescence micrographs of the epidermal construct, cultured for 14 days at the air–liquid interface. Data show protein expression patterns for key biomarkers in the epidermis. Scale bars: 50 μm. (C) Representative SEM and TEM micrographs of the epidermal model cultured for 14 days at the air–liquid interface. (C,a) Cross‐section SEM micrographs, showing multiple cell layers with the stratum corneum demonstrating less adherence than the layers below (white arrows). Scale bars: 25 μm. (C,b‐d) TEM micrographs showing the Millicell® membrane (mem), hemidesmosome‐like structures (hm), desmosomes (ds), and keratin fibres (kf). (C,c) Electron‐dense desmosome between cells at higher magnification. (C,d) Electron‐dense junctional complex between cells and the underlying Millicell® membrane. Scale bars: 2 μm (C,a,b), 500 nm (C,c,d).
Figure 2
Figure 2
Human dermal fibroblasts grown in 3D culture deposit increasing quantities of ECM proteins over time. (A) Analysis of dermal equivalent morphology and deposition of ECM proteins. (a) Representative H&E micrographs of dermal models cultured for 14 and 28 days. Scale bars: 100 μm. (b) Representative immunofluorescence micrographs showing ECM proteins deposited within dermal models cultured for 14 and 28 days. Scale bars: 100 μm. (B) Assessment of total collagen quantification within the dermal equivalent over time. Graph showing the total amount of collagen in μg mL−1 as determined by a hydroxyproline quantification over 7–35 days of maturation (data represent mean ± SEM, n = 3). (C) Assessment of dermal model structure using SEM analysis. (C,a‐c’) Representative SEM images of dermal fibroblasts cultured in Alvetex® before fixation in Karnovsky's fixative, post‐fixation in osmium tetroxide, and coating with platinum. (C,a,a’) Cross‐section of 28‐day mature dermal equivalent showing cells and ECM materials deposited within the scaffold (white arrows). (C,b–c’) SEM images of the upper surface of the dermal model show dermal fibroblasts growing on top of each other producing multiple layers at lower and higher magnification. (C,b,b’) A 14‐day dermal equivalent showing multiple large gaps between cells on the surface (white arrows). (C,c,c’) A 28‐day mature dermal equivalent where the surface is more complete with only very occasional small gaps between cells. Scale bars: 50 μm (C,a‐c), 25 μm (C,a’‐c’).
Figure 3
Figure 3
Maturation of the dermal equivalent is required to support to the growth and stratification of the epidermis in full thickness skin. (A) Differential infiltration of keratinocytes into the dermal compartment. Representative low and high magnification H&E images of full thickness models generated by culturing the dermal component for: (a) 14 days and (b) 28 days before addition of keratinocytes to the surface of the dermal model. In both cases, the models were raised to the air–liquid interface for a further 14 days to promote differentiation. Multiple low magnification images of the same cross‐section were taken and stitched together using image j software to allow the visualisation of the full length of the full thickness skin models. (A,a) There is an absence of a continuous thick epidermal layer when the dermis is cultured for 14 days due to the invasion of keratinocytes into the dermal compartment. (A,b) A continuous epidermis is formed across the entire model when the dermal compartment is matured for 28 days and no invasion is observed. Scale bars: 200 μm in full‐length cross‐section (left, low magnification) and 100 μm (right, high magnification). (B) Photographs showing the surface of full thickness skin models within the well insert. The dermal component was initially cultured for either (a) 14 days or (b) 28 days prior to the seeding of keratinocytes and culturing for a further 14 days at the air–liquid interface. A hole in the epidermis is apparent in the 14‐day dermal model (white arrow, left), whereas the epidermis is complete and uniform across the well insert in the more mature 28‐day dermal model (right). (C) Keratinocyte infiltration decreases with the maturation of the dermal equivalent. The graph shows that the percentage depth of penetration of keratinocytes into the dermal construct decreased as the dermis was allowed to mature for longer periods of time. The data were generated by capturing multiple images and assessing areas of keratinocyte infiltration using image j software to determine the depth of penetration (data represent mean ± SEM, n = 3).
Figure 4
Figure 4
Histological analysis of the full thickness human skin model over time. (A) Representative H&E images of full thickness skin models generated using a dermis initially cultured for 28 days and then maintained for a further 7–28 days at the air–liquid interface. (B) Representative H&E images of a human skin sample from a 25‐year‐old Caucasian donor. Scale bars: 100 μm (left, low magnification) and 30 μm (right, high magnification).
Figure 5
Figure 5
Immunofluorescence analysis of full thickness skin model compared with real human skin. The full thickness skin model was generated by culturing the dermal compartment for up to 35 days, then allowing epidermal differentiation for 14 days at the air–liquid interface, and compared with human skin from a 25‐year‐old Caucasian donor. Representative immunofluorescence images of multiple markers show very similar expression patterns for each of the proteins tested between the in vitro generated models and human skin. Biomarkers have been divided into three groups: (A) proteins typically associated with epidermal differentiation; (B) proteins expressed at the junctions between cells that are often associated with skin barrier; (C) extracellular matrix proteins most often found in the dermis. Scale bars: 50 μm.
Figure 6
Figure 6
Ultrastructural characterisation of full thickness human skin model. Representative SEM (A) and TEM (B) images of the full thickness model, which includes a 28‐day established dermal compartment and the epidermis was differentiated for a further 14 days at the air–liquid interface. (A,a) SEM image of a cross‐section of the full thickness model. The white dotted line locates the upper surface of the Alvetex® membrane. Scale bar:  200 μm. (A,b) SEM image of the top surface of the skin model showing corneocytes which have an overlapping, flattened appearance. Scale bar: 20 μm. (B,a) A single dermal fibroblast surrounded by ECM. (B,b) Profiles of collagen fibrils. (B,c) Interface between the dermis and epidermis showing the typical electron‐dense tri‐laminar structure of the basement membrane (bm), hemidesmosomes (white arrows), and keratin fibres (kf). (B,d) electron‐dense desmosomes (ds) between cells in the spinous layer. (B,e) Keratohyalin granules (kg) in the granulosum layer and corneodesmosomes (cds) at the interface between the cornified and granular layers. (B,f) Extracellular spaces (es) and corneocytes (co) in the stratum corneum. Scale bars: 2 μm (B,a,f); 500 nm (B,b‐e).
Figure 7
Figure 7
Reproducibility and robustness of the skin models. Construction of each model has been performed by independent investigators and different laboratories to demonstrate the reproducibility of the models following the methods described herein. Examples of repeat constructs for the epidermal and full thickness models are shown in (A) and (B), respectively. The epidermal models were cultured for 14 days at the air–liquid interface, and the full thickness skin models were cultured for up to 35 days for the dermal compartment and 14 days at the air–liquid interface. Scale bars: 100 μm (A); 50 μm (B).
Figure 8
Figure 8
Assessment of barrier properties in epidermal and full thickness models. (A) Analysis of metabolic activity (MTT conversion) in the epidermal model cultured for 10 days at the air–liquid interface before being exposed for 18 h to a concentration range of SDS to determine an IC 50 value. Relative MTT values are shown with vehicle control cultures being set at 100% (data represent mean ± SEM, n = 3). (B) Analysis of metabolic activity (MTT conversion) in the epidermal model cultured for 20 days at the air–liquid interface before being exposed to 1% Triton X‐100 for up to 6 h. Relative MTT values are shown with 0 h cultures being set at 100% (data represent mean ± SEM, n = 2). (C) Assessment of barrier resistance in epidermal and full thickness skin models: representative fluorescence and H&E images of epidermal (C,a) and full thickness models (C,b) cultured for 14 days at the air–liquid interface. Samples were exposed to a concentration range of SDS for 1 h, followed by the application of the green fluorescent dye lucifer yellow for 20 min to assess the penetration of dye diffusion and barrier integrity. Note the penetration of the dye at the concentration of 0.25% SDS and higher, and the damage inflicted to the surface of the culture model. Scale bars: 100 μm.

References

    1. Ackermann K, Borgia SL, Korting HC, et al. (2010) The Phenion full‐thickness skin model for percutaneous absorption testing. Skin Pharmacol Physiol 23, 105–112. - PubMed
    1. Andreadis ST, Hamoen KE, Yarmush ML, et al. (2001) Keratinocyte growth factor induces hyperproliferation and delays differentiation in a skin equivalent model system. FASEB J 15, 898–906. - PubMed
    1. Auxenfans C, Fradette J, Lequeux C, et al. (2009) Evolution of three dimensional skin equivalent models reconstructed in vitro by tissue engineering. Eur J Dermatol 19, 107–113. - PubMed
    1. Bazzoni G, Dejana E (2002) Keratinocyte junctions and the epidermal barrier: how to make a skin‐tight dress. J Cell Biol 156, 947–949. - PMC - PubMed
    1. Bertolero F, Kaighn ME, Gonda MA, et al. (1984) Mouse epidermal keratinocytes. Clonal proliferation and response to hormones and growth factors in serum‐free medium. Exp Cell Res 155, 64–80. - PubMed

Publication types

Substances