. 2019 Feb;7(3):e13992.
doi: 10.14814/phy2.13992.

Effect of adenosine on short-term synaptic plasticity in mouse piriform cortex in vitro: adenosine acts as a high-pass filter

Affiliations

Effect of adenosine on short-term synaptic plasticity in mouse piriform cortex in vitro: adenosine acts as a high-pass filter

Simon P Perrier et al. Physiol Rep. 2019 Feb.

Abstract

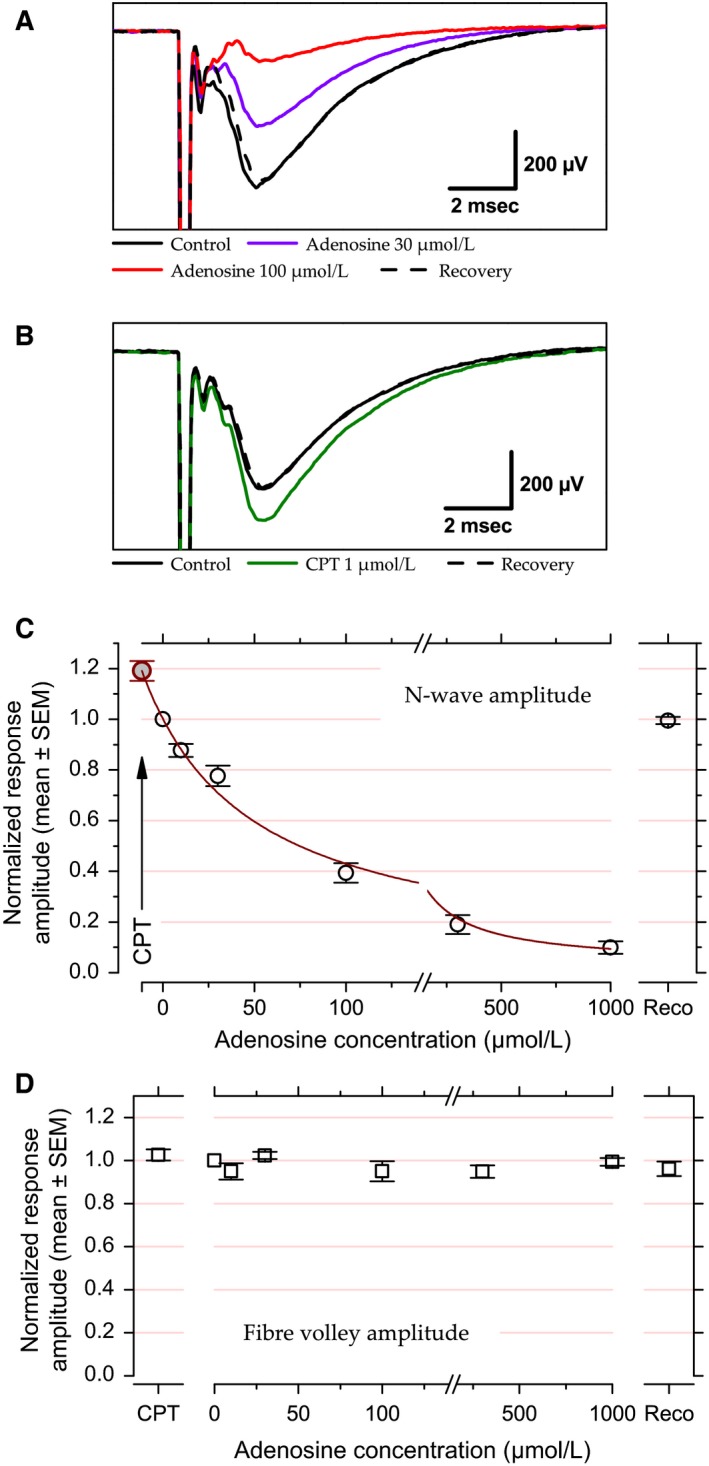
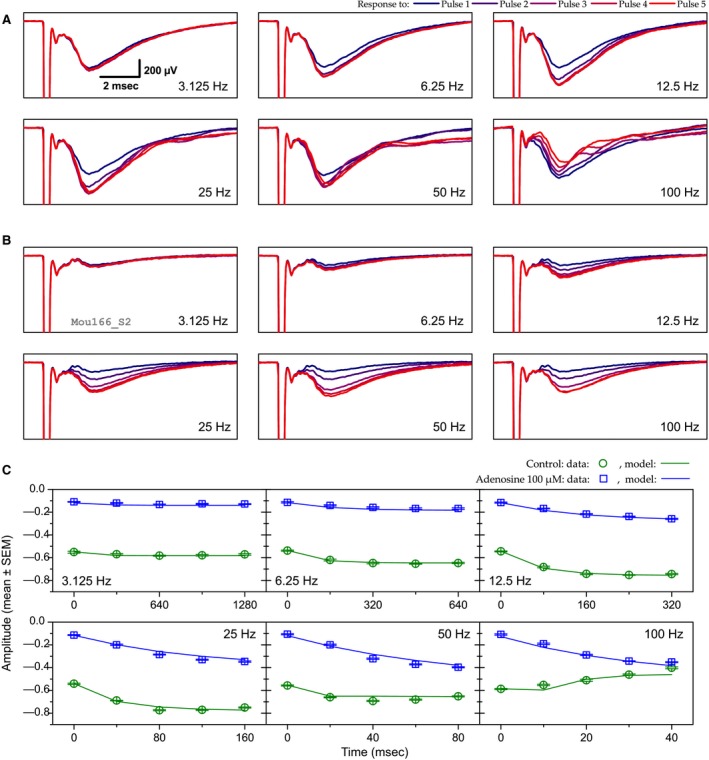
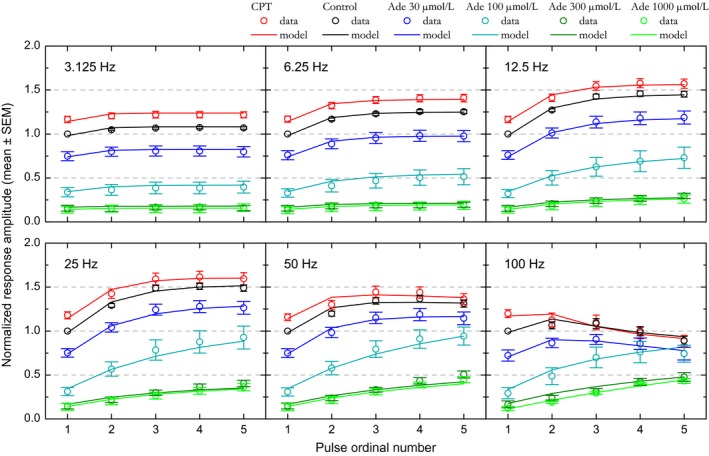
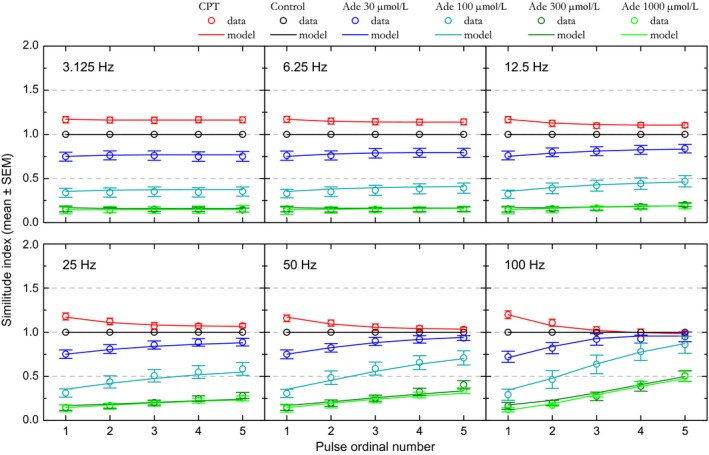
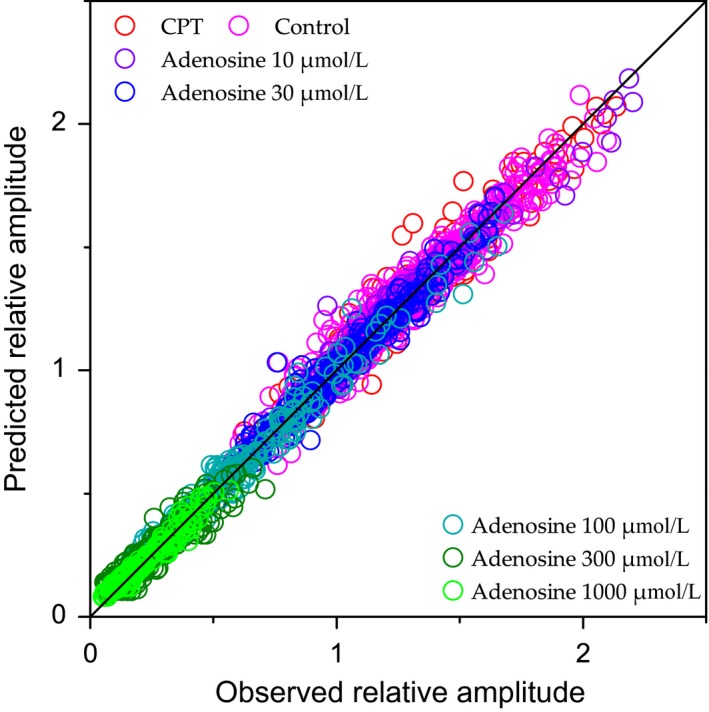
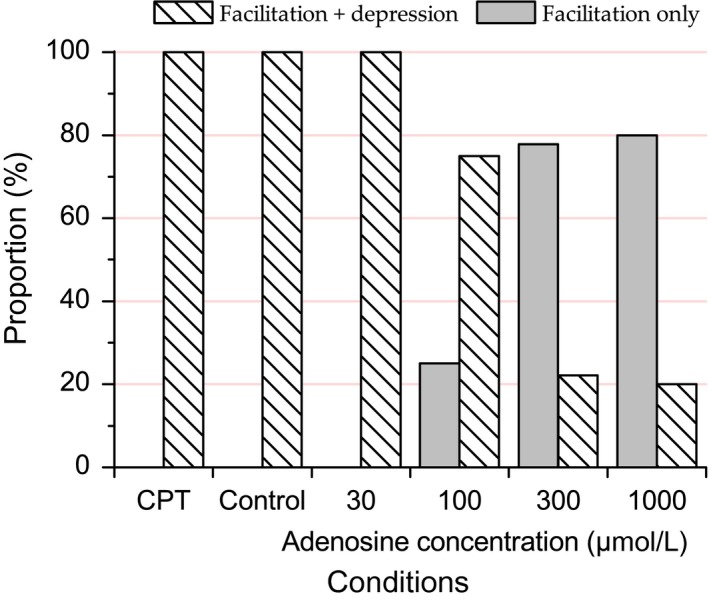
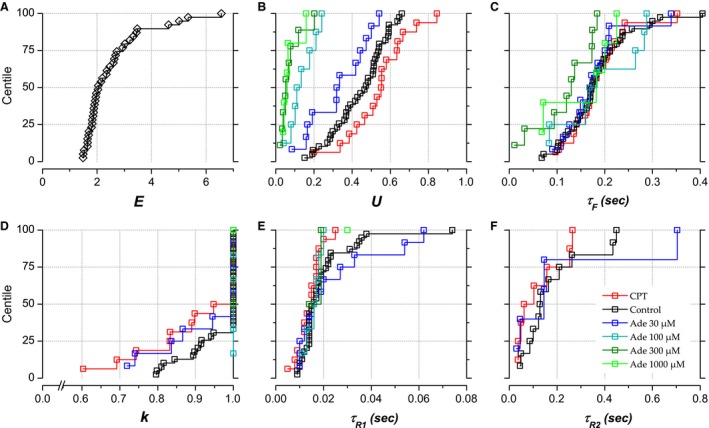
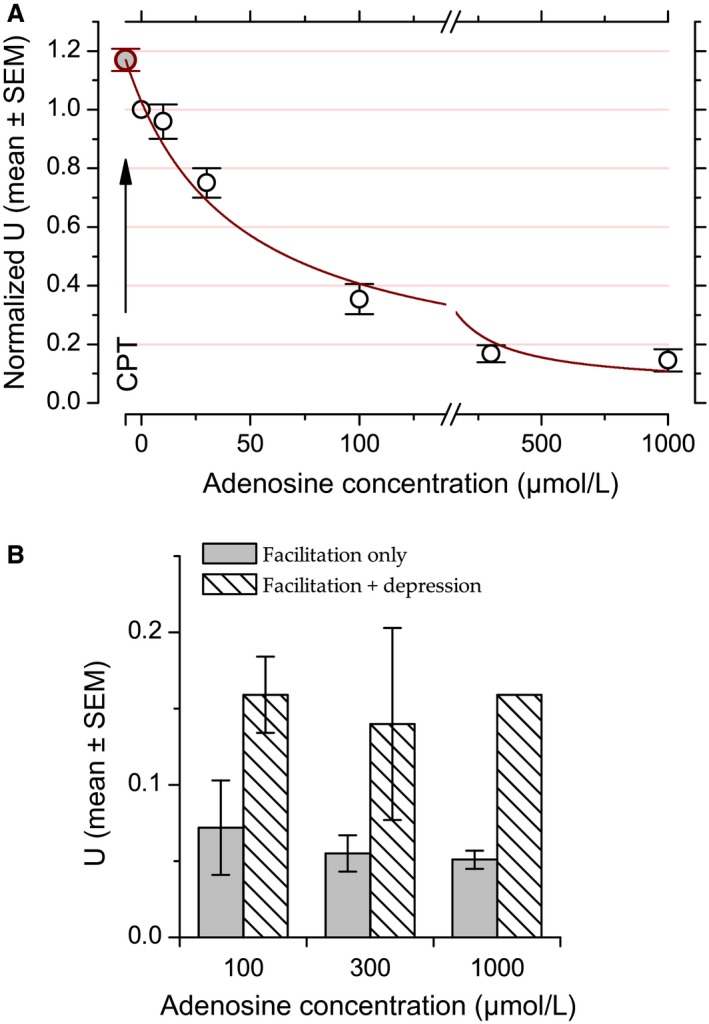
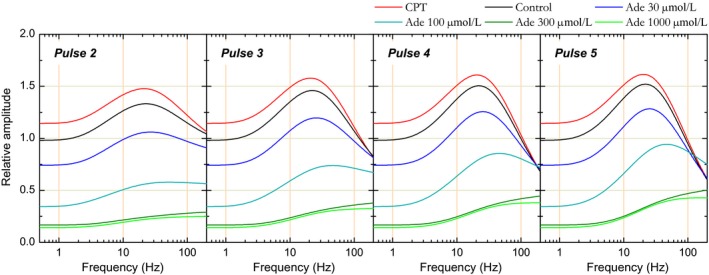
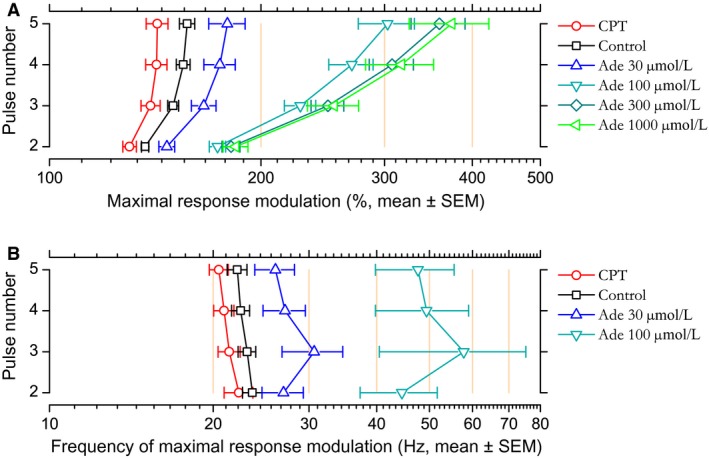
We examined the effect of adenosine and of adenosine A1 receptor blockage on short-term synaptic plasticity in slices of adult mouse anterior piriform cortex maintained in vitro in an in vivo-like ACSF. Extracellular recording of postsynaptic responses was performed in layer 1a while repeated electrical stimulation (5-pulse-trains, frequency between 3.125 and 100 Hz) was applied to the lateral olfactory tract. Our stimulation protocol was aimed at covering the frequency range of oscillatory activities observed in the olfactory bulb in vivo. In control condition, postsynaptic response amplitude showed a large enhancement for stimulation frequencies in the beta and gamma frequency range. A phenomenological model of short-term synaptic plasticity fitted to the data suggests that this frequency-dependent enhancement can be explained by the interplay between a short-term facilitation mechanism and two short-term depression mechanisms, with fast and slow recovery time constants. In the presence of adenosine, response amplitude evoked by low-frequency stimulation decreased in a dose-dependent manner (IC50 = 70 μmol/L). Yet short-term plasticity became more dominated by facilitation and less influenced by depression. Both changes compensated for the initial decrease in response amplitude in a way that depended on stimulation frequency: compensation was strongest at high frequency, up to restoring response amplitudes to values similar to those measured in control condition. The model suggested that the main effects of adenosine were to decrease neurotransmitter release probability and to attenuate short-term depression mechanisms. Overall, these results suggest that adenosine does not merely inhibit neuronal activity but acts in a more subtle, frequency-dependent manner.

Keywords: A1 receptor; oscillation; piriform cortex; presynaptic inhibition; short-term plasticity.


Figures

Figure 1
Figure 1
Effects of exogenous and endogenous adenosine on response amplitude evoked at 0.5 Hz at the LOT‐layer 1a synapse. (A) Example of LFP recorded in layer 1a of the piriform cortex with two different adenosine concentrations (30 and 100 μmol/L) compared to control and recovery conditions. (B) Example of LFP recorded in presence or absence of CPT. (C) Population data for N‐wave amplitude fitted with Prince and Stevens (1992)'s model. Data points correspond to the mean and error bars to ±1 SEM computed after normalizing the individual N‐wave amplitudes to their corresponding control values. Red line corresponds to the fit (fit weighted by variance, R 2 = 0.99). Note that the value obtained in the presence of CPT (arrow, c 0 = −11.4 μmol/L, NRA max = 1.19) was plotted after fitting. (D) Population data for fiber volley amplitude versus CPT and adenosine concentrations. Data points correspond to the mean and error bars to ±1 SEM computed after normalizing the individual fiber volley amplitudes to their corresponding control values. For enhancing data visibility, the x‐axis has been split and is presented with different scales before and after the break in C and D.
Figure 2
Figure 2
Example of the effect of adenosine (100 μmol/L) on short‐term synaptic plasticity. (A and B) The six panels in A and B correspond to the six stimulation frequencies (from 3.125 to 100 Hz). Each panel shows the mean LFP trace for each of the five consecutive stimuli of a stimulation train at a given frequency. Pulse ranks are color coded from the first one (blue) to the fifth one (red). Results obtained in the control condition and in the presence of adenosine 100 μmol/L are represented in A and B, respectively. Scale in the 3.125 Hz panel in A applies to all other panels. (C) Peak N‐wave amplitude (in mV) as a function of stimulus timing and frequency. Points represent the mean experimental data (error bars denote ±1 SEM) while solid lines represent STP model fits. Green symbols and lines correspond to control situation and blue ones to adenosine 100 μmol/L. Model parameters: shared parameter, E = 1.957. Control: U = 0.509, τ F = 151 msec, k = 1, τ R1 = 19 msec; adenosine 100 μmol/L: U = 0.11; τ F = 184 msec; k = 1; τ R1 = 11 msec. RMSE = 0.032.
Figure 3
Figure 3
Example of CPT effect on short‐term synaptic plasticity. Same conventions as in Figure. 2. (A) control LFPs. (B) LFPs in CPTμmol/L. (C) N‐wave amplitude, experimental data, and model fit. Green symbols and lines: control; red symbols and lines: CPT. Model parameters: shared parameter, E = 1.703. Control: U = 0.575, τ F  = 163 msec, k = 0.916, τ R1 = 14 msec, τ R2 = 100 msec; CPTμmol/L: U = 0.666; τ F = 167 msec; k = 0.89; τ R1 = 12 msec, τ R2 = 62 msec. RMSE = 0.039.
Figure 4
Figure 4
Effect of adenosine and CPT on short‐term synaptic plasticity at the population level. CPT (adenosine A1 receptor antagonist) and different extracellular adenosine concentrations (30, 100, 300, and 1000 μmol/L) have been tested. Relative amplitudes associated with each condition are plotted as a function of stimulation pulse rank and of stimulation frequency. Experimental data are represented by the colored dots. Error bars represent the SEM. The means of the values predicted by the STP model are represented by colored solid lines. SEM values for model predictions were similar to those for experimental data and are not shown for alleviating the figure.
Figure 5
Figure 5
Changes in “similitude index” indicate that short‐term synaptic plasticity counteracts adenosine inhibition at high stimulation frequency. The similitude index corresponds, for a stimulus of order n, to the ratio of N‐wave amplitude in a given condition (adenosine or CPT) divided by the control N‐wave amplitude. Similitude indices associated with each condition are plotted as a function of stimulation pulse rank and stimulation frequency (3.125–100 Hz). Colored dots indicate the means for the different tests (CPT and adenosine at 30, 100, 300, and 1000 μmol/L). Error bars represent the SEM. Continuous lines represent the mean similitude index calculated from values predicted by the STP model. SEM values for model predictions were similar to those for experimental data and are not shown for alleviating the figure.
Figure 6
Figure 6
Scatterplot of predicted relative amplitudes as a function of observed relative amplitudes. Each relative response amplitude is symbolized by a color corresponding to the associated experimental condition. In total, 2620 pairs of values are represented. Perfect prediction is represented by the diagonal in black. A linear correlation was calculated to compare the model predictions to the observed values, which gave an of 0.988.
Figure 7
Figure 7
Proportion of models fitted with both depression and facilitation mechanisms or with facilitation mechanism only. Number of cases fitted with either one or two depression mechanisms did not depend on experimental conditions such that cases with either one or two depression mechanisms have been lumped together. The proportion of cases fitted with facilitation only (vs. facilitation + one or two depression mechanisms) was significantly dependent on the experimental condition and was higher with higher adenosine concentrations.
Figure 8
Figure 8
Short‐term synaptic plasticity parameters: cumulative distributions at the population level. Parameters optimized to fit the observed STP data are presented as cumulative distributions (centile plots) for data obtained in control condition (black), in CPT (red) and in adenosine 30–1000 μmol/L (blue, cyan, olive, and green). The line at 50% in centile plots indicates the median of the distributions and lines at 25% and 75% delineate the interquartile range. (A) E, global synaptic efficacy. (B) U, utilization of efficacy at the first stimulation. (C) τ F, recovery time constant of facilitation mechanism. (D) k, coefficient defining the partition of synaptic resources to depression mechanisms with either fast or slow recovery (slow‐depression mechanism dismissed when k = 1). (E) τ R1, time constant of recovery for fast‐depression mechanism. (F) τ R2, time constant of recovery for slow depression mechanism.
Figure 9
Figure 9
(A) Changes in model parameter U as a function of experimental condition fitted with Prince and Stevens (1992)'s model. Data points correspond to the mean and error bars to ±1 SEM computed after normalizing the individual U values to their associated control values. For enhancing data visibility, the x‐axis has been split and is presented with different scales before and after the break. The red line corresponds to Prince and Stevens (1992)'s model fit (weighted by variance, R 2 = 0.98). The data point corresponding to CPT condition at coordinates c 0 = −7.3 μmol/L and U max = 1.17 (arrow) was added after fitting. (B) Requirement for depression in model fit is associated with higher values of U. Bar height represents the mean U value (±1 SEM) in model best fitted with (hatched bars) or without (grey bars) depression mechanisms in the presence of adenosine at 100, 300, and 1000 μmol/L.
Figure 10
Figure 10
Simulation of relative response amplitude as a function of stimulation frequency reconstructed from short‐term plasticity model parameters in the different conditions and for each consecutive stimulation pulse. Simulations were first produced for each experimental condition and each stimulation pulse using model parameters issued from each individual case. Simulations pertaining to the same stimulation pulse and to the same experimental condition were then averaged and the corresponding curves are presented in the figure: panels correspond to pulses 2–5 and the different lines in each panel to the different experimental conditions (CPT, control, and adenosine 30–1000 μmol/L).
Figure 11
Figure 11
(A) Maximal response modulation in CPT, control, and different adenosine concentrations. Maximal response modulation was extracted from individual simulation of STP calculated using parameters of the model fitted to each individual case. Dots correspond to the means calculated for each consecutive stimulating pulse and error bar represent the SEM. (B) Frequency at which maximal response modulation occurred (mean ± SEM). This frequency could not be determined for simulations that lacked a peak followed by a decline for frequencies ≤200 Hz. As a consequence, reduced sample sizes precluded showing frequency data for adenosine 300 and 1000 μmol/L.

References

    1. Adrian, E. D. 1950. The electrical activity of the mammalian olfactory bulb. Electroencephalogr. Clin. Neurophysiol. 2:377–388. - PubMed
    1. Adrian, E. D. , and Matthews B. H. C.. 1934. The interpretation of potential waves in the cortex. J. Physiol. 81:440–471. - PMC - PubMed
    1. Ballarín, M. , Fredholm B. B., Ambrosio S., and Mahy N.. 1991. Extracellular levels of adenosine and its metabolites in the striatum of awake rats: inhibition of uptake and metabolism. Acta Physiol. Scand. 142:97–103. - PubMed
    1. Bannon, N. M. , Zhang P., Ilin V., Chistiakova M., and Volgushev M.. 2014. Modulation of synaptic transmission by adenosine in layer 2/3 of the rat visual cortex in vitro. Neuroscience 260:171–184. - PMC - PubMed
    1. Berger, H. 1929. Über das elektrenkephalogramm des menschen. Arch. Psychiatr. Nervenkr. 87:527–570.

Publication types

LinkOut - more resources