. 2019 Feb 11;9(1):1761.
doi: 10.1038/s41598-018-37981-x.

A comparative in vitro study of the osteogenic and adipogenic potential of human dental pulp stem cells, gingival fibroblasts and foreskin fibroblasts

Affiliations

A comparative in vitro study of the osteogenic and adipogenic potential of human dental pulp stem cells, gingival fibroblasts and foreskin fibroblasts

Riccardo Monterubbianesi et al. Sci Rep. .

Abstract

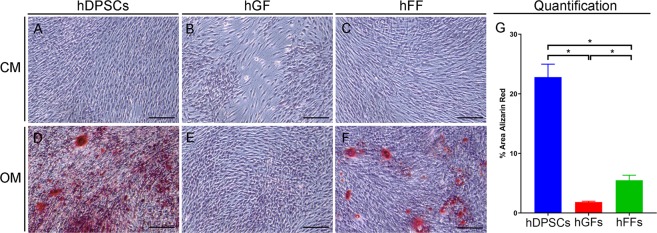
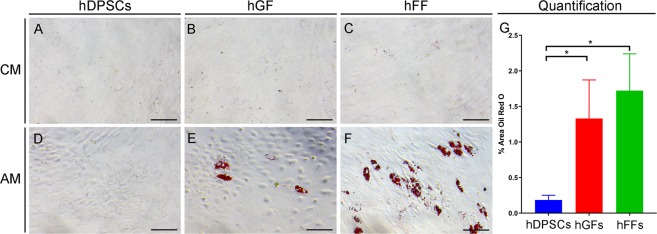
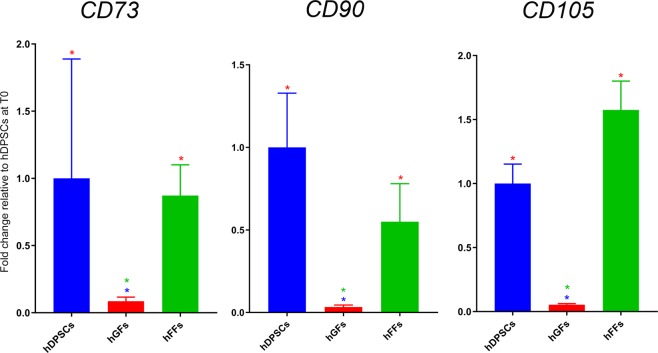
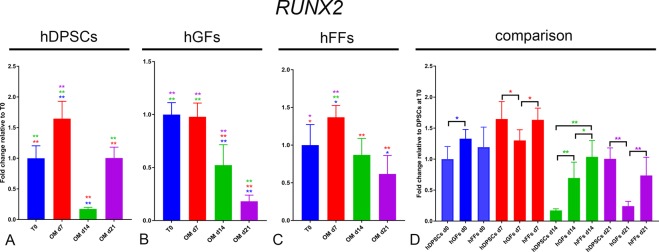
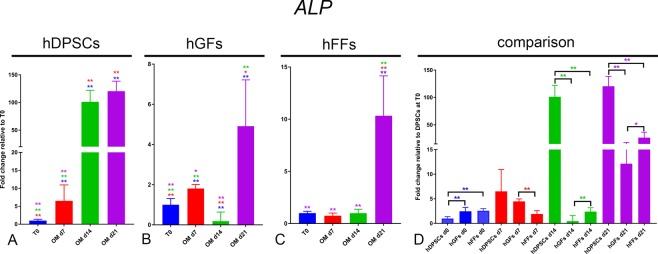
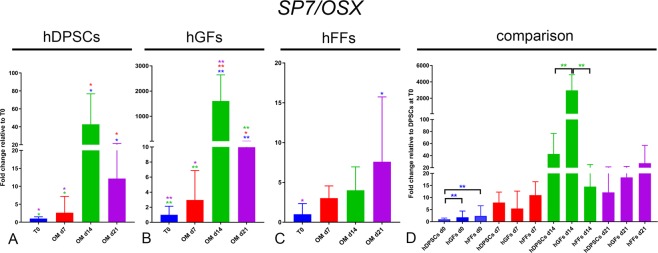
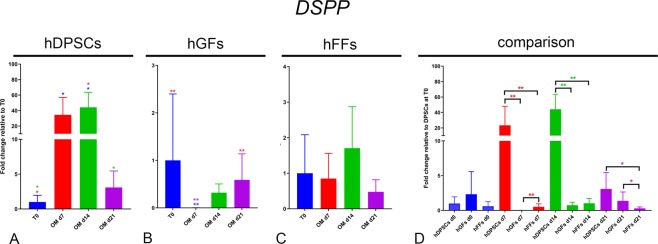
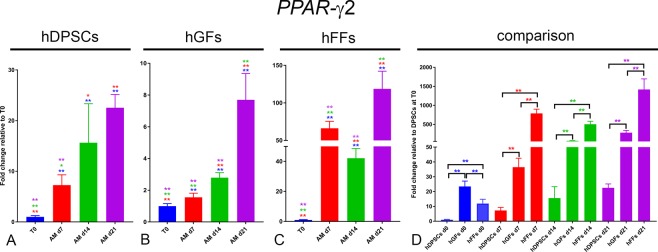
Human teeth contain a variety of mesenchymal stem cell populations that could be used for cell-based regenerative therapies. However, the isolation and potential use of these cells in the clinics require the extraction of functional teeth, a process that may represent a significant barrier to such treatments. Fibroblasts are highly accessible and might represent a viable alternative to dental stem cells. We thus investigated and compared the in vitro differentiation potential of human dental pulp stem cells (hDPSCs), gingival fibroblasts (hGFs) and foreskin fibroblasts (hFFs). These cell populations were cultured in osteogenic and adipogenic differentiation media, followed by Alizarin Red S and Oil Red O staining to visualize cytodifferentiation. Quantitative Real-Time Polymerase Chain Reaction (qRT-PCR) was performed to assess the expression of markers specific for stem cells (NANOG, OCT-4), osteogenic (RUNX2, ALP, SP7/OSX) and adipogenic (PPAR-γ2, LPL) differentiation. While fibroblasts are more prone towards adipogenic differentiation, hDPSCs exhibit a higher osteogenic potential. These results indicate that although fibroblasts possess a certain mineralization capability, hDPSCs represent the most appropriate cell population for regenerative purposes involving bone and dental tissues.


Conflict of interest statement

The authors declare no competing interests.

Figures

Figure 1
Figure 1
Microscopic views of Alizarin Red S staining of cultured human dental pulp stem cells (hDPSCs), human gingival fibroblasts (hGFs) and human foreskin fibroblasts (hFFs) cultured for 21 days with control medium (CM; AC) and osteogenic medium (OM; DF). Calcium deposits (red color) are evident in hDPSCs (D) and hFFs (F), but not in hGFs (E), cultured in OM. (G) Quantification of Alizarin Red staining as proportion of Alizarin-red-positive surface (in %). Asterisks: Mann Whitney – U/Wilcox Rank Sum Test, *p < 0.05; **p < 0.01. Colour of asterisks onto each column indicates the column used for the comparison. Abbreviations: CM, control medium; hDPSCs, human dental pulp stem cells; hFF, human foreskin fibroblasts; hGF, human gingival fibroblasts; OM, osteogenic medium. Scale bars: 100 μm.
Figure 2
Figure 2
Microscopic views of Oil Red O staining of cultured hDPSCs, hGFs and hFFs on day 21 of incubation with control medium (CM; AC) and adipogenic medium (AM; DF). Lipid droplets in red color are visible in hGFs (E) and hFFs (F), but not in hDPSCs (D), cultured in the presence of AM. (G) Quantification of oil red O staining as proportion of oil red 0-positive surface (in %). Asterisks: Mann Whitney – U/Wilcox Rank Sum Test, *p < 0.05; **p < 0.01. Colour of asterisks onto each column indicates the column used for the comparison. Abbreviations: AM, adipogenic medium; CM, control medium; hDPSCs, human dental pulp stem cells; hFF, human foreskin fibroblasts; hGF, human gingival fibroblasts. Scale bars: 100 μm.
Figure 3
Figure 3
Gene expression levels of CD73, CD90 and CD105 in hDPSCs, hGFs and hFFs cultured in control conditions. Fold change is normalized to hDPSCs. Asterisks: Mann Whitney – U/Wilcox Rank Sum Test, *p < 0.05; **p < 0.01. Colour of asterisks onto each column indicates the column used for the comparison. Abbreviations: hDPSCs, human dental pulp stem cells; hFF, human foreskin fibroblasts; hGF, human gingival fibroblasts.
Figure 4
Figure 4
Gene expression levels of NANOG in cultured hDPSCs (A), hGFs (B) and hFFs (C) for 0, 7, 14 and 21 days in presence of OM and AM, relative to the respective expression levels at T0. D) Expression levels of NANOG normalized for NANOG expression in hDPSCs at T0 Asterisks: Mann Whitney – U/Wilcox Rank Sum Test, *p < 0.05; **p < 0.01. Colour of asterisks onto each column indicates the column used for the comparison. Abbreviations: hDPSCs, human dental pulp stem cells; hFF, human foreskin fibroblasts; hGF, human gingival fibroblasts; OM, osteogenic medium; AM, adipogenic medium.
Figure 5
Figure 5
Gene expression levels of OCT-4 in cultured hDPSCs (A), hGFs (B) and hFFs (C) for 0, 7, 14 and 21 days in presence of OM and AM, relative to the respective expression levels at T0. (D) Expression levels of OCT-4 normalized for OCT-4 expression in hDPSCs at T0. Asterisks: Mann Whitney – U/Wilcox Rank Sum Test, *p < 0.05; **p < 0.01. Colour of asterisks onto each column indicates the column used for the comparison. Abbreviations: hDPSCs, human dental pulp stem cells; hFF, human foreskin fibroblasts; hGF, human gingival fibroblasts; OM, osteogenic medium; AM, adipogenic medium.
Figure 6
Figure 6
Gene expression levels of RUNX2 in cultured hDPSCs (A), hGFs (B) and hFFs (C) for 0, 7, 14 and 21 days in presence of OM, relative to the respective expression levels at T0. (D) Expression levels of RUNX2 normalized for RUNX2 expression in hDPSCs at T0. Asterisks: Mann Whitney – U/Wilcox Rank Sum Test, *p < 0.05; **p < 0.01. Colour of asterisks onto each column indicates the column used for the comparison. Abbreviations: hDPSCs, human dental pulp stem cells; hFF, human foreskin fibroblasts; hGF, human gingival fibroblasts; OM, osteogenic medium.
Figure 7
Figure 7
Gene expression levels of ALP in cultured hDPSCs (A), hGFs (B) and hFFs (C) for 0, 7, 14 and 21 days in presence of OM, relative to the respective expression levels at T0. (D) Expression levels of ALP normalized for ALP expression in hDPSCs at T0. Asterisks: Mann Whitney – U/Wilcox Rank Sum Test, *p < 0.05; **p < 0.01. Colour of asterisks onto each column indicates the column used for the comparison. Abbreviations: hDPSCs, human dental pulp stem cells; hFF, human foreskin fibroblasts; hGF, human gingival fibroblasts; OM, osteogenic medium.
Figure 8
Figure 8
Gene expression levels of OSX in cultured hDPSCs (A), hGFs (B) and hFFs (C) for 0, 7, 14 and 21 days in presence of OM, relative to the respective expression levels at T0. (D) Expression levels of OSX normalized for OSX expression in hDPSCs at T0. Asterisks: Mann Whitney – U/Wilcox Rank Sum Test, *p < 0.05; **p < 0.01. Colour of asterisks onto each column indicates the column used for the comparison. Abbreviations: hDPSCs, human dental pulp stem cells; hFF, human foreskin fibroblasts; hGF, human gingival fibroblasts; OM, osteogenic medium.
Figure 9
Figure 9
Gene expression levels of DSPP in cultured hDPSCs (A), hGFs (B) and hFFs (C) for 0, 7, 14 and 21 days in presence of OM, relative to the respective expression levels at T0. (D) Expression levels of DSPP normalized for OSX expression in hDPSCs at T0. Asterisks: Mann Whitney – U/Wilcox Rank Sum Test, *p < 0.05; **p < 0.01. Colour of asterisks onto each column indicates the column used for the comparison. Abbreviations: hDPSCs, human dental pulp stem cells; hFF, human foreskin fibroblasts; hGF, human gingival fibroblasts; OM, osteogenic medium.
Figure 10
Figure 10
Gene expression levels of PPAR-γ2 in cultured hDPSCs (A), hGFs (B) and hFFs (C) for 1, 7, 14 and 21 days in presence of AM, relative to the respective expression levels at T0. (D) Expression levels of PPAR-γ2 normalized for PPAR-γ2 expression in hDPSCs at T0. Asterisks: Mann Whitney – U/Wilcox Rank Sum Test, *p < 0.05; **p < 0.01. Colour of asterisks onto each column indicates the column used for the comparison. Abbreviations: hDPSCs, human dental pulp stem cells; hFF, human foreskin fibroblasts; hGF, human gingival fibroblasts; AM, adipogenic medium.
Figure 11
Figure 11
Gene expression levels of LPL in cultured hDPSCs (A), hGFs (B) and hFFs (C) for 0, 7, 14 and 21 days in presence of AM, relative to the respective expression levels at T0. (D) Expression levels of LPL normalized for LPL expression in hDPSCs at T0. Asterisks: Mann Whitney – U/Wilcox Rank Sum Test, *p < 0.05; **p < 0.01. Colour of asterisks onto each column indicates the column used for the comparison. Abbreviations: hDPSCs, human dental pulp stem cells; hFF, human foreskin fibroblasts; hGF, human gingival fibroblasts; AM, adipogenic medium.

Similar articles

Cited by

References

    1. Signer RAJ, Morrison SJ. Mechanisms that regulate stem cell aging and life span. Cell Stem Cell. 2013;12:152–165. doi: 10.1016/j.stem.2013.01.001. - DOI - PMC - PubMed
    1. Mitsiadis TA, Barrandon O, Rochat A, Barrandon Y, De Bari C. Stem cell niches in mammals. Exp. Cell Res. 2007;313:3377–3385. doi: 10.1016/j.yexcr.2007.07.027. - DOI - PubMed
    1. Barry FP, Murphy JM. Mesenchymal stem cells: clinical applications and biological characterization. Int J Biochem Cell Biol. 2004;36:568–584. doi: 10.1016/j.biocel.2003.11.001. - DOI - PubMed
    1. Heino TJ, Hentunen TA. Differentiation of osteoblasts and osteocytes from mesenchymal stem cells. Curr Stem Cell Res Ther. 2008;3:131–145. doi: 10.2174/157488808784223032. - DOI - PubMed
    1. Beyer Nardi, N. & da Silva Meirelles, L. Mesenchymal stem cells: isolation, in vitro expansion and characterization. Handb Exp Pharmacol 249–282 (2006). - PubMed

Publication types