

Genome-wide Identification, Expression Profiling and Evolutionary Analysis of Auxin Response Factor Gene Family in Potato (Solanum tuberosum Group Phureja)
- PMID: 30742001
- PMCID: PMC6370904
- DOI: 10.1038/s41598-018-37923-7
Genome-wide Identification, Expression Profiling and Evolutionary Analysis of Auxin Response Factor Gene Family in Potato (Solanum tuberosum Group Phureja)
Abstract
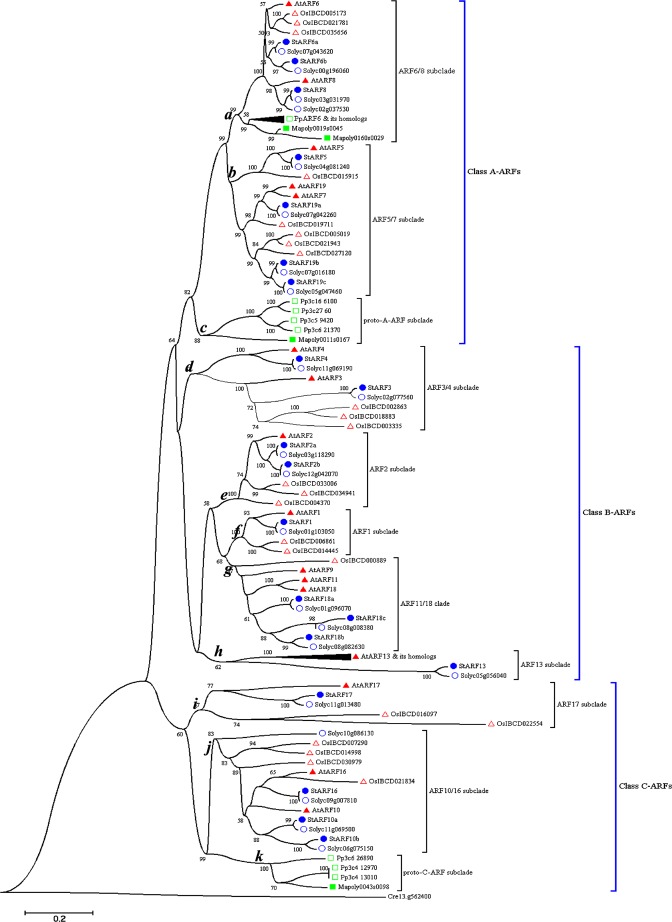
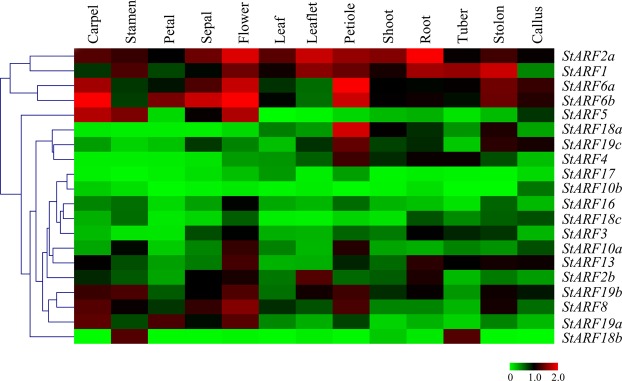
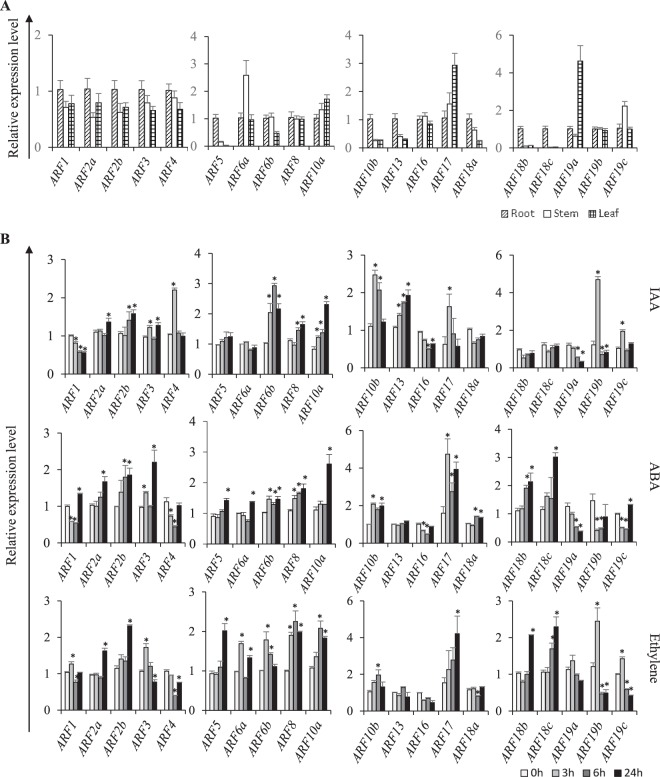
Auxin response factors (ARFs) play central roles in conferring auxin-mediated responses through selection of target genes in plants. Despite their physiological importance, systematic analysis of ARF genes in potato have not been investigated yet. Our genome-wide analysis identified 20 StARF (Solanum tuberosum ARF) genes from potato and found that they are unevenly distributed in all the potato chromosomes except chromosome X. Sequence alignment and conserved motif analysis suggested the presence of all typical domains in all but StARF18c that lacks B3 DNA-binding domain. Phylogenetic analysis indicated that potato ARF could be clustered into 3 distinct subgroups, a result supported by exon-intron structure, consensus motifs, and domain architecture. In silico expression analysis and quantitative real-time PCR experiments revealed that several StARFs were expressed in tissue-specific, biotic/abiotic stress-responsive or hormone-inducible manners, which reflected their potential roles in plant growth, development or under various stress adaptions. Strikingly, most StARFs were identified as highly abiotic stress responsive, indicating that auxin signaling might be implicated in mediating environmental stress-adaptation responses. Taken together, this analysis provides molecular insights into StARF gene family, which paves the way to functional analysis of StARF members and will facilitate potato breeding programs.
Conflict of interest statement
The authors declare no competing interests.
Figures


Similar articles
-
Genome-Wide Identification, Expression Profile and Evolution Analysis of Karyopherin β Gene Family in Solanum tuberosum Group Phureja DM1-3 Reveals Its Roles in Abiotic Stresses.Int J Mol Sci. 2020 Jan 31;21(3):931. doi: 10.3390/ijms21030931. Int J Mol Sci. 2020. PMID: 32023817 Free PMC article.
-
MYB Gene Family in Potato (Solanum tuberosum L.): Genome-Wide Identification of Hormone-Responsive Reveals Their Potential Functions in Growth and Development.Int J Mol Sci. 2019 Sep 29;20(19):4847. doi: 10.3390/ijms20194847. Int J Mol Sci. 2019. PMID: 31569557 Free PMC article.
-
Genome-wide organization and expression profiling of the NAC transcription factor family in potato (Solanum tuberosum L.).DNA Res. 2013 Aug;20(4):403-23. doi: 10.1093/dnares/dst019. Epub 2013 May 5. DNA Res. 2013. PMID: 23649897 Free PMC article.
-
Auxins in potato: molecular aspects and emerging roles in tuber formation and stress resistance.Plant Cell Rep. 2019 Jun;38(6):681-698. doi: 10.1007/s00299-019-02395-0. Epub 2019 Feb 9. Plant Cell Rep. 2019. PMID: 30739137 Review.
-
Role of microRNAs and their putative mechanism in regulating potato (Solanum tuberosum L.) life cycle and response to various environmental stresses.Plant Physiol Biochem. 2024 Feb;207:108334. doi: 10.1016/j.plaphy.2024.108334. Epub 2024 Jan 3. Plant Physiol Biochem. 2024. PMID: 38219424 Review.
Cited by
-
Genome-Wide Identification and Characterization of Auxin Response Factor (ARF) Gene Family Involved in Wood Formation and Response to Exogenous Hormone Treatment in Populus trichocarpa.Int J Mol Sci. 2023 Jan 1;24(1):740. doi: 10.3390/ijms24010740. Int J Mol Sci. 2023. PMID: 36614182 Free PMC article.
-
Whole-Genome Duplication and Purifying Selection Contributes to the Functional Redundancy of Auxin Response Factor (ARF) Genes in Foxtail Millet (Setaria italica L.).Int J Genomics. 2021 Aug 6;2021:2590665. doi: 10.1155/2021/2590665. eCollection 2021. Int J Genomics. 2021. PMID: 34414231 Free PMC article.
-
Molecular Evolution and Local Root Heterogeneous Expression of the Chenopodium quinoa ARF Genes Provide Insights into the Adaptive Domestication of Crops in Complex Environments.J Mol Evol. 2021 Jun;89(4-5):287-301. doi: 10.1007/s00239-021-10005-5. Epub 2021 Mar 23. J Mol Evol. 2021. PMID: 33755734
-
Canonical and Alternative Auxin Signaling Systems in Mono-, Di-, and Tetraploid Potatoes.Int J Mol Sci. 2023 Jul 13;24(14):11408. doi: 10.3390/ijms241411408. Int J Mol Sci. 2023. PMID: 37511169 Free PMC article.
-
Characterization and transcriptomic analysis provide novel insights into the sexual differentiation of the dioecious plant Bama Huoma (Cannabis sativa).BMC Plant Biol. 2025 Aug 21;25(1):1108. doi: 10.1186/s12870-025-07096-3. BMC Plant Biol. 2025. PMID: 40841596 Free PMC article.
References
Publication types
MeSH terms
Substances
LinkOut - more resources
Full Text Sources
