. 2019 Feb 11;10(1):706.
doi: 10.1038/s41467-019-08641-z.

Japanese encephalitis virus neuropenetrance is driven by mast cell chymase

Affiliations

Japanese encephalitis virus neuropenetrance is driven by mast cell chymase

Justin T Hsieh et al. Nat Commun. .

Abstract

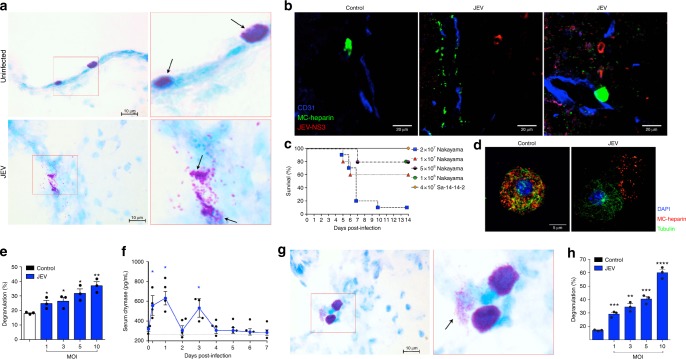
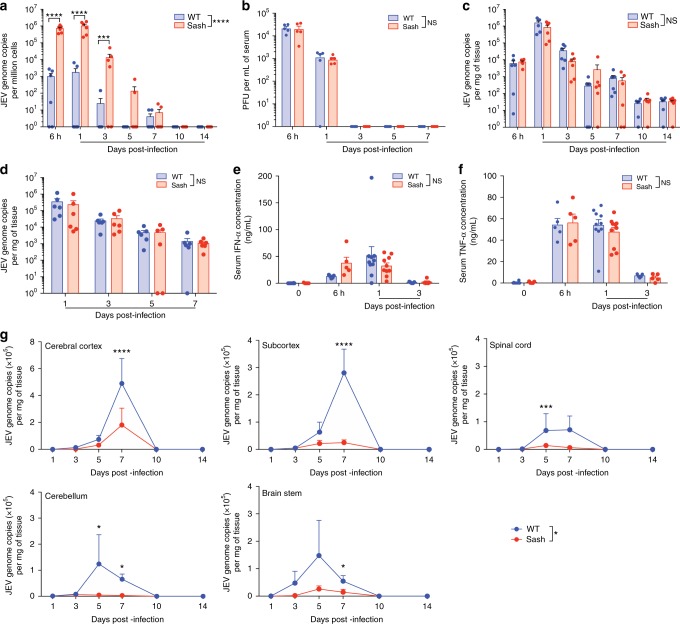
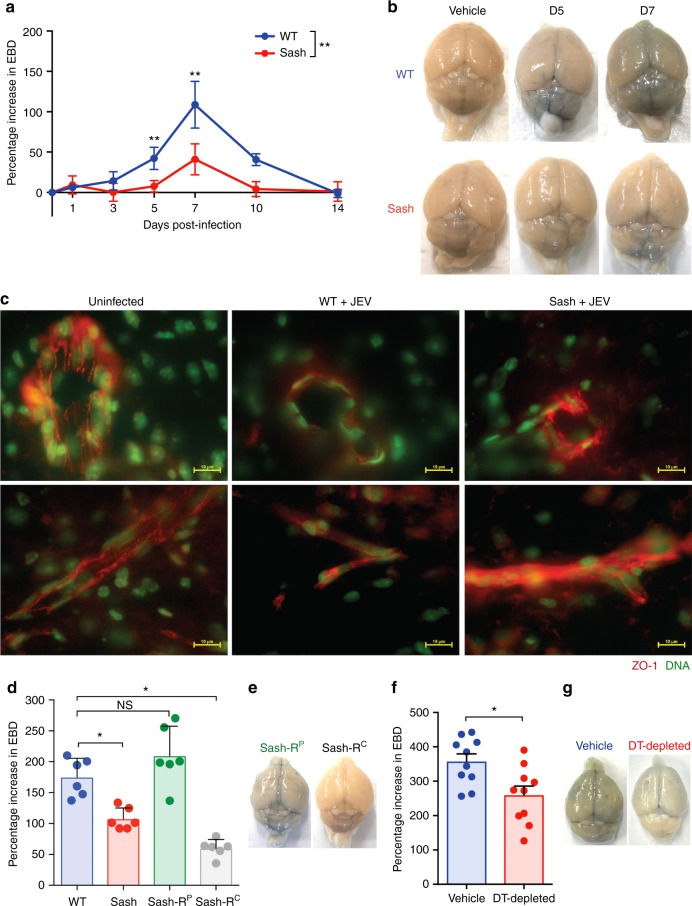
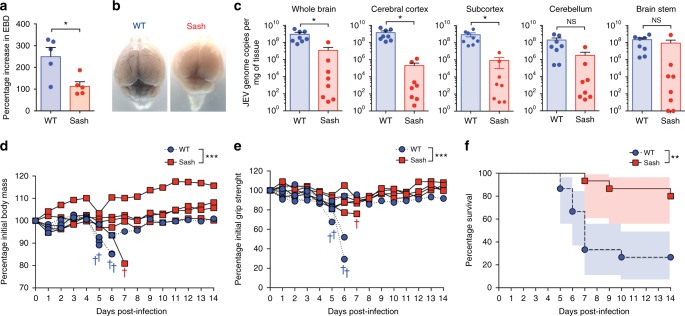
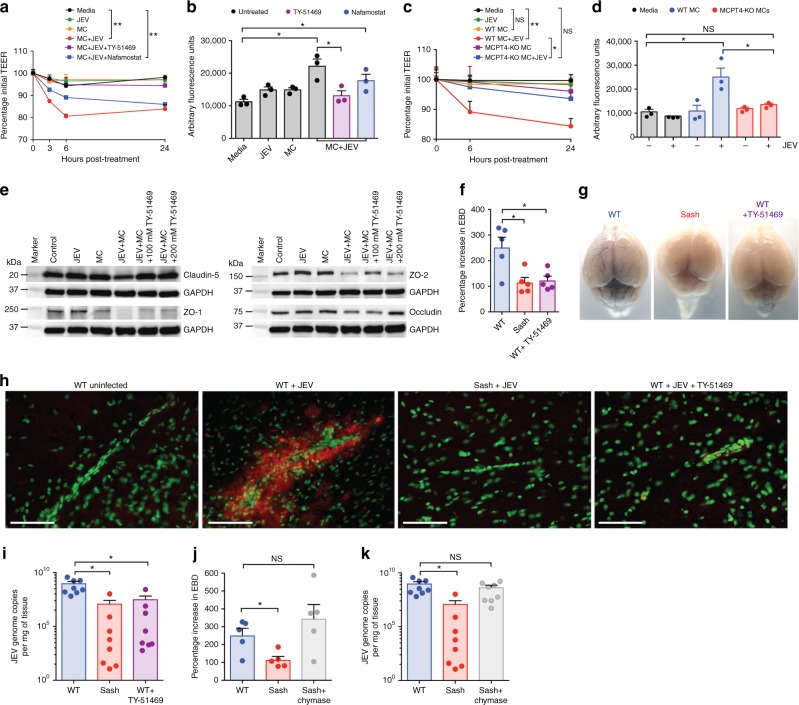
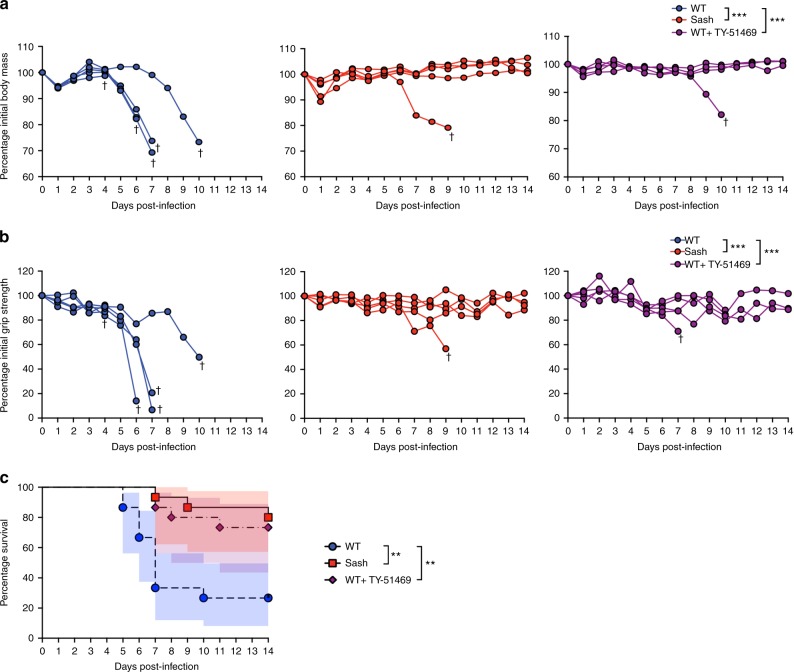
Japanese encephalitis virus (JEV) is a leading cause of viral encephalitis. However, the mechanisms of JEV penetration of the blood-brain-barrier (BBB) remain poorly understood. Mast cells (MCs) are granulated innate immune sentinels located perivascularly, including at the BBB. Here we show that JEV activates MCs, leading to the release of granule-associated proteases in vivo. MC-deficient mice display reduced BBB permeability during JEV infection compared to congenic wild-type (WT) mice, indicating that enhanced vascular leakage in the brain during JEV infection is MC-dependent. Moreover, MCs promoted increased JEV infection in the central nervous system (CNS), enhanced neurological deficits, and reduced survival in vivo. Mechanistically, chymase, a MC-specific protease, enhances JEV-induced breakdown of the BBB and cleavage of tight-junction proteins. Chymase inhibition reversed BBB leakage, reduced brain infection and neurological deficits during JEV infection, and prolonged survival, suggesting chymase is a novel therapeutic target to prevent JEV encephalitis.


Conflict of interest statement

The authors declare no competing interests.

Figures

Fig. 1
Fig. 1
Mast cells degranulate in response to JEV. a WT mice infected with JEV displayed increased MC degranulation in the brain 5 days post-intra peritoneal (i.p.) infection with 2 × 107 plaque forming units (PFUs) of Nakayama JEV. Activated MCs were noted near brain blood vessels, as assessed by toluidine blue staining. Right images reveal details of boxed areas of the left images. Vehicle-treated brain sections contain well-granulated MCs while JEV-infected brain sections contain degranulated MCs (arrows). b MC degranulation was visualized near endothelial cells (blue; CD31) of the brain, with JEV infection (red; JEV NS3 protein) nearby, 5 days post-infection. MC granules are stained using the probe for heparin avidin-FITC (green). Vehicle-treated control brains showed well-granulated MCs. c i.p. Nakayama JEV infection caused inoculating titer-dependent mortality in WT mice (n = 10 for 2 × 107 group, n = 5 for all other groups). By 7 days, 90% mortality was induced by 2 × 107 PFU, therefore this titer was used for subsequent experiments. d JEV stimulation led to degranulation of mouse BMMCs, shown by immunofluorescence staining for MC granules (avidin-TRITC, red), tubulin (green), and DNA (blue). e Mouse BMMCs were activated in an MOI-dependent manner by JEV, as assessed by β-hexosaminidase assay. * denotes P < 0.05, ** denotes P < 0.01, determined by one-way ANOVA, compared to uninfected controls. f JEV infection increased serum chymase (MCPT1) concentrations in WT mice at 6 h, 1 day, and 3 days post-infection by i.p. injection with 4 × 107 PFU of SA 14-14-2. * denotes P < 0.05, ** denotes P < 0.01, and **** denotes P < 0.0001, analyzed by one-way ANOVA with means compared to vehicle-treated control; n = 4. g WT mice infected with live-attenuated SA 14-14-2 JEV displayed increased MC degranulation in brains, 5 days post-i.p. infection with 4 × 107 PFU. Magnified image of the MCs in the boxed area is also shown. h Human MCs showed MOI-dependent activation to JEV, assessed by β-hexosaminidase assay. ** denotes P < 0.01; *** denotes P < 0.001 and **** denotes P < 0.0001, analyzed by one-way ANOVA with means compared to uninfected control. For ac, a virulent strain, Nakayama, was used. For dh, attenuated strain SA 14-14-2 was used. Scale bar for a, g is 10 μm, b 20 μm, and d 5 μm. Data are representative of three independent experiments and error bars represent the SEM. JEV induces MC degranulation in vitro and in vivo
Fig. 2
Fig. 2
Mast cells facilitate JEV clearance from the site of infection but enhance its entry into the brain. Virus burden in a peritoneal cells, b serum, c spleen, and d mesenteric lymph nodes was quantified from 6 h to 14 days after i.p. infection with SA 14-14-2 JEV (4 × 107 PFU). Virus genome copies in the peritoneal cells, spleens, and mesenteric lymph nodes were detected by real-time qPCR and virus titers in the sera were detected by plaque assay. WT mice showed increased clearance of JEV in the peritoneal cells but no difference was observed in the serum, spleen, and mesenteric lymph nodes. * denotes P < 0.05 as analyzed by two-way ANOVA; n = 6. Data are representative of three independent experiments. e, f Serum of JEV-infected WT and Sash mice had similar levels of multiple cytokines including e IFN-γ and f TNF-α. NS denotes P > 0.05, analyzed by one-way ANOVA;  n= 5 and results are representative of three independent experiments. g Virus quantification in various parts of the brain: cerebral cortex, subcortex, cerebellum, brain stem, and spinal cord from 1 to 14 days after i.p. infection with SA 14-14-2 JEV, as assessed by real-time qPCR. JEV was detected in the brain starting 3 days post-infection and was cleared by 14 days. Virus titers are represented as JEV genome copies per milligram of tissue. * denotes P < 0.05, as analyzed by two-way ANOVA; n = 6, representative of three independent experiments. Dot-plot presentation of this data is provided in Supplementary Figure 4. Error bars represent the SEM. In spite of similar peripheral JEV titers and inflammatory cytokines, JEV titers were enhanced in multiple brain regions in WT compared to Sash mice
Fig. 3
Fig. 3
Mast cells increase JEV-induced breakdown of the BBB. a Time course of SA 14-14-2 JEV-induced BBB breakdown detected by EBD leakage into the brain from 1 day to 14 days post-infection. Differences in EBD leakage between WT and Sash mice were observed starting 5 days but also at 7 days and 10 days after infection. EBD concentration was normalized to levels detected in vehicle-treated controls. * denotes P < 0.01 as analyzed by two-way ANOVA, n = 6, representative of three independent experiments. A dot-plot representation of this data is provided in Supplementary Figure 6. b Representative images showing extent of EBD leakage into the brain from a. c Immunofluorescent images comparing ZO-1 staining (red) in brains of uninfected, JEV-infected WT, and JEV-infected Sash mice. Nucleic acid was stained green. Brains were harvested 5 days after i.p. injection of SA 14-14-2 JEV (4 × 107 PFU). Brain endothelial cells of JEV-infected WT mice showed decreased ZO-1 levels compared to uninfected controls and JEV-infected Sash mice. Scale bar denotes 10 μm. d Comparison of EBD leakage into brains of WT, Sash, Sash reconstituted with BMMCs peripherally (Sash-RP), and Sash reconstituted with BMMCs in the CNS (Sash-RC) at 5 days post-i.p. SA 14-14-2 JEV infection (4 × 107 PFU). EBD concentration was normalized to levels detected in vehicle-treated controls and baseline set as 100%. * denotes P < 0.05, as determined by one-way ANOVA with Holm-Sidak’s post-test; n = 6, representative of three independent experiments. e Representative images showing the extent of EBD leakage into the brain from d. f i.c.v Injection of DT (0.5 mg/kg) into Mcpt5-Cre; iDTRfl/fl mice depleted ~80% of MCs in the brain (refer to Supplementary Figure 8a, b). Injection of 4 × 107 PFU of SA 14-14-2 JEV, i.p., in CNS MC-depleted (DT-injected Mcpt5-Cre; iDTRfl/fl) mice resulted in decreased EBD leakage 5 days post-infection, compared to MC-sufficient control mice. EBD leakage was normalized to uninfected controls. * denotes P < 0.05, as analyzed by Student’s unpaired two-tailed t-test; n = 10, representative of two independent experiments. Error bars represent the SEM. g Representative images showing extent of EBD leakage into the brain from f. Both peripheral and CNS MCs contribute to BBB permeability, yet peripheral MCs are sufficient to induce BBB permeability during JEV infection
Fig. 4
Fig. 4
Mast cells cause increased vascular leakage and worsened morbidity and mortality during JEV infection. a JEV induced increased EBD leakage into the brain in the WT mice but not in the Sash mice at 5 days after infection with JEV Nakayama by i.p. injection of 2 × 107 PFU. * denotes P < 0.05, as analyzed by Student’s unpaired two-tailed t-test; n = 5, representative of three independent experiments. b Representative images of EBD leakage into the brain from a are presented. c WT mice showed increased virus burden in various parts of the brain, including cerebral cortex, subcortex, cerebellum, and brain stem, at 6 days post-Nakayama infection, quantified by real-time qPCR. * denotes P < 0.01, as analyzed by two-way ANOVA; n = 8, representative of three independent experiments. d Body mass and e grip strength of mice were measured daily and are presented as a percentage of their initial (day 0) values. WT mice showed increased weight loss and worsened neurologic deficits after Nakayama JEV infection compared to Sash mice. *** denotes P < 0.001, as analyzed by two-way ANOVA; n = 5, representative of three independent experiments. For d and e, lines connect points for individual mice and † denotes the last reading before death or humane endpoints were reached. The averages of n = 15 mice are included in Supplementary Figure 10. Error bars represent the SEM. f Increased mortality and shortened survival were observed in WT mice compared to Sash mice, after i.p. infection with Nakayama JEV. ** denotes P < 0.01, as analyzed by log-rank (Mantel–Cox) test, n = 15. Shadows represent the 95% confidence intervals. WT mice demonstrated worsened morbidity, neurologic deficits, and mortality compared to Sash mice after peripheral JEV infection
Fig. 5
Fig. 5
Inhibition of chymase abolishes JEV-induced breakdown of the BBB. a bEND.3 cell monolayers were treated with media alone or media containing JEV or supernatants of MCs only, JEV-stimulated MCs, or JEV-stimulated MCs treated with either TY-51469 (chymase inhibitor) or nafamostat mesylate (tryptase inhibitor). Supernatants from JEV-stimulated BMMCs reduced the TEER, which was reversed by TY-51469 (100 µM), but not nafamostat mesylate (10 µM); analyzed by two-way ANOVA. b JEV-activated BMMC supernatants increased FITC-dextran leakage across transwells 24 h post-exposure. TY-51469, but not nafamostat mesylate, reduced FITC-dextran leakage; n = 3. c Supernatants from JEV-stimulated WT BMMCs reduced TEER of b.END3 monolayers, but control media, JEV, supernatants from WT or MCPT4-KO BMMCs or JEV-stimulated MCPT4-KO BMMCs did not. d JEV-activated WT BMMC supernatants increased FITC-dextran leakage (24 h), but controls or supernatants from JEV-activated MCPT4-KO BMMCs did not; n = 3. e Claudin-5, ZO-1, ZO-2, and occludin levels in bEND.3 cells exposed to JEV-activated MC supernatants were reduced compared to media, JEV, and unstimulated MC supernatant-treated groups, by western blotting, which was inhibited by TY-51469. GAPDH blotting served as loading controls. Quantification is provided (Supplementary Figure 11). f TY-51469 reduced EBD leakage into brains of JEV-infected WT mice, to levels similar to JEV-infected Sash mice, 5 days post-i.p. infection with Nakayama (2 × 107 PFU); n = 5. g Representative images from f. h IgG (red) of brain sections of JEV-infected WT, Sash, and TY-51469-treated WT mice, 5 days post-i.p. infection with Nakayama. During JEV infection, IgG was detected in the brain parenchyma of WT mice, but not Sash or TY-51469-treated WT mice. Scale bar = 50 μm. i TY-51469 reduced the JEV titers in brains, 6 days post-i.p. Nakayama infection, compared to vehicle-treated WT mice, to levels similar to Sash mice. Chymase injection (30 ng, i.p.) of Sash mice led to increased j EBD leakage (n = 5) and k brain JEV titers, to levels similar to WT JEV-infected mice (5 days post-infection); n = 8; representative of two experiments. Error bars represent the SEM. Unless indicated, all data are representative of three independent experiments, were analyzed by one-way ANOVA with Holm-Sidak’s multiple comparison test; * denotes P < 0.05 and ** denotes P < 0.01. Chymase inhibition limits JEV penetration of the brain by preventing BBB leakage
Fig. 6
Fig. 6
Chymase inhibition is therapeutic during lethal JEV infection. a Body mass and b grip strength of mice were measured daily and are shown as a percentage of pre-infection measurements from day 0. Chymase inhibition with TY-51469 maintained body weight and reduced grip strength deficits in WT mice after Nakayama JEV infection to levels similar to Sash. *** denotes P < 0.001, as analyzed by two-way ANOVA, n = 5, representative of three independent experiments (all data from n = 15 mice are included in Supplementary Figure 10). Error bars represent the SEM. c Survival curve of WT, Sash, and WT mice treated with TY-51469 after i.p. infection with Nakayama JEV is presented. TY-51469 administration reduced mortality and prolonged survival in WT mice. * denotes P < 0.05, ** denotes P < 0.01 as analyzed by log-rank (Mantel–Cox) test; n = 15. Shadows represent the 95% confidence intervals. Chymase inhibition is therapeutic in reducing morbidity, neurological deficits, and mortality during lethal JEV infection

Similar articles

Cited by

References

    1. Campbell GL, et al. Estimated global incidence of Japanese encephalitis: a systematic review. Bull. World Health Organ. 2011;89:766–774E. doi: 10.2471/BLT.10.085233. - DOI - PMC - PubMed
    1. Mackenzie JS, Gubler DJ, Petersen LR. Emerging flaviviruses: the spread and resurgence of Japanese encephalitis, West Nile and dengue viruses. Nat. Med. 2004;10:S98–S109. doi: 10.1038/nm1144. - DOI - PubMed
    1. Solomon T, Vaughn DW. Pathogenesis and clinical features of Japanese encephalitis and West Nile virus infections. Curr. Top. Microbiol. Immunol. 2002;267:171–194. - PubMed
    1. Johnson RT, et al. Japanese encephalitis: immunocytochemical studies of viral antigen and inflammatory cells in fatal cases. Ann. Neurol. 1985;18:567–573. doi: 10.1002/ana.410180510. - DOI - PubMed
    1. Ghoshal A, et al. Proinflammatory mediators released by activated microglia induces neuronal death in Japanese encephalitis. Glia. 2007;55:483–496. doi: 10.1002/glia.20474. - DOI - PubMed

Publication types

MeSH terms