. 2019 Feb 11;10(1):702.
doi: 10.1038/s41467-019-08567-6.

Reversible fold-switching controls the functional cycle of the antitermination factor RfaH

Affiliations

Reversible fold-switching controls the functional cycle of the antitermination factor RfaH

Philipp Konrad Zuber et al. Nat Commun. .

Abstract

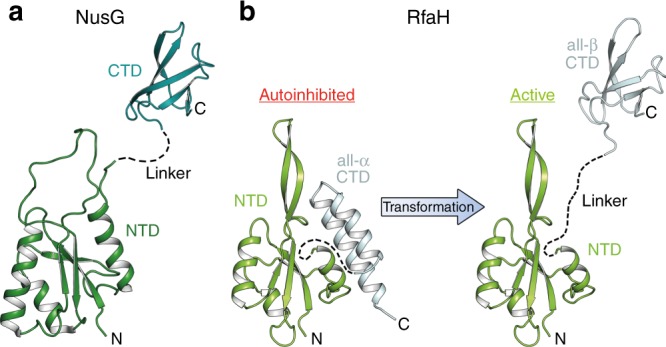
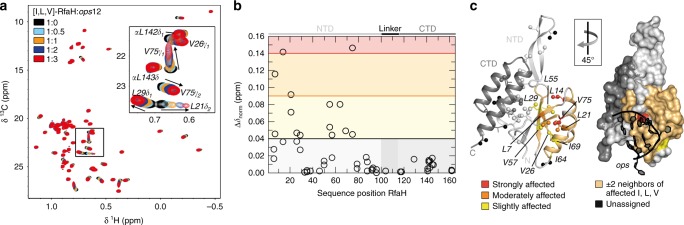
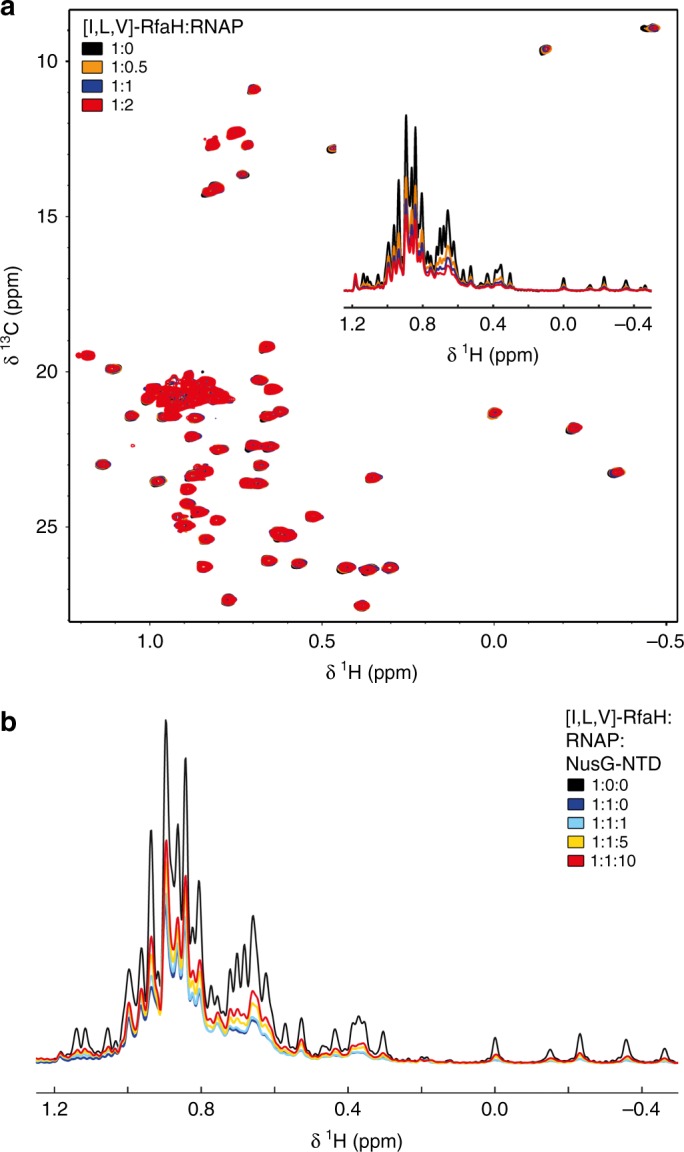
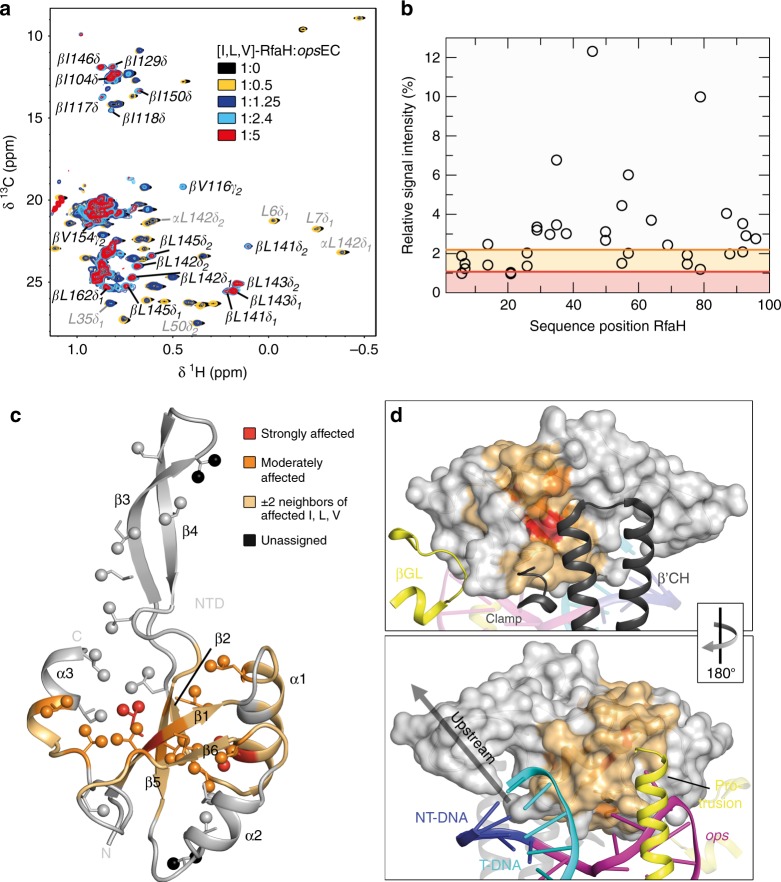
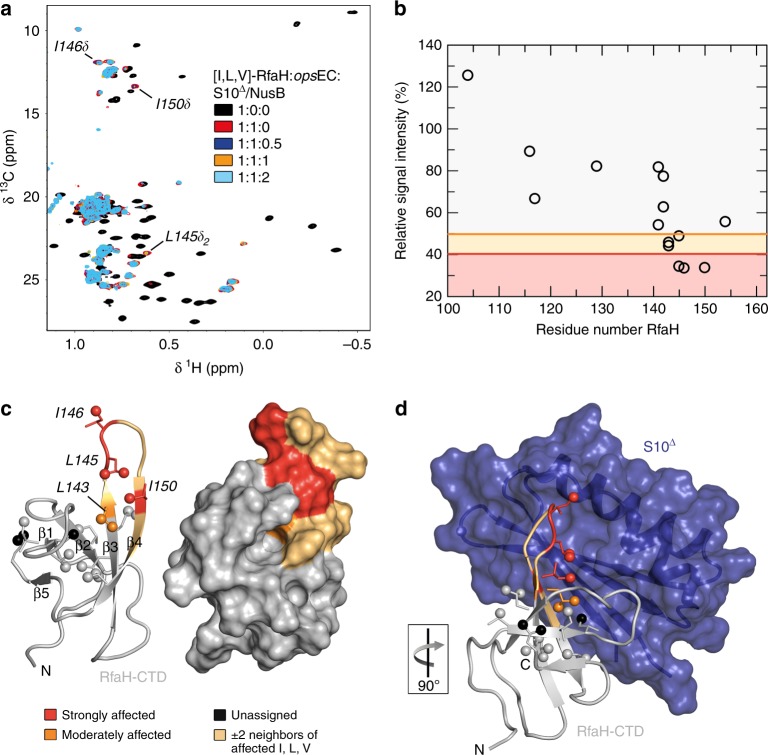
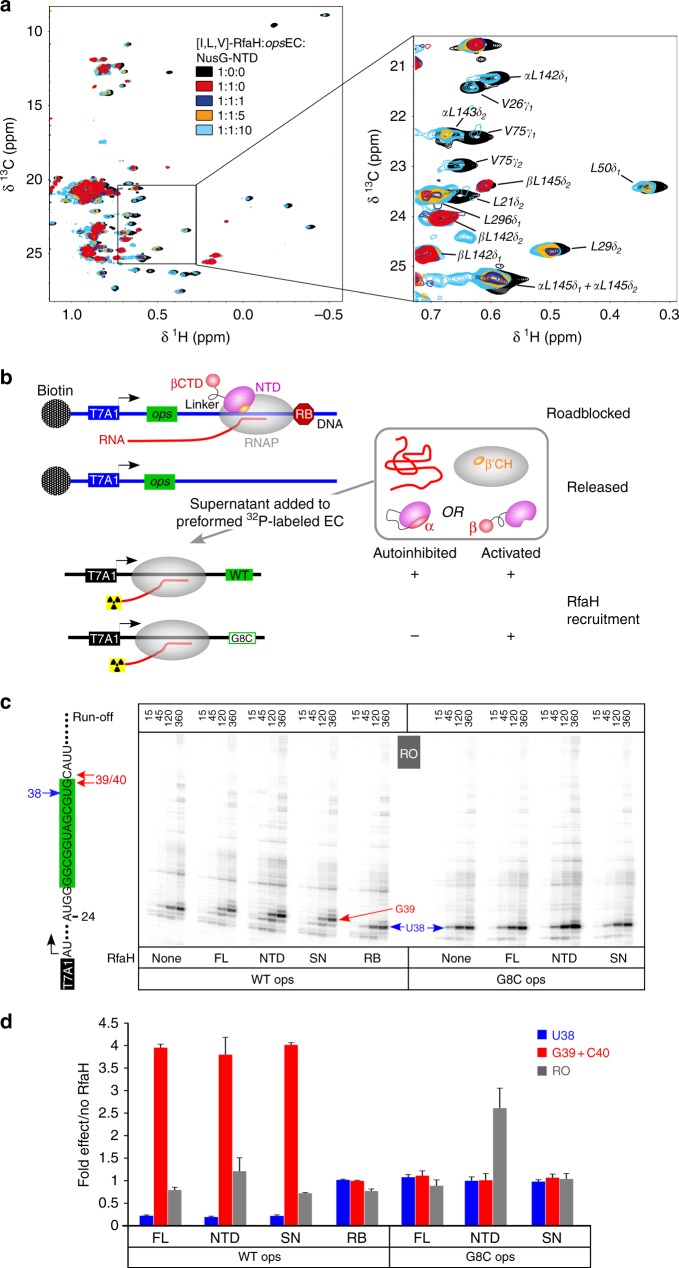
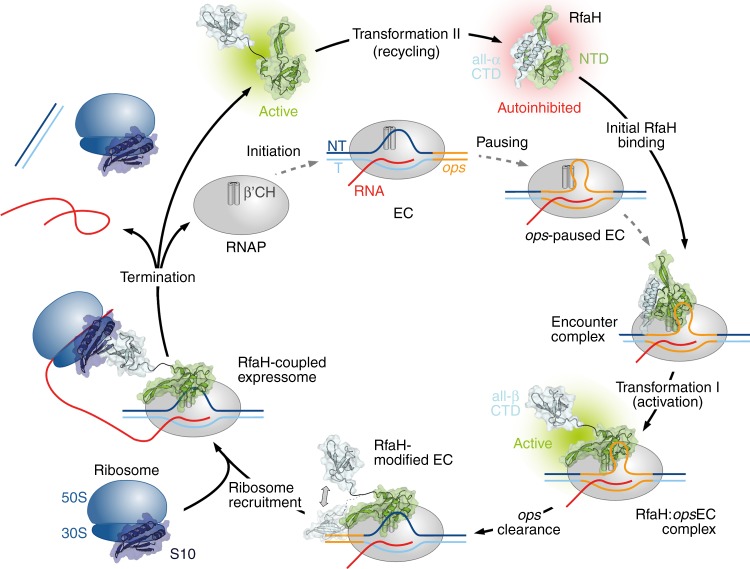
RfaH, member of the NusG/Spt5 family, activates virulence genes in Gram-negative pathogens. RfaH exists in two states, with its C-terminal domain (CTD) folded either as α-helical hairpin or β-barrel. In free RfaH, the α-helical CTD interacts with, and masks the RNA polymerase binding site on, the N-terminal domain, autoinhibiting RfaH and restricting its recruitment to opsDNA sequences. Upon activation, the domains separate and the CTD refolds into the β-barrel, which recruits a ribosome, activating translation. Using NMR spectroscopy, we show that only a complete ops-paused transcription elongation complex activates RfaH, probably via a transient encounter complex, allowing the refolded CTD to bind ribosomal protein S10. We also demonstrate that upon release from the elongation complex, the CTD transforms back into the autoinhibitory α-state, resetting the cycle. Transformation-coupled autoinhibition allows RfaH to achieve high specificity and potent activation of gene expression.


Conflict of interest statement

The authors declare no competing interests.

Figures

Fig. 1
Fig. 1
Structures of NusG and RfaH from E. coli. Structures of a NusG and b RfaH are in ribbon representation, the linker connecting the domains is indicated by a dashed line. PDB IDs: NusG-NTD, ‘2K06’; NusG-CTD, ‘2JVV’; RfaH, ‘5OND’; RfaH-CTD, ‘2LCL
Fig. 2
Fig. 2
RfaH:ops interaction. a 2D [1H, 13C] methyl-TROSY spectra of 45 µM [I,L,V]-RfaH titrated with ops (concentration of stock solution: 1.3 mM). Inset: enlargement of boxed region. b Interaction of [I,L,V]-RfaH with ops. Methyl-TROSY-derived normalized chemical shift changes vs. sequence position of RfaH (corresponding spectra are depicted in a). Horizontal lines: significance levels of Δδnorm = 0.04 ppm, black; = 0.09 ppm, orange, = 0.14 ppm, red. Source data are provided as a Source Data file. c ops binding surface of RfaH as derived from the titration of [I,L,V]-RfaH with ops. Affected methyl groups are mapped onto the RfaH:ops9 structure (PDB ID: ’5OND’). RfaH is shown in ribbon (left) and surface (right) representation (RfaH-NTD, light gray; RfaH-CTD, dark gray), ops9 in ribbon representation (black) with nucleosides as sticks. The arrow indicates how the structures are rotated with respect to each other. Termini are labeled. For graphical representation of the interaction site the whole amino acid is colored. Ile, Leu, and Val residues are shown as sticks with the carbon atoms of the methyl groups as spheres. Slightly affected (0.04 ≤ Δδnorm < 0.09 ppm), yellow; moderately affected (0.09 ≤ Δδnorm < 0.14 ppm), orange; strongly affected (Δδnorm ≥ 0.14 ppm), red; unaffected, colored according to their domain; not assigned methyl groups, black. Two amino acids on either side of an affected Ile/Leu/Val residue are highlighted in beige unless they were unaffected Ile/Leu/Val residues
Fig. 3
Fig. 3
Binding of RfaH to RNAP. a 2D [1H, 13C] methyl-TROSY spectra of 15 µM [I,L,V]-RfaH titrated with RNAP (concentration of stock solution: 78 µM). Inset: normalized 1D [1H, 13C]-methyl-TROSY spectra, colored as 2D spectra. See also Supplementary Figure 2. b Displacement of RfaH from RNAP by NusG-NTD. Normalized 1D methyl-TROSY spectra of [I,L,V]-RfaH (30 μM, black), [I,L,V]-RfaH in the presence of equimolar RNAP (30 μM each, red), and [I,L,V]-RfaH upon titration of the [I,L,V]-RfaH:RNAP complex (30 μM each) with 712 µM NusG-NTD; molar ratio of [I,L,V]-RfaH:RNAP:NusG-NTD is indicated in color
Fig. 4
Fig. 4
RfaH recruitment to the opsEC. a 2D [1H, 13C] methyl-TROSY spectra of [I,L,V]-RfaH in the absence or presence of opsEC assembled with 2H-RNAP (concentration of [I,L,V]-RfaH: 233 µM (1:0), 54 µM (1:0.5), 27 µM (1:1.25), 15 µM (1:2.4), 8 µM (1:5)). α and β indicate the all-α or all-β state of the RfaH-CTD. b Relative signal intensity of [I,L,V]-RfaH-NTD methyl groups with 0.5 equivalents of opsEC. Orange and red lines indicate thresholds for moderately (60% of average relative intensity) and strongly (30% of average relative intensity) affected methyl groups, respectively. Source data are provided as a Source Data file. c Mapping of affected methyl groups onto RfaH-NTD structure (ribbon representation; light gray; PDB ID: ‘5OND’). Ile, Leu, and Val residues are in stick representation with the carbon atom of the methyl groups as sphere. Termini and secondary structure elements are labeled. The representation was graphically extended by including the two flanking residues on each side of an affected residue (beige) as established. d RfaH-NTD bound to the opsEC (PDB ID: ‘6C6S’). RfaH-NTD is in surface representation, color code as in c, DNA and selected elements of the RNAP are in ribbon representation and labeled. The arrow indicates how the structures are rotated with respect to each other
Fig. 5
Fig. 5
Structural basis of translation activation by RfaH. a 2D [1H, 13C] methyl-TROSY spectra of [I,L,V]-RfaH alone (200 µM), in the presence of equimolar concentration of opsEC (23 µM), and upon titration of RfaH:opsEC with 234 µM S10Δ:NusB; molar ratio [I,L,V]-RfaH:opsEC:S10Δ:NusB is indicated in color. Resonances with significant intensity changes are labeled. b Methyl-TROSY-derived relative intensity of [I,L,V]-RfaH methyl groups after addition of one equivalent of opsEC and two equivalents of S10Δ:NusB vs. sequence position in RfaH. Orange and red lines indicate thresholds for moderately affected (80% of the average relative intensity) and strongly affected (65% of the average relative intensity) methyl groups, respectively. Source data are provided as a Source Data file. c Mapping of affected methyl groups onto RfaH-CTD structure (PDB ID: ‘2LCL’). RfaH (gray) is shown in ribbon (left) and surface (right) representation, methyl groups are shown as spheres and are color-coded. d Model of the RfaH-CTD:S10Δ complex based on the NusG-CTD:S10Δ complex (PDB ID: ‘3D3B’). S10Δ in ribbon and surface representation (blue), representation of RfaH-CTD as in c. The orientation of RfaH-CTD relative to c is indicated
Fig. 6
Fig. 6
Recycling of RfaH. a 2D [1H, 13C] methyl-TROSY spectra of [I,L,V]-RfaH alone (200 µM), in the presence of equimolar concentration of opsEC (23 µM), and upon titration of RfaH:opsEC with NusG-NTD (concentration of stock solutions 240 µM and 486 µM); molar ratio [I,L,V]-RfaH:opsEC:NusG-NTD is indicated in color. α and β indicate the all-α or all-β state of the RfaH-CTD. b Experimental set-up to follow RfaH state using in vitro transcription assay. c Determination of RfaH effect on single-round RNA synthesis. The relevant RNA region is shown on the left, with the ops element highlighted in green. Prominent pause sites (U38, G39, and C40) are indicated. Halted α32P-labeled A24 ECs were chased in the presence of RfaH-NTD, RfaHFL, or supernatants from roadblocked (RB) or free (SN) first-round reactions on the WT or G35C (corresponds to G8C in the ops element) template. Reactions were quenched at the indicated times (in seconds) and analyzed on 10% denaturing acrylamide gels; a representative gel is shown. d The fractions of RNA species indicated were determined from 360-s time points. The ratios of RNA in the presence and in the absence of the RfaH variant indicated were determined from three independent biological replicates and are shown as mean ± standard deviation. Source data are provided as a Source Data file
Fig. 7
Fig. 7
Functional cycle of RfaH. Structural transformations of the interdomain interface and the RfaH-CTD underlie reversible switching between the autoinhibited and active states of RfaH

Similar articles

Cited by

References

    1. Werner F. A nexus for gene expression-molecular mechanisms of Spt5 and NusG in the three domains of life. J. Mol. Biol. 2012;417:13–27. doi: 10.1016/j.jmb.2012.01.031. - DOI - PMC - PubMed
    1. Guo S, et al. A regulator of transcriptional elongation controls vertebrate neuronal development. Nature. 2000;408:366–369. doi: 10.1038/35042590. - DOI - PubMed
    1. Hirtreiter A, et al. Spt4/5 stimulates transcription elongation through the RNA polymerase clamp coiled-coil motif. Nucleic Acids Res. 2010;38:4040–4051. doi: 10.1093/nar/gkq135. - DOI - PMC - PubMed
    1. Bar-Nahum G, et al. A ratchet mechanism of transcription elongation and its control. Cell. 2005;120:183–193. doi: 10.1016/j.cell.2004.11.045. - DOI - PubMed
    1. Burmann BM, et al. A NusE:NusG complex links transcription and translation. Science. 2010;328:501–504. doi: 10.1126/science.1184953. - DOI - PubMed

Publication types

MeSH terms

LinkOut - more resources