. 2019 Mar;16(3):255-262.
doi: 10.1038/s41592-019-0325-y. Epub 2019 Feb 11.

Flow-enhanced vascularization and maturation of kidney organoids in vitro

Affiliations

Flow-enhanced vascularization and maturation of kidney organoids in vitro

Kimberly A Homan et al. Nat Methods. 2019 Mar.

Abstract

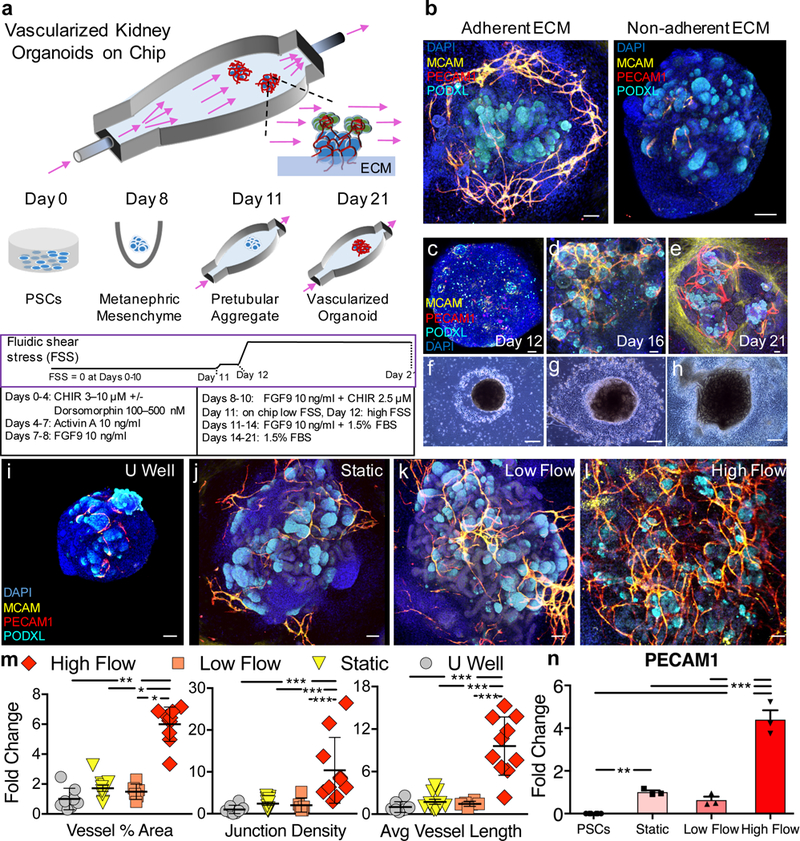
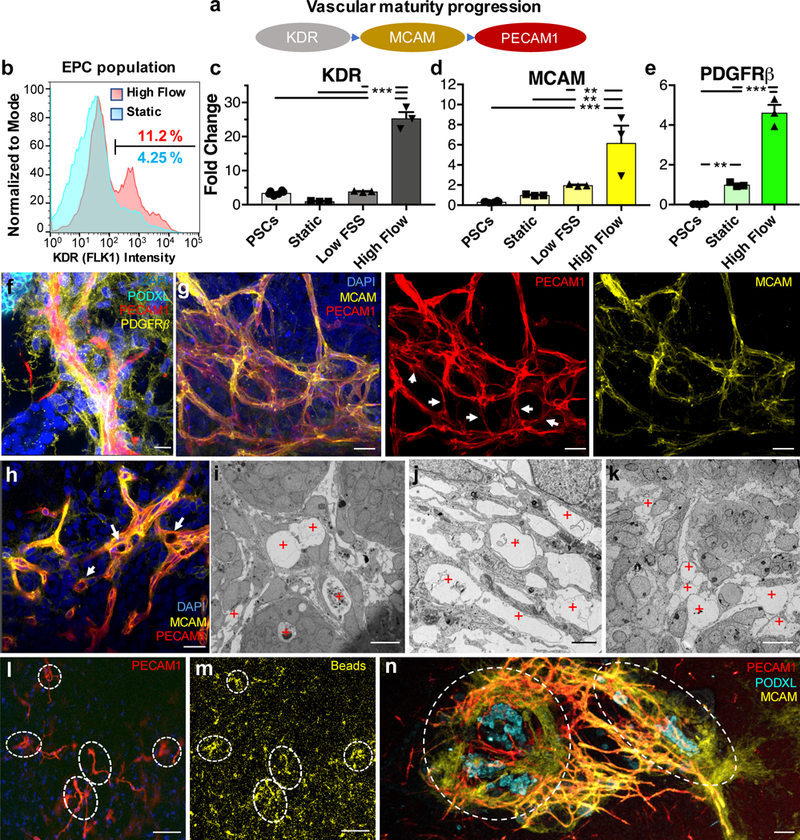
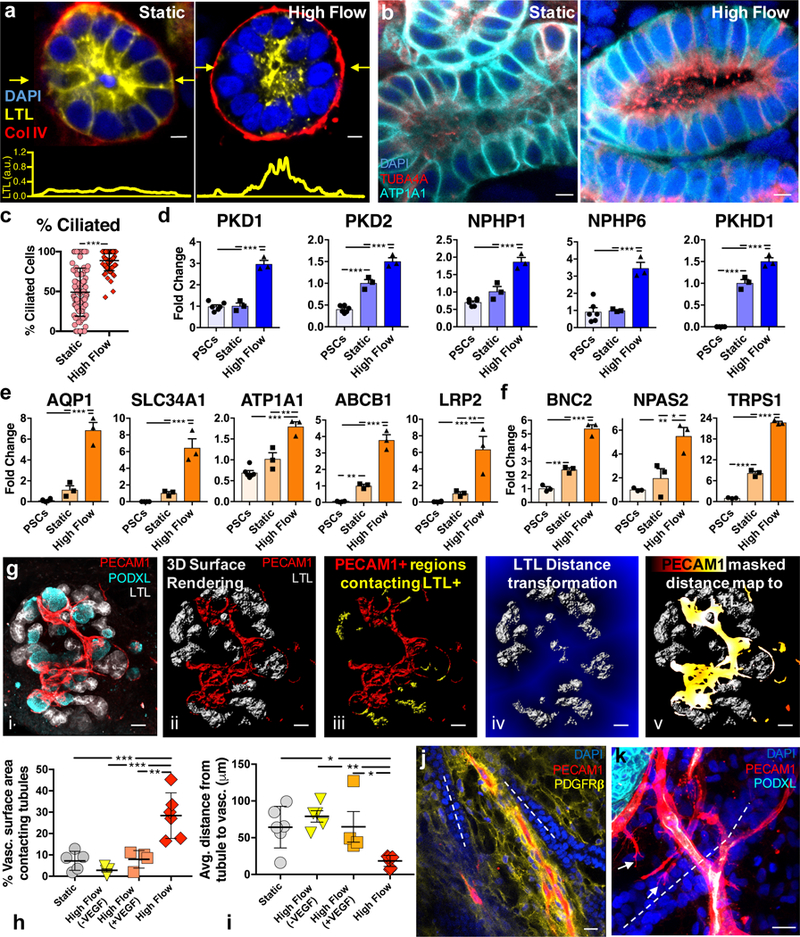
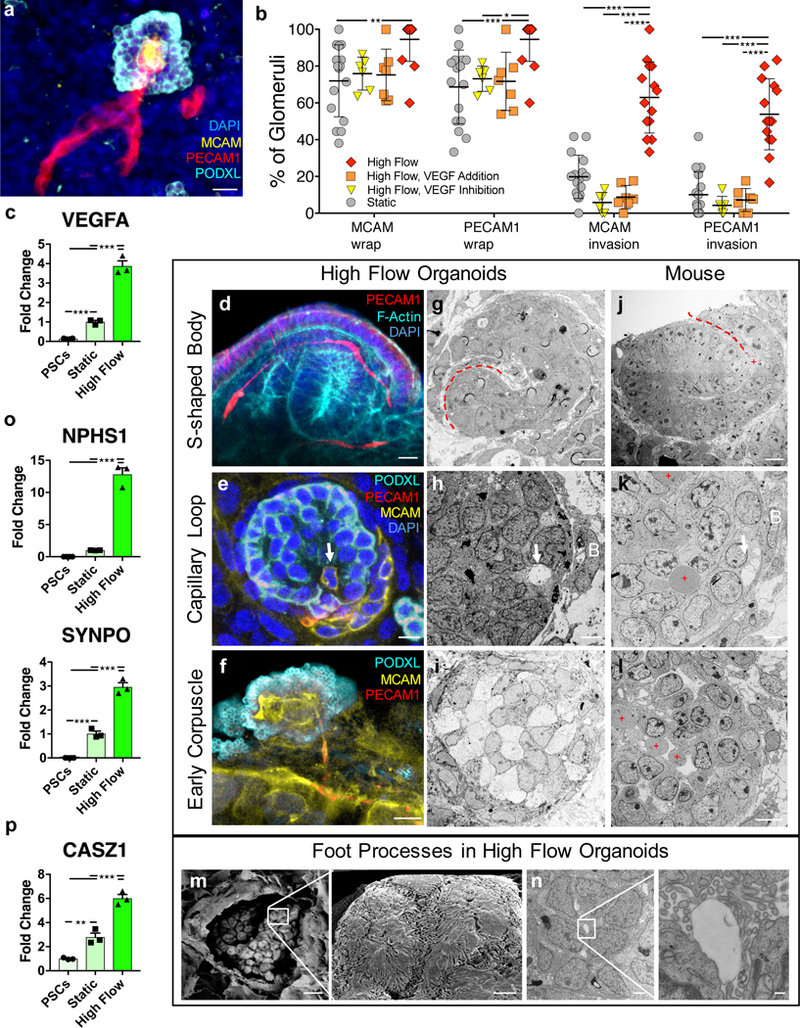
Kidney organoids derived from human pluripotent stem cells have glomerular- and tubular-like compartments that are largely avascular and immature in static culture. Here we report an in vitro method for culturing kidney organoids under flow on millifluidic chips, which expands their endogenous pool of endothelial progenitor cells and generates vascular networks with perfusable lumens surrounded by mural cells. We found that vascularized kidney organoids cultured under flow had more mature podocyte and tubular compartments with enhanced cellular polarity and adult gene expression compared with that in static controls. Glomerular vascular development progressed through intermediate stages akin to those involved in the embryonic mammalian kidney's formation of capillary loops abutting foot processes. The association of vessels with these compartments was reduced after disruption of the endogenous VEGF gradient. The ability to induce substantial vascularization and morphological maturation of kidney organoids in vitro under flow opens new avenues for studies of kidney development, disease, and regeneration.


Conflict of interest statement

Conflict of Interest

J.V.B. and R.M. are co-inventors on patents (PCT/US16/52350) on organoid technologies that are assigned to Partners Healthcare. J.V.B. or his family has received income for consulting from companies interested in biomarkers: Sekisui, Millennium, Johnson & Johnson and Novartis. J.V.B. is a co-founder, consultant to, and owns equity in Goldfinch Bio. K.A.H. is a co-founder and chairwoman for NanoHybrids Inc. J.A.L. is a co-founder and owns equity in Voxel8 Inc.

Figures

Figure 1.
Figure 1.. Developing kidney organoids cultured in vitro under high fluid flow exhibit enhanced vascularization during nephrogenesis.
(a) Developing renal organoids are placed on an engineered extracellular matrix (ECM), housed within a perfusable millifluidic chip, and subjected to controlled fluidic shear stress (FSS), note organoids not drawn to scale. (b) Enhanced peripheral vascular network formation in adherent compared to non-adherent underlying ECMs, scale bars = 100 μm. (c-e) Immunostaining of whole mount organoids and (f-g) representative phase contrast images of entire organoids cultured under high FSS (days 12–21), scale bars = 50 μm and 300 μm, respectively, where perfusion direction is left to right. (i-l) Confocal 3D renderings for vascular markers in whole-mount organoids cultured under static U-well, static on engineered ECM, low FSS, and high FSS, scale bars = 100 μm. (m) Angiotool output, which quantifies the abundance and character of vasculature, reported as a fold change relative to the U-well condition. For (m), biological replicates of 8, 11, 6, and 10 were used per condition (U well, Static, Low Flow, and High Flow, respectively) in experiments using both iPSC- and hESC-derived organoids where the entire organoid represents one replicate (one dot) and mean +/− std is plotted. (n) qPCR depicting increased PECAM1 expression under high FSS. The graph is plotted with mean +/− std. Dots on the bar chart represent three technical replicates on RNA pooled from 6 organoids (biological replicates) per condition. DAPI: 4’,6-diamidino-2-phenylindole, PECAM1: CD31, MCAM: CD146, KDR: FLK1, PODXL: podocalyxin, CDH1: E-cadherin, CHIR: CHIR99021, FGF9: fibroblast growth factor 9, FBS: fetal bovine serum. Statistical analysis for (m) and (n) is performed using GraphPad Prism 7 and statistical significance is determined at a value of p < 0.05 as determined by a 1way and 2way ANOVA, respectively, using Tukey’s multiple comparisons test. Different significance levels (p values) are indicated with asterisks as such: *p<0.05, **p<0.01, ***p<0.001.
Figure 2.
Figure 2.. Intra and inter-organoid vascular networks with perfusable lumens supported by mural cells are observed for kidney organoids cultured under high flow in vitro.
(a) Diagram of endothelial maturation in developing kidneys in vivo, from progenitor cells to sustained terminal marker expression. (b) Flow cytometry of dissociated whole organoids depicting ~3-fold expansion of the endothelial progenitor cell (EPC) population in response to high FSS, compared to static conditions on chip. (c,d) qPCR of endothelial cell markers in developing organoids showing their upregulation following high FSS (day 21). (e) A key stromal marker is upregulated under high FSS, possibly due to mural cells associating with enhanced vasculature as shown in (f), scale bar = 15 μm. (g) Confocal 3D renderings of vascular markers within whole-mount organoids reveal that some features are best visualized in co-stained samples (left), as opposed to only mature (middle) and intermediate (right) markers, scale bars = 30 μm. White arrows highlight areas that are PECAM1+MCAM-, showing the two markers are not always co-expressed. (h) A single z-slice from (g) in which white arrows highlight open lumens, scale bar = 30 μm. (i-k) TEM images showing circular openings encompassed by a thin membrane that reflect vascular lumens for (i,j) kidney organoids subjected to high FSS and (k) E14.5 mouse embryonic kidney in vivo [Note: Hierarchial luminal diameters vary from 2 to near 20 μm (red plus signs reflect vascular lumens), scale bars = 10 μm for (i,k) and 2 μm for (j)]. (l,m) Z-slice at the base of a kidney organoid cultured under high FSS, showing in (l) the vascular network and in (m) the accumulation of fluorescent beads within the vascular network, scale bars = 100 μm. (n) Confocal 3D rendering of bridging between two adjacent, whole organoids (outlined by dashed white lines, scale bar = 100 μm. DAPI: 4’,6-diamidino-2-phenylindole, PECAM1: CD31, MCAM: CD146, KDR: FLK1, PODXL: podocalyxin, PDGFRβ: platelet derived growth factor receptor beta. Dots on the bar charts (c-e) represent three technical replicates on RNA pooled from 6 organoids (biological replicates) per condition. All graphs are plotted with mean +/− std. Statistical analysis for (c-e) is performed using GraphPad Prism 7 and statistical significance is determined at a value of p < 0.05 as determined by a 1way ANOVA, using Tukey’s multiple comparisons test. Different significance levels (p values) are indicated with asterisks as such: *p<0.05, **p<0.01, ***p<0.001.
Figure 3.
Figure 3.. Tubular epithelia mature and undergo morphogenesis to become a polarized, ciliated compartment in contact with vasculature in response to the high flow condition on chip.
(a) Tubule cross-sections under static and high flow conditions showing proper basal expression of collagen IV in both cases, and proper apical expression of LTL under high flow at day 21, scale bars = 5 μm, the plots in yellow below show the intensity of LTL across a line scan denoted by yellow arrows in the images above. (b) Tubule cross-sections showing apical presence of cilia with higher prevalence (c) under high flow versus static conditions on chip and proper basolateral expression of ATP1A1 (Na/K ATPase) on day 21, scale bars = 5 μm. For (c), the static sample number is 101, and high flow is 64; samples are determined as a field of view in a LTL+ tubule where at least 8 cells could be viewed in cross section with cilia. (d-f) qPCR of ciliary markers, solute transporters, drug transporters, and adult transcription factors showing upregulation under high flow on day 21, compared to static conditions on chip and undifferentiated hPSCs. Whole organoid 3D confocal imaging stacks (gi, all scale bars = 50 μm) of a representative high flow sample are used to demonstrate the analysis method for the association of tubules with vasculature in Imaris 3D surface rendering (gii and giii) and distance transformation software (giv and gv) to find in (h) that the percent of vasculature surface area overlapping with LTL+ tubules within one voxel is significantly increased under high flow than in static conditions. Further, that tight vasculotubular association can be negated by dosing high amounts of VEGF or inhibiting VEGF in the media (h). Similarly, the average distance in 3D between the vasculature and the tubules decreases in the high flow condition (i) which does not significantly differ between static, high flow + VEGF, and high flow - VEGF (VEGF inhibition) conditions. Note the data in (h,i) represents biological replicates, or whole organoids, of 6, 5, 4, and 6 per condition (Static, High Flow (-VEGF), High Flow (+VEGF), and High Flow, respectively). (j,k) Immunostaining showing that PECAM1+ networks associate with tubular structures in both traverse and longitudinal planes in high flow at day 21, scale bars = 20 μm. DAPI: 4’,6-diamidino-2-phenylindole, LTL: lotus tetragonolobus lectin, PECAM1: CD31, PODXL: podocalyxin, TUBA4A: tubulin alpha 4a (also known as acetylated tubulin), AQP1: aquaporin 1, SLC34A1: Na/Phos cotransporter, ATP1A1: Na/K ATPase, ABCB1: MDR1, LRP2: Megalin, BNC2: basonuclin 2, NPAS2: neuronal PAS domain protein 2, TRPS1: transcription repressor GATA binding 1, PKD1: polycystin 1, PKD2: polycystin 2, NPHP1: nephrocystin 1, NPHP6: nephrocystin 6, PKHD1: fibrocystin. All statistical analysis is performed using GraphPad Prism 7 software. All graphs are plotted with mean +/− std. For (c) statistical significance is determined at a value of p < 0.05 as determined by an unpaired t test with Welch’s correction. Dots on the bar charts (d-f) represent three technical replicates on RNA pooled from 6 organoids (biological replicates) per condition. Statistical analysis for (d-f, h,i) is determined at a value of p < 0.05 as determined by a 1way ANOVA, using Tukey’s multiple comparisons test. Different significance levels (p values) are indicated with asterisks as such: *p<0.05, **p<0.01, ***p<0.001.
Figure 4.
Figure 4.. Flow-enhanced glomerular vascularization and morphogenesis of kidney organoids in vitro mirrors stages of glomerular development in vivo.
(a) A 3D rendered confocal image of vascular invasion in a PODXL+ cluster showing afferent and efferent vessels, scale bar = 40 μm. (b) Percent of PODXL+ clusters that exhibit vascular wrapping or invasion under static and high FSS ± VEGF (addition or inhibition) representing whole organoids of sample size 16, 6, 7, 14 for the conditions Static, High Flow VEGF Addition, High Flow VEGF Inhibition, and High Flow, respectively. (c) qPCR of VEGF showing significant upregulation in organoids cultured under high FSS in vitro (day 21). (d) A 3D rendered confocal image of capillary invasion in an S-shaped body in a vascularized organoid under high FSS in vitro (day 21), scale bar = 10 μm. (e) Single confocal z-slice showing capillary invasion with PECAM1+MCAM+ cell (white arrow) and MCAM+ vascular precursors (CD146+ cells), scale bar = 10 μm. (f) MCAM+PECAM1+ glomerular tuft-like formation shown as a single z-slice from confocal, scale bar = 10 μm. (g-i) TEM images of structures correlating with the IF images in kidney organoids (day 21), scale bars for (g,h) = 4 μm and (i) = 10 μm. Corresponding stages (j-l) in E14.5 mouse kidneys, where red dashed lines depict clefts, white arrows denote capillary invasion, B = Bowman’s capsule-like structure, and red plus signs denote RBCs, scale bars for (j,k) = 8 μm and (l) = 50 μm. (m) TEM images of a glomerular-like structure in organoids cultured under high FSS (day 21) showing a parietal membrane enclosing a visceral cluster of cells (left), which manifest interdigitating cytoplasmic projections extending across and into the plane of field on higher magnification (right), scale bars = 10 μm (left) and 1 μm (right). (n) TEM images of a glomerulus-like compartment in organoids cultured under high FSS (day 21) (left) in which higher magnification shows podocyte foot process abutting a glomerular tuft-like formation (right), scale bars = 2 μm (left) and 200 nm (left). (o,p) qPCR depicting significantly upregulated transcripts for podocyte foot process proteins (o) and an adult transcription factor (p). SSB: S-shaped body, CLS: capillary loop stage, DAPI: 4’,6-diamidino-2-phenylindole, MCAM: CD146, PECAM1: CD31, PODXL: podocalyxin, SYNPO: synaptopodin, NPHS1: nephrin, PDGFRβ: platelet derived growth factor receptor beta, VEGFA: vascular endothelial growth factor A, CASZ1: castor zinc finger 1. All statistical analysis is performed using GraphPad Prism 7 software. All graphs are plotted with mean +/− std. For (b) statistical significance is determined at a value of p < 0.05 as determined by a 2way ANOVA, using Tukey’s multiple comparisons test. Dots on the PCR plots in (c,o,p) represent three technical replicates on RNA pooled from 6 organoids (biological replicates) per condition. Statistical analysis for (c.o.p) is determined at a value of p < 0.05 as determined by a 1way ANOVA, using Tukey’s multiple comparisons test. Different significance levels (p values) are indicated with asterisks as such: *p<0.05, **p<0.01, ***p<0.001.

Comment in

References

    1. Morizane R & Bonventre JV Generation of nephron progenitor cells and kidney organoids from human pluripotent stem cells. Nat Protoc 12, 195–207, doi: 10.1038/nprot.2016.170 (2017). - DOI - PMC - PubMed
    1. Morizane R et al. Nephron organoids derived from human pluripotent stem cells model kidney development and injury. Nat. Biotechnol. 33, 1193–1200, doi: 10.1038/nbt.3392 (2015). - DOI - PMC - PubMed
    1. Takasato M et al. Kidney organoids from human iPS cells contain multiple lineages and model human nephrogenesis. Nature 526, 564–568, doi: 10.1038/nature15695 (2015). - DOI - PubMed
    1. Lam AQ et al. Rapid and efficient differentiation of human pluripotent stem cells into intermediate mesoderm that forms tubules expressing kidney proximal tubular markers. J. Am. Soc. Nephrol. 25, 1211–1225, doi: 10.1681/ASN.2013080831 (2014). - DOI - PMC - PubMed
    1. Freedman BS et al. Modelling kidney disease with CRISPR-mutant kidney organoids derived from human pluripotent epiblast spheroids. Nat Commun 6, 8715, doi: 10.1038/ncomms9715 (2015). - DOI - PMC - PubMed

Methods-only references:

    1. Ainslie KM, Garanich JS, Dull RO & Tarbell JM Vascular smooth muscle cell glycocalyx influences shear stress-mediated contractile response. J Appl Physiol (1985) 98, 242–249, doi: 10.1152/japplphysiol.01006.2003 (2005). - DOI - PubMed

Publication types