

doi: 10.1038/s41592-018-0308-4.
Epub 2019 Feb 11.
Fast interpolation-based t-SNE for improved visualization of single-cell RNA-seq data
Affiliations
- PMID: 30742040
- PMCID: PMC6402590
- DOI: 10.1038/s41592-018-0308-4
Item in Clipboard
Fast interpolation-based t-SNE for improved visualization of single-cell RNA-seq data
Nat Methods.
2019 Mar.
Abstract
t-distributed stochastic neighbor embedding (t-SNE) is widely used for visualizing single-cell RNA-sequencing (scRNA-seq) data, but it scales poorly to large datasets. We dramatically accelerate t-SNE, obviating the need for data downsampling, and hence allowing visualization of rare cell populations. Furthermore, we implement a heatmap-style visualization for scRNA-seq based on one-dimensional t-SNE for simultaneously visualizing the expression patterns of thousands of genes. Software is available at https://github.com/KlugerLab/FIt-SNE and https://github.com/KlugerLab/t-SNE-Heatmaps .
Figures
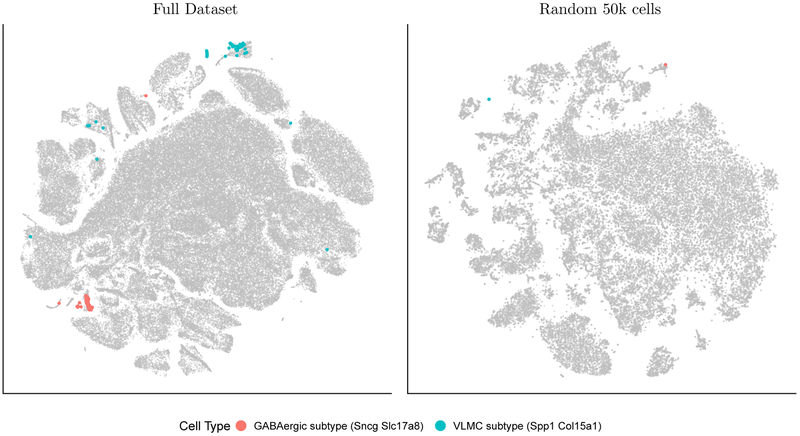
FIt-SNE allows for embedding of the full 1.3 million mouse brain cell dataset (left), enabling the identification of known cell populations that cannot be identified when downsampling to a random 50,000 cells (right). (For the left figure, instead of plotting all 1.3 million embedded points, only 100,000 of the cells not expressing the marker genes are shown, whereas all the cells expressing the marker genes are shown.)
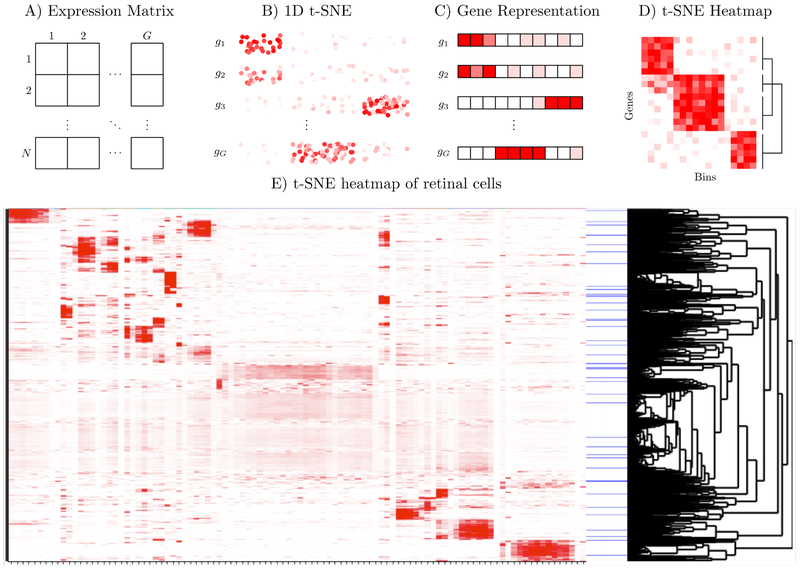
Schematic and demo of t-SNE Heatmaps. Starting with the expression matrix (A) compute 1D t-SNE, which is plotted in (B) colored by the expression of each gene (with added jitter). We bin the 1D t-SNE, and represent each gene by its average expression in each bin (C), and then generate a heatmap of these vectors, so that genes with similar expression patterns in the t-SNE are grouped together (D). In (E), we demonstrate t-SNE heatmaps using retinal bipolar cells
References
-
- Svensson Valentine, Vento-Tormo Roser, and Teichmann Sarah A. Exponential scaling of single-cell rna-seq in the past decade. Nature protocols, 13(4):599, 2018. - PubMed
-
- 10X Genomics. Transciptional profiling of 1.3 million brain cells with the chromium single cell 3’ solution. Application Note, 2016.
-
- van der Maaten Laurens. Accelerating t-SNE using tree-based algorithms. Journal of machine learning research, 15(1):3221–3245, 2014.
-
- Yianilos Peter N. Data structures and algorithms for nearest neighbor search in general metric spaces. In SODA, volume 93, pages 311–321, 1993.
Publication types
MeSH terms
Substances
Grants and funding
LinkOut - more resources
Full Text Sources
Other Literature Sources
