. 2019 Apr;51(4):606-610.
doi: 10.1038/s41588-019-0351-9. Epub 2019 Feb 11.

Retinal transcriptome and eQTL analyses identify genes associated with age-related macular degeneration

Affiliations

Retinal transcriptome and eQTL analyses identify genes associated with age-related macular degeneration

Rinki Ratnapriya et al. Nat Genet. 2019 Apr.

Erratum in

Abstract

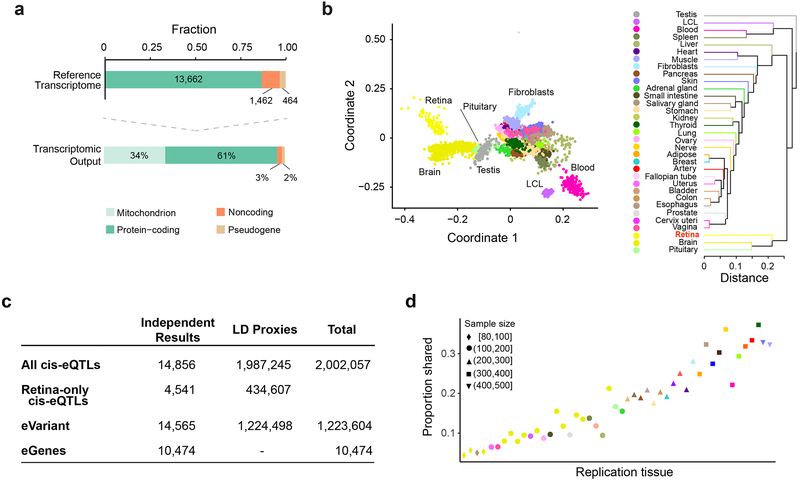
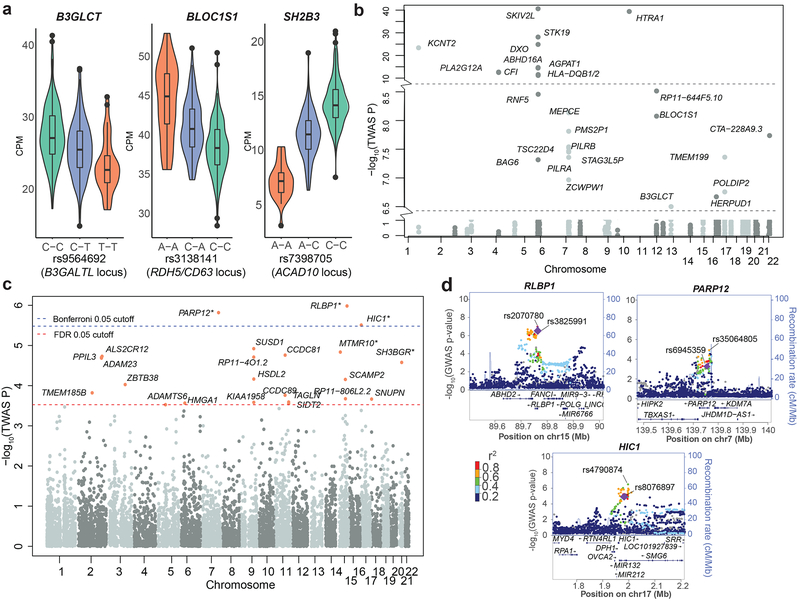
Genome-wide association studies (GWAS) have identified genetic variants at 34 loci contributing to age-related macular degeneration (AMD)1-3. We generated transcriptional profiles of postmortem retinas from 453 controls and cases at distinct stages of AMD and integrated retinal transcriptomes, covering 13,662 protein-coding and 1,462 noncoding genes, with genotypes at more than 9 million common SNPs for expression quantitative trait loci (eQTL) analysis of a tissue not included in Genotype-Tissue Expression (GTEx) and other large datasets4,5. Cis-eQTL analysis identified 10,474 genes under genetic regulation, including 4,541 eQTLs detected only in the retina. Integrated analysis of AMD-GWAS with eQTLs ascertained likely target genes at six reported loci. Using transcriptome-wide association analysis (TWAS), we identified three additional genes, RLBP1, HIC1 and PARP12, after Bonferroni correction. Our studies expand the genetic landscape of AMD and establish the Eye Genotype Expression (EyeGEx) database as a resource for post-GWAS interpretation of multifactorial ocular traits.


Figures

Figure 1.
Figure 1.
EyeGEx: retinal transcriptome and eQTL analyses. (a) Reference transcriptome output from 105 MGS1 control donor retinas. Top: Fraction of expressed genes in Ensembl gene biotypes. Below: Percentage of gene expression in distinct gene subtypes. (b) Within-tissue sample similarity and transcriptome comparison across the retina (n = 105 MGS1 retinas) and the GTEx tissues (v7) (n = 6,421 samples across all body sites) based on normalized gene expression levels. Each color represents a distinct tissue. Left: multidimensional scaling. Right: tissue hierarchical clustering. (c) A summary of retinal cis-eQTLs, eGenes and eVariants. 1.8% of the top eVariants (14,565) regulate more than one eGene. Variants in LD with the most significant eVariant are indicated as LD proxies. LD, linkage disequilibrium. (d) The proportion of cis-eQTLs in the retina (y-axis) that are detected in GTEx (x-axis), ordered by the sample size of each tissue. Color and shape of each point represent the tissue and sample size, respectively.
Figure 2.
Figure 2.
Genes and variants associated with AMD using retina eQTL data (n = 406 retinas) and summary level AMD-GWAS data (based on z-scores of two-sided t-tests using 33,976 individuals). (a) Violin plots of the relationship between the variant at a GWAS locus and the target gene identified by eCAVIAR. At three loci, the target gene shown was the only one significantly associated (FDR ≤ 0.05) by TWAS. The y-axis represents the distribution of expression levels (CPM) of each gene, whereas the x-axis shows the genotype (orange; homozygous minor allele, green; homozygous major allele, and blue; heterozygous) for a given SNP. Box plots depict the median (thick black horizontal bar), the interquartile range, and minimum and maximum CPM values. (b) TWAS results (n = 406 retinas) for genes that pass Bonferroni-corrected significance identified within 1 Mb on either side of the lead SNP at previously-reported GWAS loci. PLEKHA1 (TWAS P value = 7.91 × 10−119) was omitted for appropriate scaling, and the horizontal lines indicate y-axis break. (c) Manhattan plot of TWAS-identified genes outside the reported lead SNP (> 1 Mb on either side) at the GWAS loci. Of the genes with expression model R2 > 0.01, 23 genes met the FDR threshold of 0.05 (red line), and three of these passed Bonferroni-corrected significance (cutoff shown as blue line). (d) LocusZoom plots showing empirical GWAS association for top three TWAS signals outside GWAS loci. The diamonds indicate top eVariants for independent eQTL signals. The coloration of the points is determined by their LD with respect to the eQTL in purple. The top GWAS variant in the region is also labeled. The recombination rate is shown as a blue line.

References

    1. Fritsche LG, et al. Age-related macular degeneration: genetics and biology coming together. Annu Rev Genomics Hum Genet 15, 151–171 (2014). - PMC - PubMed
    1. Grassmann F, Ach T, Brandl C, Heid IM & Weber BHF What Does Genetics Tell Us About Age-Related Macular Degeneration? Annu Rev Vis Sci 1, 73–96 (2015). - PubMed
    1. Fritsche LG, et al. A large genome-wide association study of age-related macular degeneration highlights contributions of rare and common variants. Nat Genet 48, 134–143 (2016). - PMC - PubMed
    1. Small KS, et al. Identification of an imprinted master trans regulator at the KLF14 locus related to multiple metabolic phenotypes. Nat Genet 43, 561–564 (2011). - PMC - PubMed
    1. Consortium, G.T., et al. Genetic effects on gene expression across human tissues. Nature 550, 204–213 (2017). - PMC - PubMed

Publication types

MeSH terms