. 2019 Mar;22(3):401-412.
doi: 10.1038/s41593-018-0332-9. Epub 2019 Feb 11.

Mitophagy inhibits amyloid-β and tau pathology and reverses cognitive deficits in models of Alzheimer's disease

Affiliations

Mitophagy inhibits amyloid-β and tau pathology and reverses cognitive deficits in models of Alzheimer's disease

Evandro F Fang et al. Nat Neurosci. 2019 Mar.

Abstract

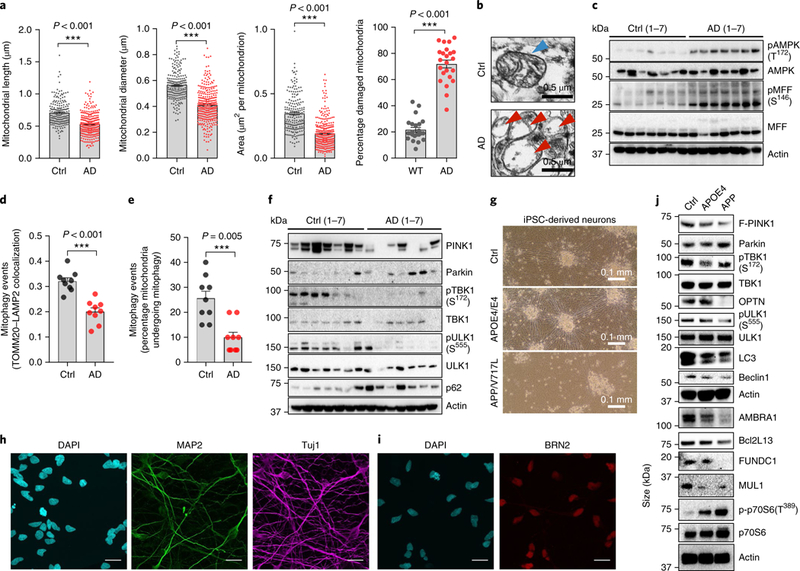
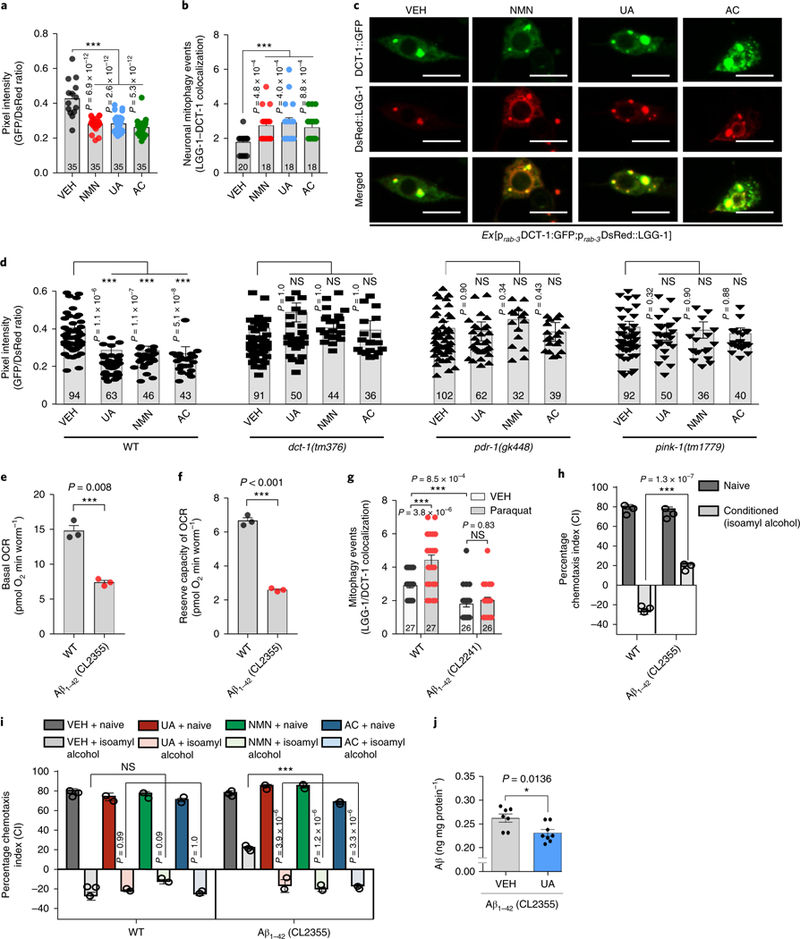
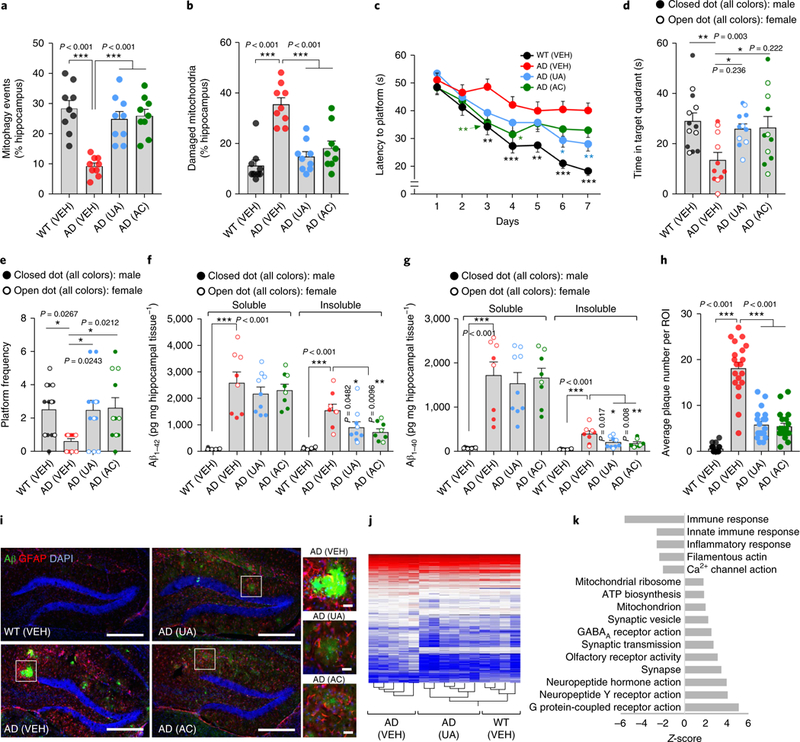
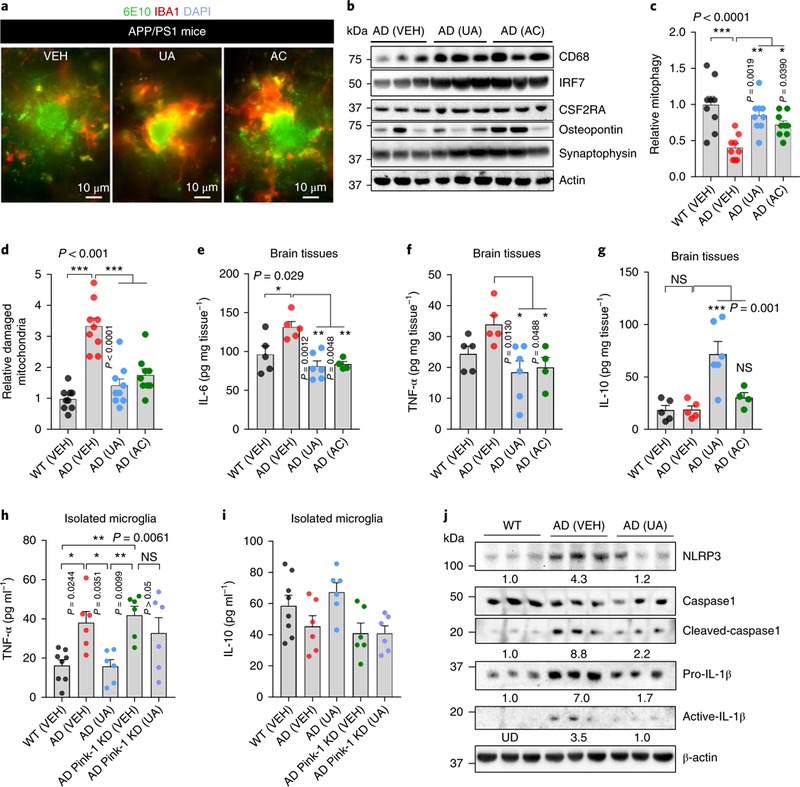
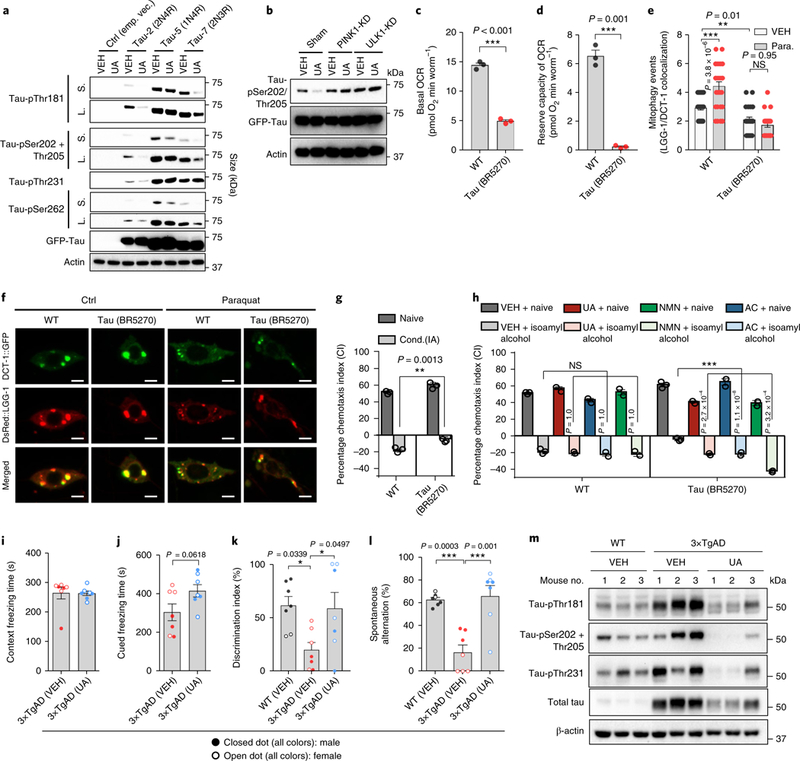
Accumulation of damaged mitochondria is a hallmark of aging and age-related neurodegeneration, including Alzheimer's disease (AD). The molecular mechanisms of impaired mitochondrial homeostasis in AD are being investigated. Here we provide evidence that mitophagy is impaired in the hippocampus of AD patients, in induced pluripotent stem cell-derived human AD neurons, and in animal AD models. In both amyloid-β (Aβ) and tau Caenorhabditis elegans models of AD, mitophagy stimulation (through NAD+ supplementation, urolithin A, and actinonin) reverses memory impairment through PINK-1 (PTEN-induced kinase-1)-, PDR-1 (Parkinson's disease-related-1; parkin)-, or DCT-1 (DAF-16/FOXO-controlled germline-tumor affecting-1)-dependent pathways. Mitophagy diminishes insoluble Aβ1-42 and Aβ1-40 and prevents cognitive impairment in an APP/PS1 mouse model through microglial phagocytosis of extracellular Aβ plaques and suppression of neuroinflammation. Mitophagy enhancement abolishes AD-related tau hyperphosphorylation in human neuronal cells and reverses memory impairment in transgenic tau nematodes and mice. Our findings suggest that impaired removal of defective mitochondria is a pivotal event in AD pathogenesis and that mitophagy represents a potential therapeutic intervention.


Figures

Fig. 1 |
Fig. 1 |. Mitochondrial dysfunction and defective mitophagy in human patient brain samples and AD patient iPSC-derived cultured neurons.
a, Quantification of mitochondrial parameters from electron microscopy images in postmortem human hippocampal tissue from AD patients and age-matched healthy controls; n = 300 mitochondria from 7 AD patients or 203 mitochondria from 7 healthy controls (ctrl). The center value represents the mean and the error bars represent the s.e.m. (***P< 0.001; two-sided Student’s t test). b, Representative set of electron microscopy images. c, Relative levels of proteins implicated in the AMPK pathway in postmortem human hippocampal tissue from AD patients and age-matched healthy controls. d, Quantification of the colocalization of the mitochondrial protein T0MM20 and the lysosomal protein LAMP2 using IHC. The center value represents the mean and the error bars represent the s.e.m. (n = 9 random fields from 3 AD patients or 3 healthy controls; ***P< 0.001; two-sided Student’s t test). e, Quantification of mitophagy-like events using electron microscopy images in postmortem human hippocampal tissue between AD patients and age-matched healthy controls. The center value represents the mean and the error bars represent the s.e.m. (n = 9 random fields from 3 AD patients or 3 healthy controls; ***P< 0.001; two-sided Student’s t test). f, Changes of designated mitophagy proteins in postmortem human hippocampal tissue from AD patients and age-matched healthy controls (n = 7 individuals for both the AD group and the healthy control group). g, Representative images of iPSC-derived neurons from an APP-mutation patient, an AP0E4 patient and healthy age-matched control cell line (28-day differentiation). h, Immunofluorescence microscopy for DAPI (nuclear staining), MAP2 (dendrite staining), and Tuj1 (staining of neuron-specific class III β-tubulin) in the control line neurons; scale bars, 50 μm. i, Immunofluorescence microscopy for DAPI (nuclear staining) and BRN2 (cortical upper layer marker) in the control line neurons; scale bars, 50 μm. j, Levels of mitophagy-related proteins in iPSC-derived neurons in three iPSC cell lines. c,f–j, A t least three experiments were repeated independently with similar results. Full scans of all the blots are in the Supplementary Note.
Fig. 2 |
Fig. 2 |. Mitophagy induction restores memory in Aβ1–42 C. elegans model of AD.
a, Transgenic animals expressing the mtRosella biosensor in neuronal cells were treated with NMN, UA, and AC. Relative levels of neuronal mitophagy are expressed as the ratio between pH-sensitive GFP fluorescence intensity and pH-insensitive DsRed fluorescence intensity. The center value represents the mean and the error bars represent the s.e.m. (n = 35 nematodes per group; ***P < 0.001; one-way ANOVA followed by Šidák’s multiple-comparisons test). VEH, vehicle. b, Transgenic nematodes were treated with NMN, UA, and AC. Mitophagy events were calculated by the colocalization between the autophagic marker DsRed::LGG-1 and the mitophagy receptor DCT-1::GFP in neurons. The center value represents the mean and the error bars represent the s.e.m. (n = 18–20 neurons per group as detailed in the figure; ***P < 0.001; one-way ANOVA followed by Šidák’s multiple-comparisons test). c, Representative images of b; scale bars, 5 μm. d, Transgenic nematodes expressing the mtRosella biosensor in neuronal cells treated with NMN, UA, and AC. The decreased GFP/DsRed ratio of mtRosella indicates neuronal mitophagy stimulation. DCT-1, PDR-1, and PINK-1 were required for neuronal mitophagy induction in response to UA, NMN, and AC treatment. The center value represents mean and error bars represent s.e.m. (n = 32–102 nematodes per group as detailed in the figure; NS (not significant), P > 0.05, and ***P < 0.001; one-way ANOVA followed by Šidák’s multiple comparisons test). e,f, Nematodes expressing Aβ1–42 display decreased basal levels (e) and reserve capacity (f) of OCR. The center value represents the mean and the error bars represent the s.e.m. (n = 3 independent experiments; ***P < 0.001; two-sided Student’s t test). g, Mitophagy events were reduced in the neuronal cells of Aβ1–42-expressing nematodes under control and oxidative stress (paraquat/paraquat 8 mM) conditions. The center value represents the mean and the error bars represent the s.e.m. (n = 26–27 neurons per group as detailed in the figure; NS, P > 0.05 and ***P < 0.001; one-way ANOVA followed by Šidák’s multiple-comparisons test). h, Aversive conditioning (to isoamyl alcohol in the absence of food) is impaired in transgenic animals expressing Aβ1–42 (CL2355 strain) in neurons. The bars depict the chemotaxis indices toward isoamyl alcohol, monitored for either naïve or conditioned WT and Aβ1–42-expressing nematodes. The center value represents the mean and the error bars represent the s.e.m. (n = 400 nematodes per group; ***P < 0.001; two-way ANOVA followed by Tukey’s multiple-comparisons test). i, Dietary supplementation with UA, NMN, or AC improves associative memory in transgenic nematodes expressing Aβ1–42 (CL2355 strain). The bars depict the chemotaxis indices toward isoamyl alcohol, measured for either naïve or conditioned WT and Aβ1–42-expressing nematodes with or without UA, NMN, or AC treatment. The center value represents the mean and the error bars represent the s.e.m. (n = 400 nematodes per group; ***P < 0.001; two-way ANOVA followed by Tukey’s multiple-comparisons test). Experiments for the data in h and i were performed together and thus share the same data for the VEH groups. j. UA reduces Aβ peptides in CL2355 nematodes (day 5). The center value represents the mean and the error bars represent the s.e.m. (n = 7 biologically independent samples in the VEH group or 8 biologically independent samples in the UA-treated group; *P < 0.05; two-sided Student’s t-test). For all nematode experiments, two to four independent experiments were performed.
Fig. 3 |
Fig. 3 |. Mitophagy induction ameliorates Aβ pathology and cognitive decline in APP/PS1 AD mice.
APP/PS1 mice were treated with UA (200 mg kgday−1) or AC (30 mg kgday−1) by daily gavage for 2 months starting from 6 months of age; then, behavioral tests were performed and brains were subjected to histological and molecular analyses. a,b, Electron microscopy analysis shows that hippocampal neurons in UA- and AC-treated AD mice display increased mitophagy-like events (a) and removal of damaged mitochondria (b). Center values represent means and the error bars represent s.e.m. (n = 9 random fields from 3 mice; ***P< 0.001; one-way ANOVA). c, Latency to escape to a hidden platform in the MWM during a 7-d training period. Day 3: WT versus AD (VEH), P = 0.0010; AD (VEH) versus AD (AC), P = 0.0052. Day 4: WT versus AD (VEH), P = 0.0006; AD (VEH) versus AD (AC), P= 0.0317. Day 5: WT versus AD (VEH), P= 0.0063. Day 6: WT versus AD (VEH), P< 0.0001; AD (VEH) versus AD (UA), P = 0.0137. Day 7: WT versus AD (VEH), P< 0.0001; AD (VEH) versus AD (UA), P= 0.0060 (n = 13 mice in the WT (VEH) group, or n = 11 mice in all the other groups; *P< 0.05, **P< 0.01, ***P< 0.001; two-way ANOVA followed by Tukey’s multiple-comparisons test). d,e, Further analysis of the MWM test; time in the target quadrant in the probe trial (d) and number of times mice passed through the platform location in the probe trial (e). The center value represents the mean and the error bars represent the s.e.m. (n = 13 mice in the WT (VEH) group or n = 11 mice in all the other groups; *P<0.05, **P< 0.01; one-way ANOVA). f,g, Soluble and insoluble Aβ1–42 and Aβ1–40 levels in hippocampal tissues. The center value represents the mean and the error bars represent the s.e.m. (n = 9 mice in the AD UA group; n = 8 mice in all the other groups; *P<0.05, **P< 0.01; one-way ANOVA). h, The number of Aβ plaques is decreased on UA and AC treatment in the hippocampus. The center value represents the mean and the error bars represent the s.e.m. (n = 20 random areas in the ROIs from 3 mice; ***P< 0.001; one-way ANOVA). i, IHC of amyloid plaques (6E10 antibody), astrocytes (GFAP antibody), and DAPI. Scale bar, 200 μm; insets: scale bar, 20 μm. The experiments were repeated twice independently with similar results. j, Heat map of differentially expressed genes as determined by microarray of hippocampal tissues. k, Transcriptomic analysis of GO pathways between AD (UA) and AD (VEH). Error bars show±s.e.m. j,k, n = 5, 6, and 4 mice for AD (VEH), AD (UA), and WT (VEH), respectively.
Fig. 4 |
Fig. 4 |. Mitophagy induction promotes phagocytic activity of microglia and inhibits neuronal inflammation in APP/PS1 AD mice.
a, Representative images showing microglial cells engulfing or near Aβ plaques. Aβ plaques are shown in green (6E10 antibody) and microglia (anti-lbal antibody) are in red. b, Effects of UA and AC on the expression level of proteins involved in microglial phagocytosis and synaptic function in the hippocampus (n = 3 mice per group). c,d, Electron microscopy data show elevation of mitophagy-like events (c) and diminished mitochondrial damage (d) in response to UA and AC administration. The center value represents the mean and the error bars represent the s.e.m. (n = 3 mice per group; *P<0.05, **P<0.01, ***P< 0.001; one-way ANOVA). e-g, The levels of the indicated cytokines were altered on UA- and AC-induced mitophagy. The center value represents the mean and the error bars represent the s.e.m. (n = 5 mice in WT (VEH), n = 5 mice in AD (VEH), n = 6 in AD (UA), and n = 4 in AD (AC); NS, P> 0.05 and *P<0.05, **P< 0.01, ***P< 0.001; one-way ANOVA). h,i, UA inhibits inflammation in microglia isolated from APP/PS1 mice via PINK-1-dependent mitophagy. CD11b+, CD45low microglial cells were isolated from the brain tissue of WT and APP/PS1 mice through a FACS sorting system. Cells were then cultured to knock down Pink1, followed by the treatment of UA (50μM for 24h). Cytokines were detected using commercial ELISA kits. The center value represents the mean and the error bars represent the s.e.m. (n = 8 mice in the WT (VEH) group, or n = 6 in the other groups; *P< 0.05; one-way ANOVA). j, Western blot data showing the effects of UA on the expression levels of proteins involved in NLRP3 inflammasome activity and inflammation in the cortical tissue of the mice (n = 3 mice per group). Numbers inserted are the mean of the average protein level per 3 samples; UD, undetected. Tissues/cells from 8-month- old mice were used for the experiments. Full scans of all the blots are in the Supplementary Note.
Fig. 5 |
Fig. 5 |. Mitophagy induction inhibits tau hyperphosphorylation in human neuronal cells and enhances memory in a tau C. elegans model and a 3×TgAD mouse model.
a, Levels of p-tau in human SH-SY5Y neuroblastoma cells overexpressing 2N4R, 1N4R, 2N3R tau, or empty vector, which had been treated for 24 h with either VEH or 50 μM UA. S, short exposure; L, long exposure of the same blot. Two independent experiments were performed with similar results. b, UA-induced inhibition of p-tau at Ser202/Thr205 is dependent on PINK-1 and ULK1. Two independent experiments were performed with similar results. c,d, Nematodes expressing tau present decreased basal levels (c) and reserve capacity (d) of OCR. The center value represents the mean and the error bars represent the s.e.m. (n = 3 independent experiments; ***P < 0.001; two-sided Student’s t test). e, Mitophagy events are reduced in neurons of tau-expressing nematodes under normal and oxidative stress (paraquat/paraquat 8 mM) conditions. The center value represents the mean and the error bars represent the s.e.m. (n = 30 neurons per group; NS, P > 0.05 and ***P < 0.001; one-way ANOVA followed by Šidák’s multiple comparisons). The experiments for this panel and Fig. 2g were performed together with the same WT control. f, Representative images of mitophagy events in WT and tau (BR527 strain) nematodes under normal and oxidative stress conditions (paraquat/paraquat 8 mM) in neurons. Colocalization of the mitophagy receptor DCT-1::GFP and the autophagosomal protein DsRed::LGG-1 indicates mitophagy events. Scale bars, 2 μm. g, Conditioning (cond.) to isoamyl alcohol in the absence of food is impaired in transgenic nematodes expressing human tau (BR5270 strain) in neurons. The bars depict the chemotaxis indices toward isoamyl alcohol, monitored for either naïve or conditioned WT and tau-expressing nematodes. The center value represents the mean and the error bars represent the s.e.m. (n = 400 nematodes per group; ***P < 0.001; two-way ANOVA followed by Tukey’s multiple-comparisons test). h, Supplementation of UA, NMN, or AC improves memory in transgenic animals expressing tau (BR5270 strain). The bars depict the chemotaxis indices toward isoamyl alcohol, measured for either naïve or conditioned WT and tau-expressing nematodes with or without UA, NMN, or AC treatment. The center value represents the mean and the error bars represent the s.e.m. (n = 400 nematodes per group; ***P < 0.001; two-way ANOVA followed by Tukey’s multiplecomparisons test). The experiments for g were performed together with h; thus, they share the same data for the VEH group. il, Treatment with UA for 1 month improves memory performance and inhibits p-tau in 3× TgAD mice. Thirteen-month-old 3× TgAD mice were treated with UA (200 mg kg day−1) by daily gavage for 1 month. Contextual and cued fear conditioning (i,j), object recognition (k), and Y-maze (l) tests were performed. il, The center value represents the mean and the error bars represent the s.e.m. (n = 7; *P < 0.05, ***P < 0.001; a two-sided Student’s t test was used for i and j, while one-way ANOVA was used for k and l). m, A western blot was used to evaluate changes of designated p-tau sites using hippocampal tissues from killed mice (n = 3). All error bars ± s.e.m. Full scans of all the blots are in the Supplementary Note.

Comment in

References

    1. Scheibye-Knudsen M, Fang EF, Croteau DL, Wilson DM 3rd & Bohr VA Protecting the mitochondrial powerhouse. Trends Cell Biol. 25, 158–170 (2015). - PMC - PubMed
    1. Kerr JS et al. Mitophagy and Alzheimer’s disease: cellular and molecular mechanisms. Trends Neurosci. 40, 151–166 (2017). - PMC - PubMed
    1. Lustbader JW et al. ABAD directly links Aß to mitochondrial toxicity in Alzheimer’s disease. Science 304, 448–452 (2004). - PubMed
    1. Sorrentino V et al. Enhancing mitochondrial proteostasis reduces amyloid-β proteotoxicity. Nature 552, 187–193 (2017). - PMC - PubMed
    1. Devi L, Prabhu BM, Galati DF, Avadhani NG & Anandatheerthavarada HK Accumulation of amyloid precursor protein in the mitochondrial import channels of human Alzheimer’s disease brain is associated with mitochondrial dysfunction. J. Neurosci. 26, 9057–9068 (2006). - PMC - PubMed

Publication types

Substances