. 2019 Mar;22(3):413-420.
doi: 10.1038/s41593-018-0329-4. Epub 2019 Feb 11.

Neutrophil adhesion in brain capillaries reduces cortical blood flow and impairs memory function in Alzheimer's disease mouse models

Affiliations

Neutrophil adhesion in brain capillaries reduces cortical blood flow and impairs memory function in Alzheimer's disease mouse models

Jean C Cruz Hernández et al. Nat Neurosci. 2019 Mar.

Abstract

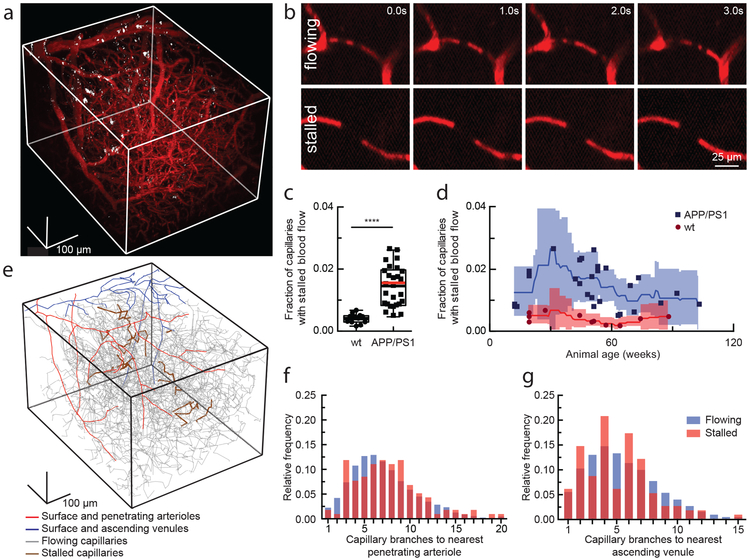
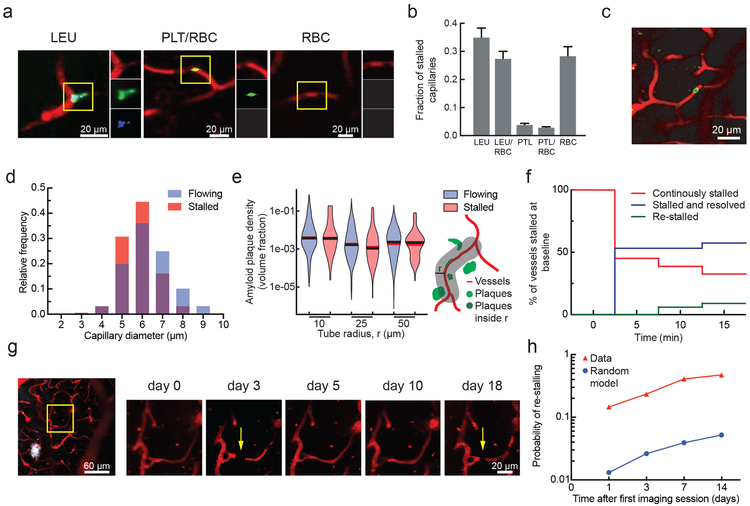
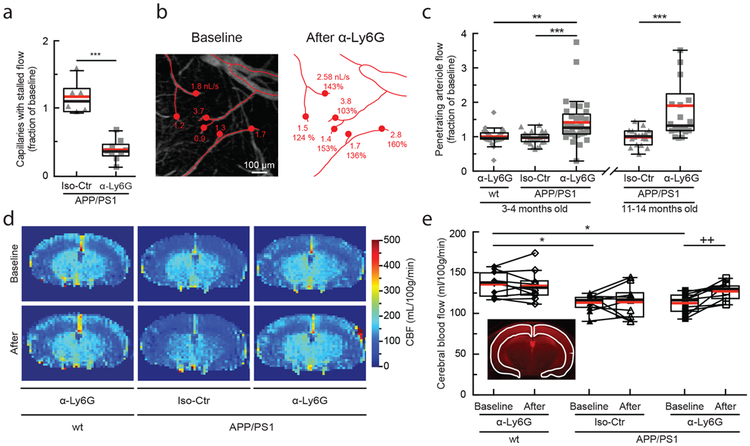
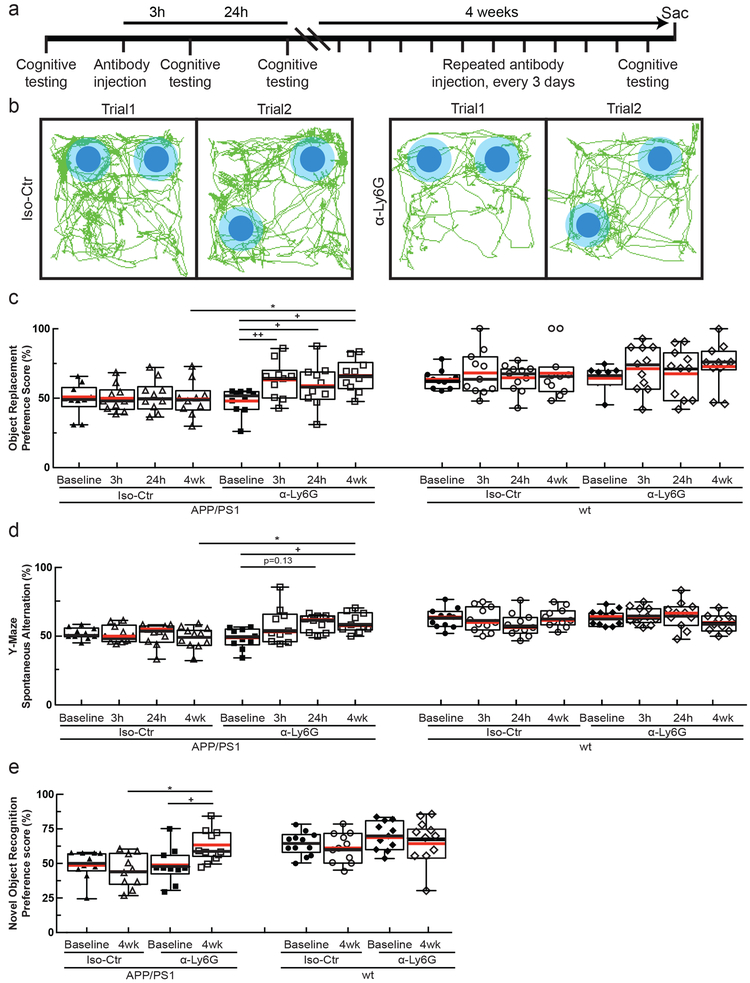
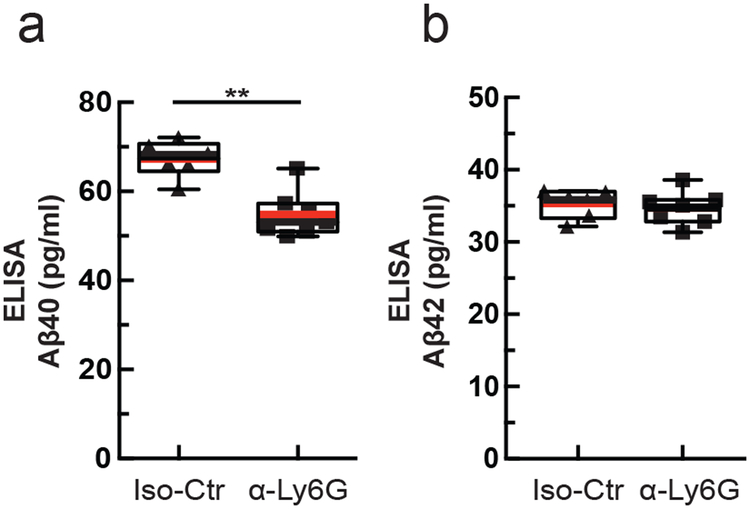
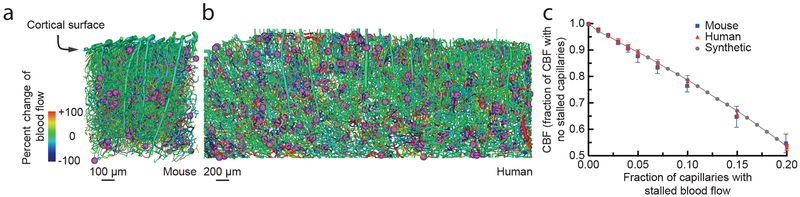
Cerebral blood flow (CBF) reductions in Alzheimer's disease patients and related mouse models have been recognized for decades, but the underlying mechanisms and resulting consequences for Alzheimer's disease pathogenesis remain poorly understood. In APP/PS1 and 5xFAD mice we found that an increased number of cortical capillaries had stalled blood flow as compared to in wild-type animals, largely due to neutrophils that had adhered in capillary segments and blocked blood flow. Administration of antibodies against the neutrophil marker Ly6G reduced the number of stalled capillaries, leading to both an immediate increase in CBF and rapidly improved performance in spatial and working memory tasks. This study identified a previously uncharacterized cellular mechanism that explains the majority of the CBF reduction seen in two mouse models of Alzheimer's disease and demonstrated that improving CBF rapidly enhanced short-term memory function. Restoring cerebral perfusion by preventing neutrophil adhesion may provide a strategy for improving cognition in Alzheimer's disease patients.


Figures

Fig. 1.
Fig. 1.. 2PEF imaging of mouse cortical vasculature revealed a higher fraction of plugged capillaries in APP/PS1 mice.
(a) Rendering of 2PEF image stack of cortical vasculature (red; Texas Red dextran) and amyloid deposits (white; methoxy-X04). (b) Individual brain capillaries were scored as flowing or stalled based on the motion of unlabeled blood cells (black) within the fluorescently labeled blood plasma (red). (c) Fraction of capillaries with stalled blood flow in APP/PS1 and wt mice. (APP/PS1: n = 28 mice (7 female, 21 male), ~22,400 capillaries, and wt: n = 12 mice (10 female, 2 male), ~9,600 capillaries; Two-tailed Mann-Whitney, p=6.8 X 10⁻⁹; Boxplot: whiskers extend 1.5 times the difference between the value of the 75th and 25th percentile, median=black line and mean= red line.) (d) same data in c shown as a function of animal age. Each data point represents the fraction of capillaries stalled in one mouse, with a minimum of 800 capillaries scored per mouse. Curves represent sliding averages with a 10-week window and shaded areas represent 95% confidence intervals. Data from one outlier mouse not shown in c and d: APP/PS1, 42 weeks, 4.4% stalled. (e) Tracing of the vascular network in panel a, with stalled capillaries indicated in brown. (f) and (g) Histograms showing the topological location of flowing and stalled capillaries in APP/PS1 mice relative to the nearest penetrating arteriole and ascending venule, respectively (n = 8 mice (5 female, 3 male), 120 stalled and ~8,700 flowing capillaries).
Fig. 2.
Fig. 2.. Characterization of the cause, location, and dynamics of capillary occlusions in APP/PS1 mice.
(a) 2PEF images of stalled capillaries that contained a leukocyte (LEU, left), platelet aggregates (PLT) and RBCs (center), or only RBCs (right), distinguished by fluorescent labels (red: Texas Red-labeled blood plasma; green: rhodamine 6G-labeled leukocytes and platelets; blue: Hoechst-labeled leukocyte nuclei). (b) Fraction of stalled capillaries in APP/PS1 mice that contained LEU, one or more RBCs, and PLT, distinguishing cases of LEU only, LEU with one or more RBCs, PLT only, PLT with RBCs, and RBCs only (n = 6 mice (3 female, 3 male) and 106 stalls; error bars represent 95% confidence intervals based on binomial statistics.) (c) Projection of 2PEF image stack showing an anti-Ly6G labeled cell in a stalled capillary (red: Texas Red-labeled blood plasma; green: anti-Ly6G-Alexa 488 (0.1 mg/kg animal weight, intravenous). (d) Histogram of the diameter of flowing and stalled capillaries in APP/PS1 mice (Averages: 5.8±0.84 µm (stalled), 6.3±1.1 µm (flowing) (mean±SD); Two-tailed Mann-Whitney, p=0.000020; n = 7 mice (4 female, 3 male), 116 stalled and ~8,400 flowing capillaries). (e) Violin plot of the density of amyloid deposits within tubes of different radii that followed the capillary centerline for flowing and stalled capillary segments in APP/PS1 mice (n = 7 mice (4 female, 3 male), 116 stalled and ~8,400 flowing capillaries). The vertical range of the violin plot represents the full range of measured values, while the width of the violin indicates the frequency of those values. The red (black) horizontal line indicates the mean (median) value. (f) Fraction of stalled capillaries that remained stalled (red), resumed flowing (green), or resumed flowing and then re-stalled (blue) over 15 minutes in APP/PS1 mice (n = 3 mice (all male), 31 capillary segments). (g) 2PEF images of the same capillary alternately stalled (arrows) and flowing over several weeks (white: methoxy-X04). (h) Probability of an initially stalled capillary to be observed stalled again at any subsequent imaging time point, showing both real observations in APP/PS1 mice and predictions from a model that assumed each capillary had an equal probability of stalling at each time point (n=4 mice (2 female, 2 male), 49 stalled capillaries followed from the first imaging session).
Fig. 3.
Fig. 3.. Administration of antibodies against Ly6G reduced the number of stalled capillaries and increased cCBF in APP/PS1 mice.
(a) Number of capillaries with stalled blood flow ~1 hr after α-Ly6G or Iso-Ctr antibody administration (4 mg/kg animal weight, intraperitoneal) shown as a fraction of the number of stalled capillaries at baseline in APP/PS1 mice (α-Ly6G: n = 6 mice (3 female, 3 male), ~4,800 capillaries; Iso-Ctr: n = 6 mice (5 female, 1 male), ~4,800 capillaries; two-tailed Mann-Whitney, p=0.0004). (b) Projection of 2PEF image stack of brain surface vasculature, with surface (red lines) and penetrating (red dots) arterioles identified. For each penetrating arteriole, volumetric blood flow is indicated at baseline (left) and after α-Ly6G administration (right), along with the percentage of baseline flow. (c) Volumetric blood flow in penetrating arterioles measured 60-90 min after α-Ly6G or Iso-Ctr antibody administration in young and old APP/PS1 mice and wt control animals shown as a fraction of baseline arteriole flow (young APP/PS1 Iso-Ctr: n = 5 mice (1 female, 4 male), 32 arterioles; old APP/PS1 Iso-Ctr: n = 3 mice (1 female, 2 male), 18 arterioles; young wt α-Ly6G: n = 5 mice (3 female, 2 male), 30 arterioles; young APP/PS1 α-Ly6G: n = 5 (2 female, 3 male), 33 arterioles; old APP/PS1 α-Ly6G: n = 3 mice (all male), 22 arterioles; one-way Kruskal-Wallis ANOVA with post-hoc using Dunn’s multiple comparison correction: young wt α-Ly6G vs. young APP/PS1 α-Ly6G p = 0.0023; young APP/PS1 Iso-Ctr vs. young APP/PS1 α-Ly6G p = 0.0000012; old APP/PS1 Iso-Ctr vs. old APP/PS1 α-Ly6G p = 0.00055). (d) CBF map measured using ASL-MRI at baseline and ~5 hr after administration of α-Ly6G or Iso-Ctr antibodies in APP/PS1 and wt mice. (e) cCBF measurements (ASL-MRI, inset indicates ROI on T2 MRI image) at baseline and ~5 hr after administration of α-Ly6G or Iso-Ctr antibodies in APP/PS1 and wt mice (wt α-Ly6G: n = 10 mice, APP/PS1 α-Ly6G: n = 10 mice, APP/PS1 Iso-Ctr: n = 10 mice; Ordinary one-way ANOVA with post hoc using Tukey’s multiple comparison correction to compare across groups: baseline wt α-Ly6G vs. baseline APP/PS1 α-Ly6G p=0.011; baseline wt α-Ly6G vs. baseline APP/PS1 Iso-Ctr p=0.014; Paired t-test to compare baseline and after treatment within a group: baseline APP/PS1 α-Ly6G vs. after APP/PS1 α-Ly6G p=0.0058). All boxplots are defined as: whiskers extend 1.5 times the difference between the value of the 75th and 25th percentile, median=black line and mean= red line.
Fig. 4.
Fig. 4.. Administration of α-Ly6G improved short-term memory.
(a) Experimental timeline for behavioral studies. (b) Tracking of mouse nose location from video recording during training and trial phases of OR task taken 3-5 hr after administration of α-Ly6G or Iso-Ctr antibodies in APP/PS1 mice (representative tracing maps). (c) Preference score in OR task and (d) spontaneous alternation in Y-maze task for APP/PS1 and wt mice at baseline and at 3 hr and 24 hr after a single administration of α-Ly6G or Iso-Ctr antibodies, and after 4 weeks of treatment every three days. (e) Preference score in NOR task for APP/PS1 and wt mice at baseline and after 4 weeks of treatment every three days. (APP/PS1 Iso-Ctr: n=10 mice (5 female, 5 female), APP/PS1 α-Ly6G: n=10 mice (5 female, 5 male), wt α-Ly6G: n=11 mice (7 female, 4 male), wt Iso-Ctr: n=11 mice (8 female, 3 male); one-way Kruskal-Wallis ANOVA with post-hoc using Dunn’s multiple comparison correction to compare across groups: Object replacement APP/PS1 4wk Iso-Ctr vs. α-Ly6G p=0.029; Y-maze APP/PS1 4wk Iso-Ctr vs. α-Ly6G p=0.037; Novel object APP/PS1 4wk Iso-Ctr vs. α-Ly6G p=0.038; Friedman one-way repeated measures non-parametric ANOVA to compare baseline and after treatment results within a group: Object replacement APP/PS1 α-Ly6G baseline vs. 3 h p=0.0055, baseline vs. 24h p=0.016, baseline vs. 4wk p=0.045; Y-maze APP/PS1 α-Ly6G baseline vs. 24h p=0.13, baseline vs 4wk p=0.036; two-tailed Wilcoxon matched-pairs signed rank test to compare baseline and post-treatment with novel object APP/PS1 α-Ly6G baseline vs 4wk p=0.039.) All boxplots are defined as: whiskers extend 1.5 times the difference between the value of the 75th and 25th percentile, median=black line and mean= red line. All data in this figure represents the aggregation of two independently-conducted sets of behavioral experiments.
Fig. 5.
Fig. 5.. Administration of α-Ly6G for one month decreased the concentration of Aβ1-40 in APP/PS1 mice.
ELISA measurements of (a) Aβ1-40 and (b) Aβ1-42 monomer concentrations after 4 weeks of treatment every three days (Iso-Ctr: n=6 mice (4 female, 2 male) and α-Ly6G: n=7 mice (4 female, 3 male); two-tailed Mann-Whitney p=0.0023). Boxplots are defined as: whiskers extend 1.5 times the difference between the value of the 75th and 25th percentile, median=black line and mean= red line.
Fig. 6.
Fig. 6.. Simulations predicted a similar CBF decrease in mouse and human cortical capillary networks with increasing fraction of capillaries with stalled flow.
Spatial maps of simulated blood flow changes caused by stalling of 2% of capillaries (indicated by purple spheres) in an mouse cortical vascular network (a, data on the structure and connectivity of murine cortical vascular network from ), and a human network (b, data on the structure and connectivity of human cortical vascular network from ). (c) Normalized cortical perfusion as a function of the fraction of capillaries that were occluded, expressed as a fraction of the perfusion with no occlusions, in mouse, human, and synthetic networks (data points represent the mean and error bars represent the SD across five independent simulations).

References

    1. Wang J, Gu BJ, Masters CL & Wang YJ A systemic view of Alzheimer disease - insights from amyloid-beta metabolism beyond the brain. Nature reviews. Neurology 13, 612–623, doi:10.1038/nrneurol.2017.111 (2017). - DOI - PubMed
    1. Santos CY et al. Pathophysiologic relationship between Alzheimer’s disease, cerebrovascular disease, and cardiovascular risk: A review and synthesis. Alzheimer’s & dementia 7, 69–87, doi:10.1016/j.dadm.2017.01.005 (2017). - DOI - PMC - PubMed
    1. Iturria-Medina Y et al. Early role of vascular dysregulation on late-onset Alzheimer’s disease based on multifactorial data-driven analysis. Nature communications 7, 11934, doi:10.1038/ncomms11934 (2016). - DOI - PMC - PubMed
    1. Dai W et al. Mild cognitive impairment and alzheimer disease: patterns of altered cerebral blood flow at MR imaging. Radiology 250, 856–866, doi:10.1148/radiol.2503080751 (2009). - DOI - PMC - PubMed
    1. Wolters FJ et al. Cerebral Perfusion and the Risk of Dementia: A Population-Based Study. Circulation, doi:10.1161/CIRCULATIONAHA.117.027448 (2017). - DOI - PubMed

Methods-only References:

    1. Jankowsky JL et al. Mutant presenilins specifically elevate the levels of the 42 residue beta-amyloid peptide in vivo: evidence for augmentation of a 42-specific gamma secretase. Hum Mol Genet 13, 159–170, doi:10.1093/hmg/ddh019 (2004). - DOI - PubMed
    1. Oakley H et al. Intraneuronal beta-amyloid aggregates, neurodegeneration, and neuron loss in transgenic mice with five familial Alzheimer’s disease mutations: potential factors in amyloid plaque formation. The Journal of neuroscience : the official journal of the Society for Neuroscience 26, 10129–10140, doi:10.1523/JNEUROSCI.1202-06.2006 (2006). - DOI - PMC - PubMed
    1. Klunk WE et al. Imaging Abeta plaques in living transgenic mice with multiphoton microscopy and methoxy-X04, a systemically administered Congo red derivative. J Neuropathol Exp Neurol 61, 797–805 (2002). - PubMed
    1. Pologruto TA, Sabatini BL & Svoboda K ScanImage: flexible software for operating laser scanning microscopes. Biomed Eng Online 2, 13, doi:10.1186/1475-925X-2-13 (2003). - DOI - PMC - PubMed
    1. Dijkstra EW A note on two problems in connexion with graphs. Numerische Mathematik Volume 1, 269–271, doi:10.1007/BF01386390 (1959). - DOI

Publication types

MeSH terms