Randomized Controlled Trial
. 2019 Mar;25(3):477-486.
doi: 10.1038/s41591-018-0337-7. Epub 2019 Feb 11.

Neoadjuvant anti-PD-1 immunotherapy promotes a survival benefit with intratumoral and systemic immune responses in recurrent glioblastoma

Affiliations
Randomized Controlled Trial

Neoadjuvant anti-PD-1 immunotherapy promotes a survival benefit with intratumoral and systemic immune responses in recurrent glioblastoma

Timothy F Cloughesy et al. Nat Med. 2019 Mar.

Abstract

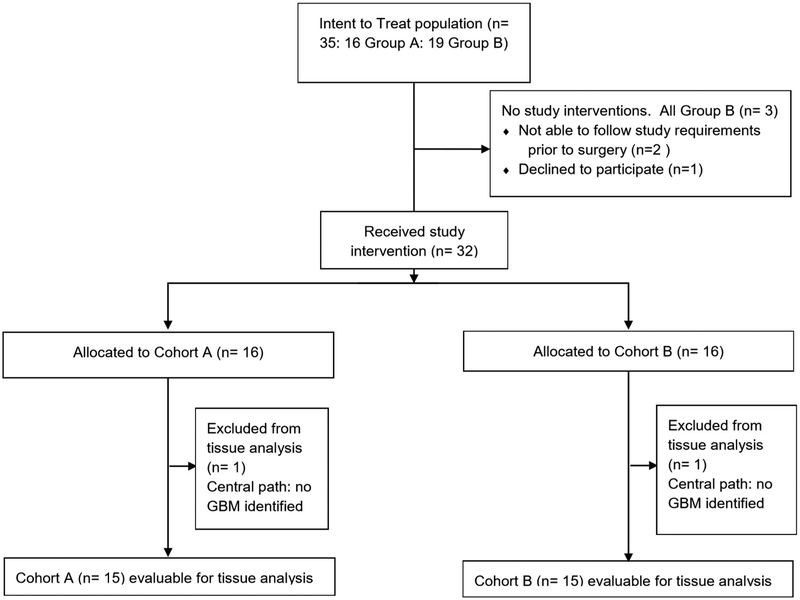
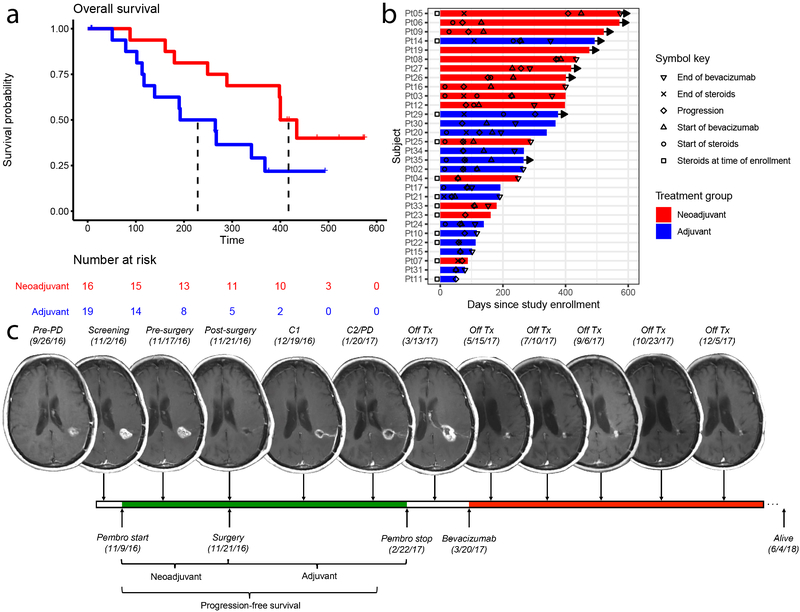
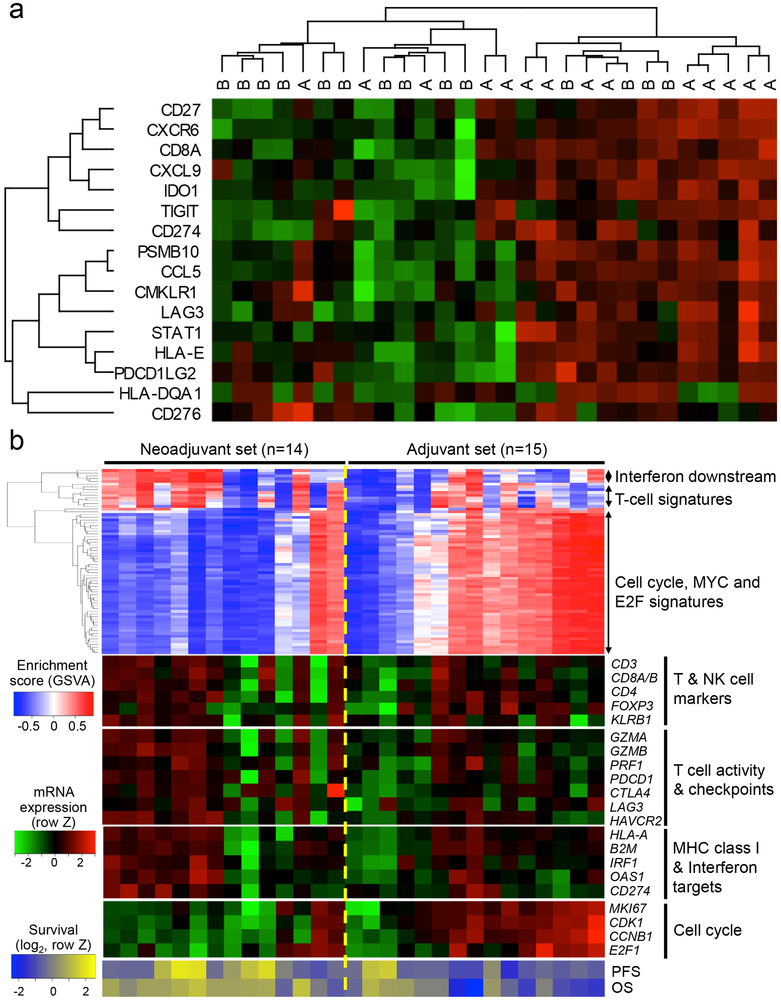
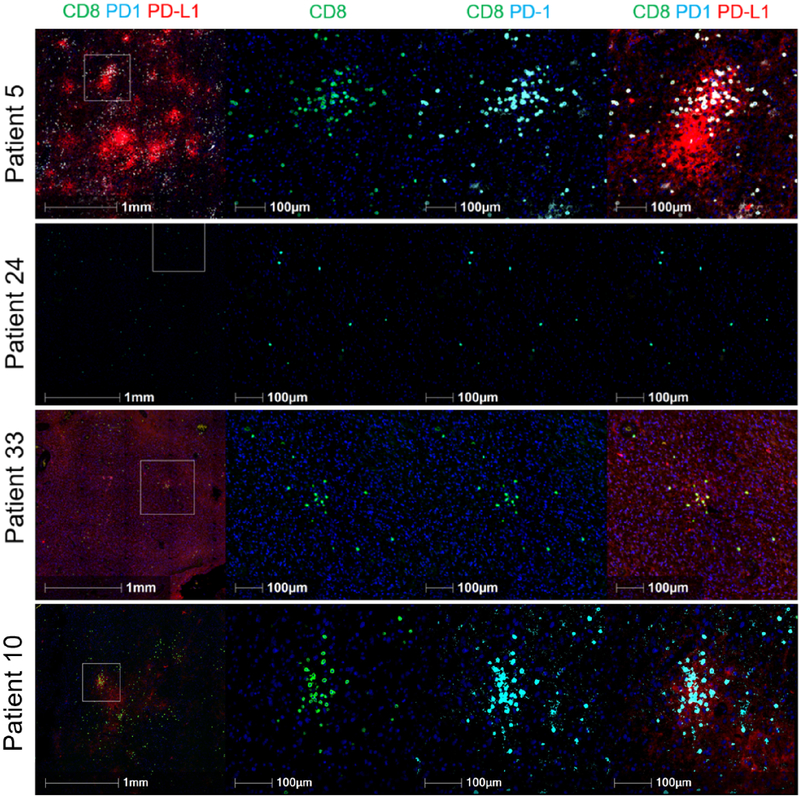
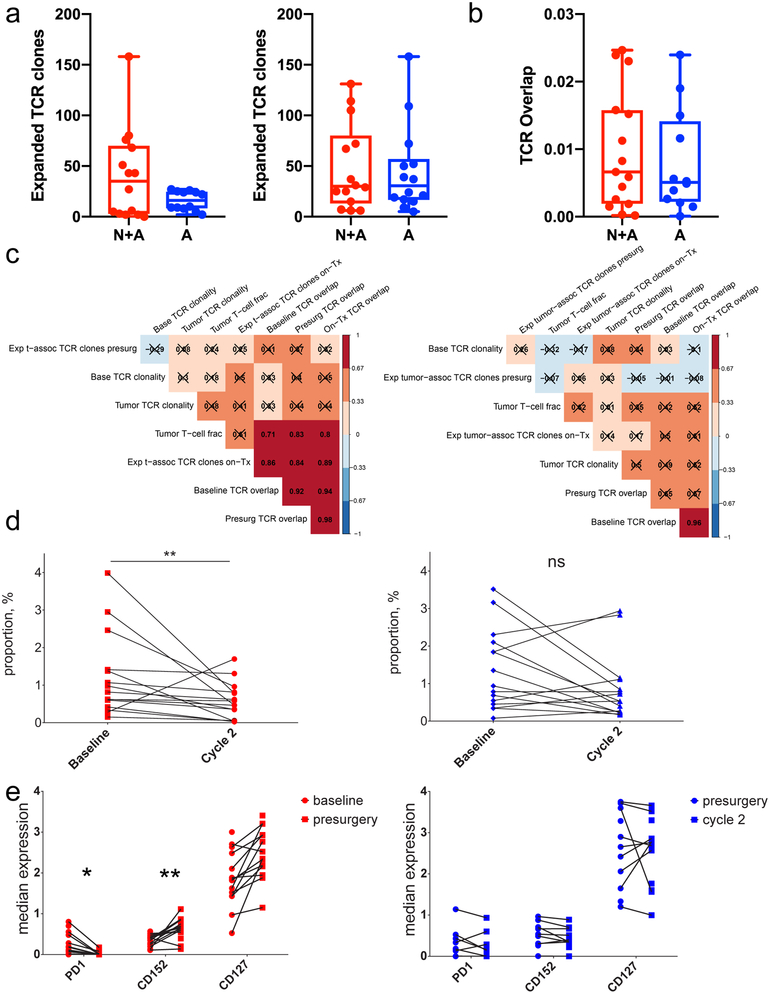
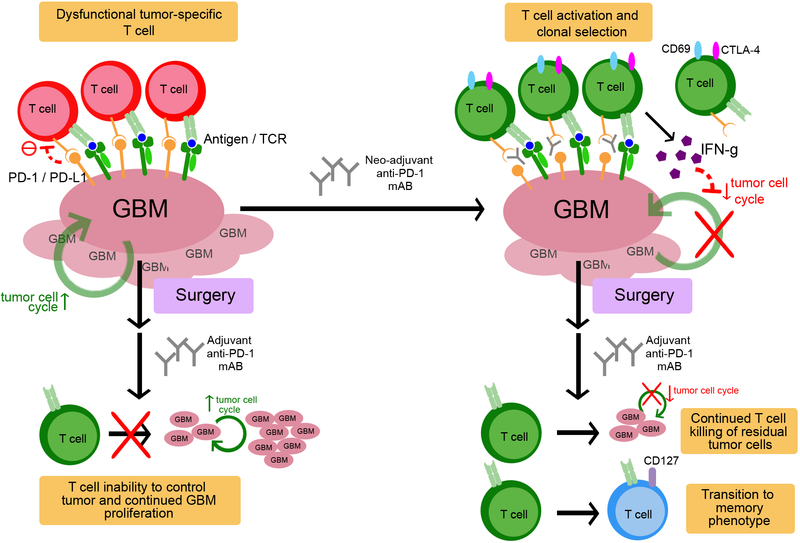
Glioblastoma is the most common primary malignant brain tumor in adults and is associated with poor survival. The Ivy Foundation Early Phase Clinical Trials Consortium conducted a randomized, multi-institution clinical trial to evaluate immune responses and survival following neoadjuvant and/or adjuvant therapy with pembrolizumab in 35 patients with recurrent, surgically resectable glioblastoma. Patients who were randomized to receive neoadjuvant pembrolizumab, with continued adjuvant therapy following surgery, had significantly extended overall survival compared to patients that were randomized to receive adjuvant, post-surgical programmed cell death protein 1 (PD-1) blockade alone. Neoadjuvant PD-1 blockade was associated with upregulation of T cell- and interferon-γ-related gene expression, but downregulation of cell-cycle-related gene expression within the tumor, which was not seen in patients that received adjuvant therapy alone. Focal induction of programmed death-ligand 1 in the tumor microenvironment, enhanced clonal expansion of T cells, decreased PD-1 expression on peripheral blood T cells and a decreasing monocytic population was observed more frequently in the neoadjuvant group than in patients treated only in the adjuvant setting. These findings suggest that the neoadjuvant administration of PD-1 blockade enhances both the local and systemic antitumor immune response and may represent a more efficacious approach to the treatment of this uniformly lethal brain tumor.


Figures

Fig. 1
Fig. 1. CONSORT diagram
Flow diagram of disposition of patients enrolled in the study.
Fig. 2
Fig. 2. Kaplan-Meier plot of progression-free survival
Median progression-free survival (PFS) for patients who received pembrolizumab only in the adjuvant setting was 72.5 days; patients who received neoadjuvant and adjuvant pembrolizumab had a median PFS of 99.5 days (HR = 0.43, 95% CI 0.20 to 0.90; two-sided P = 0.03 by log-rank test).
Fig. 3
Fig. 3. Eighteen gene interferon-γ-related signature scores in neoadjuvant versus adjuvant-only groups
Line at middle of box represents the median; box extends from the 25th to 75th percentiles; whiskers represent minimum and maximum values; n = 28 independent biological samples; P = 0.025, U = 49 by two-sided Mann-Whitney U test. *: P < 0.05.
Fig. 4
Fig. 4. RNAseq comparison to other recurrent glioblastoma samples
We combined our RNAseq dataset with that of GSE79671 (an RNAseq dataset of recurrent glioblastoma pre- and post- bevacizumab treatment; only pre-treatment (Pre-Tx) samples were used) and The Cancer Genome Atlas (TCGA) glioblastoma samples. We applied appropriate batch correction on log transformed, normalized mRNA expression values using the removeBatchEffect function in the R package limma to estimate the fraction of glioblastoma patients with positive enrichment of the cell cycle/cancer proliferation signatures (GSVA score ≤ 0.2). The proportion of positive enrichment of the cell cycle/cancer proliferation signatures in our dataset as a whole is similar to GSE79671 (14 out of 29 (48%) vs. 11 out of 20 (55%)). The number of samples with positive enrichment in the TCGA GBM is lower at 41%. We observed that neoadjuvant PD-1 monoclonal antibody therapy group is associated with lower fraction of tumors with the cell cycle signatures. There were only 3 out of 14 tumors in the neoadjuvant group demonstrating positive enrichment while there were 11 of 15 tumors in the adjuvant group and 11 of 20 tumors in the GSE79671 set (one-sided Fisher exact test P = 0.01 and P = 0.05, respectively). GSVA: gene set variation analysis.
Fig. 5
Fig. 5. RNAseq comparison to TCGA
We combined our RNAseq dataset with that of TCGA glioblastoma dataset with appropriate batch correction to estimate the fraction of glioblastoma patients with positive enrichment of the cell cycle/cancer proliferation signatures (GSVA score ≥ 0.2). Three out of 14 tumors in the neoadjuvant group demonstrated positive enrichment while there were 11 of 15 tumors in the adjuvant group and 73 of 166 tumors in The Cancer Genome Atlas set. TCGA: The Cancer Genome Atlas. GSVA: gene set variation analysis.
Fig. 6
Fig. 6. Mass cytometry dimension reduction
(a) Diffusion map of peripheral blood mononuclear cells (PBMCs) sampled from n = 28 patients at baseline, the time of surgery and on-treatment. Phenotypically similar cells are depicted in an unsupervised manner along the same continuous axes in a pseudotemporal progression. (b) t-distributed stochastic neighbor embedding (tSNE) plot of PBMCs from n = 28 patients at all three time points. Phenotypically similar cells are clustered in an unsupervised manner. All represented cells in both panels are colored by algorithmically assigned cluster numbers using the FlowSOM package. CD3+CD4+, CD3+CD8+, CD3−CD19+ and CD3−CD14+CD16+CD11b+CD11c+ cells are labelled to demonstrate how clustered cells are plotted in close proximity to one another.
Figure 1.
Figure 1.. Neoadjuvant pembrolizumab confers significant improvement in overall and progression-free survival in patients with recurrent glioblastoma.
Patients in the neoadjuvant arm (red) received 200 mg pembrolizumab 14±5 days prior to surgical resection; patients in the adjuvant-only arm (blue) did not; both groups received 200 mg adjuvant pembrolizumab every 3 weeks. (a) Kaplan-Meier plot of overall survival. Median overall survival for the patients receiving adjuvant treatment only was 228.5 days, whereas median survival in the neoadjuvant group was 417 days (hazard ratio (HR) 0.39 neoadjuvant/adjuvant; P = 0.04 by log-rank test, n = 35 patients). (b) Swimmer plot of individual patients depicting start and stop times of dexamethasone or equivalent (as recorded at study MRI visit) and/or bevacizumab, if applicable, as well as time to progression, in days after enrollment. Bars represent overall survival in days. Rightward arrow indicates that the patient was still alive at the time of final data collection. (c) Serial magnetic resonance imaging (MRI) scans of a representative patient from the neoadjuvant group. The patient, a 66-year old female in first recurrence, is IDH negative and MGMT unmethylated. IDH: isocitrate dehydrogenase. MGMT: O6-methylguanine DNA methyltransferase. PD: progression of disease. Pembro: pembrolizumab. Tx: treatment.
Figure 2.
Figure 2.. Tumor gene expression profile altered by neoadjuvant PD-1 blockade.
(a) Heat map of tumor mRNA expression of interferon-γ related gene panel for individual patients. Within this panel, “A” denotes patient in neoadjuvant group; “B” denotes patient in adjuvant-only group. Dendrograms represent unsupervised hierarchical clustering by Ward’s minimum distance. Green coloration represents decreased expression; red coloration represents increased expression. (b) (Top) Heatmap showing the gene set variation analysis (GSVA) enrichment scores of gene sets with interquartile range (IQR) ≥ 1. The gene sets can be grouped into the three categories: 1) interferon pathway induction, 2) T-cell activity and 3) cell cycle/proliferation. (Middle) The heatmap of mRNA expression of the representative genes corresponding to the gene set enrichments above. (Bottom) The heatmap of progression free- and overall survival of each patient (in log2 scale). MHC: major histocompatibility complex. OS: overall survival. PFS: progression-free survival.
Figure 3.
Figure 3.. Multiplex immunofluorescence imaging of tumor samples demonstrates varying degrees of PD-L1 expression and CD8+ T cell infiltration.
In the top panel, high CD8 infiltrate and focal PD-L1 expression are demonstrated in a patient tumor sample from the neoadjuvant group. In the second panel, low CD8+ T cell infiltrate and negative PD-L1 expression are seen in a patient tumor sample from the adjuvant-only group. In the third panel, a patient tumor sample from the neoadjuvant group demonstrates low CD8 infiltration with constitutive PD-L1 expression. In the bottom panel, a tumor sample from a patient in the adjuvant-only group demonstrates high CD8 infiltration with focal PD-L1 expression; however, the degree of PD-L1 expression is lower. Images on the left are depicted at lower magnification to demonstrate the difference between focal and constitutive PD-L1 expression and are representative of the entire tumor section/slide. Images second from the left show staining for CD8; second from the right, PD-1 stains are superimposed; on the right, the images depict co-staining for CD8, PD-1 and PD-L1. Multiplex staining was performed in one standardized run per patient. For each staining run, two sequential slides were used as duplicates for each patient. Computational analysis was performed two or more times per sample.
Figure 4.
Figure 4.. Neoadjuvant PD-1 blockade alters correlative relationships between blood and tumor repertoire features and alters circulating immune cell phenotypes.
(a) Box and whisker plots comparing the number of expanded T cell receptor clones between baseline and surgery (left; P = 0.07, two-tailed t test, t = 1.98, df = 14.33, 95% CI −1.94 to 50.7, n = 26 patients) and surgery and 1-2 cycles of pembrolizumab (right; P = 0.85, two-tailed t test, t = 0.19, df = 26.0, 95% CI −30.2 to 36.3, n = 28 patients). The Y axis denotes the number of expanded clones. (b) Box and whisker plot comparing the T cell receptor overlap between peripheral blood and tumor at the time of surgery (P = 0.59, two-tailed t test, t = 0.54, df = 24.8, 95% CI −0.01 to 0.008, n = 27 patients). On the Y axis, 0 indicates no clonal overlap and 1 indicates complete overlap. For panels (a) and (b), whiskers represent minima and maxima, boxes extend from 25th to 75th percentiles, middle line represents median. (c) Hierarchically ordered Spearman correlation plots of the T cell receptor sequencing data. Numbers indicate the Spearman correlation coefficient; boxes marked with an X had Benjamini-Hochberg adjusted, two-tailed P > 0.01 by asymptotic t approximation, n = 25 patients. Patients who received neoadjuvant PD-1 blockade (left) demonstrated significant relationships between multiple variables. (d) Scatter plot of the proportions of a peripheral cluster of intermediate monocytes (CD11b+CD11c+CD14+CD16+HLA-DRhi) at baseline and after 1-2 cycles of adjuvant therapy. The Y axis indicates percent of live mononuclear cells. n = 28 patients; Benjamini-Hochberg-corrected, two-sided P = 0.007 by general linear hypothesis test. (e) Scatter plot of selected cell surface markers on CD4+ T-cells before and after the first dose of pembrolizumab. Note the decreased PD-1 expression and increased CD152 (Benjamini-Hochberg corrected, two-sided P = 0.025 and 0.0015, respectively, general linear hypothesis test, n = 28 patients) in the neoadjuvant group (left). *: P < 0.05; **: P < 0.01; ns: non-significant; N+A: neoadjvant + adjuvant; A: adjuvant only.
Figure 5.
Figure 5.. Proposed mechanism of neoadjuvant PD-1 blockade in recurrent GBM.
Tumor infiltrating lymphocytes, if present, are rendered ineffective through the PD-1/PD-L1 axis. Neoadjuvant PD-1 blockade releases this checkpoint, enabling modulation of the T cell receptor (TCR) clonotypes with systemic activation and clonal selection of tumor-specific T cells. Such T cell activation in turn upregulates interferon-γ-related signaling, while downregulating tumor cell cycle related genes. After surgery, and with continued adjuvant anti-PD-1 monoclonal antibody administration, tumor-specific T cells continue to eliminate residual tumor cells and begin transitioning toward a T memory phenotype. In the adjuvant-only group, surgery occurs before checkpoint blockade release. Because of the reduced residual antigenic burden, TCR modulation is less robust and fewer tumor-specific T cells are activated. With fewer tumor-specific T cells, the remaining tumor cells are able to proliferate at a more rapid pace.

Comment in

References

    1. Ostrom QT, et al. CBTRUS Statistical Report: Primary brain and other central nervous system tumors diagnosed in the United States in 2010-2014. Neuro Oncol 19, v1–v88 (2017). - PMC - PubMed
    1. Stupp R, et al. Radiotherapy plus concomitant and adjuvant temozolomide for glioblastoma. N Engl J Med 352, 987–996 (2005). - PubMed
    1. Lamborn KR, et al. Progression-free survival: an important end point in evaluating therapy for recurrent high-grade gliomas. Neuro Oncol 10, 162–170 (2008). - PMC - PubMed
    1. Wu W, et al. Joint NCCTG and NABTC prognostic factors analysis for high-grade recurrent glioma. Neuro Oncol 12, 164–172 (2010). - PMC - PubMed
    1. Clarke JL, et al. Is surgery at progression a prognostic marker for improved 6-month progression-free survival or overall survival for patients with recurrent glioblastoma? Neuro Oncol 13, 1118–1124 (2011). - PMC - PubMed

Publication types

MeSH terms

Substances