

Assessment of Racial/Ethnic and Income Disparities in the Prescription of Opioids and Other Controlled Medications in California
- PMID: 30742196
- PMCID: PMC6450285
- DOI: 10.1001/jamainternmed.2018.6721
Assessment of Racial/Ethnic and Income Disparities in the Prescription of Opioids and Other Controlled Medications in California
Abstract
Importance: Most drug epidemics in the United States have disproportionately affected nonwhite communities. Notably, the current opioid epidemic is heavily concentrated among low-income white communities, and the roots of this racial/ethnic phenomenon have not been adequately explained.
Objective: To examine the degree to which differential exposure to opioids via the health care system by race/ethnicity and income could be driving the observed social gradient of the current opioid epidemic, as well as to compare the trends in the prevalence of prescription opioids with those observed for stimulants and benzodiazepines.
Design, setting, and participants: This population-based study used 2011 through 2015 records from California's prescription drug monitoring program (Controlled Substance Utilization Review and Evaluation System), which longitudinally tracks all patients receiving controlled substance prescriptions in the state and contained unique records for 29.7 million individuals who received such a prescription from 2011 to 2015. Data were analyzed between January and May 2018.
Exposures: A total of 1760 zip code tabulation areas (ZCTAs) in California, with associated racial/ethnic composition and per capita income.
Main outcomes and measures: The percentage of individuals receiving at least 1 prescription each year was calculated for opioids, benzodiazepines, and stimulants.
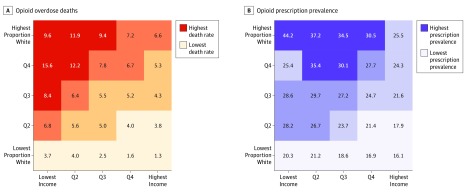
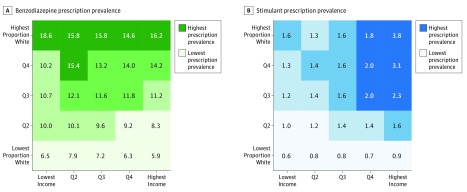
Results: A nearly 300% difference in opioid prescription prevalence across the race/ethnicity-income gradient was observed in California, with 44.2% of adults in the quintile of ZCTAs with the lowest-income/highest proportion-white population receiving at least 1 opioid prescription each year compared with 16.1% in the quintile with the highest-income/lowest proportion-white population and 23.6% of all individuals 15 years or older. Stimulant prescriptions were highly concentrated in mostly white high-income areas, with a prevalence of 3.8% among individuals in the quintile with the highest-income/highest proportion-white population and a prevalence of 0.6% in the quintile with the lowest-income/lowest proportion-white population. Benzodiazepine prescriptions did not have an income gradient but were concentrated in mostly white areas, with 15.7% of adults in the quintile of ZCTAs with the highest proportion-white population receiving at least 1 prescription each year compared with 7.0% among the quintile with the lowest proportion-white population.
Conclusions and relevance: The race/ethnicity and income pattern of opioid overdoses mirrored prescription rates, suggesting that differential exposure to opioids via the health care system may have induced the large, observed racial/ethnic gradient in the opioid epidemic. Across drug categories, controlled medications were much more likely to be prescribed to individuals living in majority-white areas. These discrepancies may have shielded nonwhite communities from the brunt of the prescription opioid epidemic but also represent disparities in treatment and access to all medications.
Conflict of interest statement
Figures
Comment in
- doi: 10.1001/jamainternmed.2018.7934
References
-
- Henry J Kaiser Family Foundation. Opioid overdose deaths by race/ethnicity. https://www.kff.org/other/state-indicator/opioid-overdose-deaths-by-race.... Published February 2018. Accessed December 29, 2018.
-
- Ruhm CJ. Deaths of Despair or Drug Problems? National Bureau of Economic Research; 2018. doi:10.3386/w24188 - DOI
