. 2019 Feb 11;15(2):e1006481.
doi: 10.1371/journal.pcbi.1006481. eCollection 2019 Feb.

How good are pathogenicity predictors in detecting benign variants?

Affiliations

How good are pathogenicity predictors in detecting benign variants?

Abhishek Niroula et al. PLoS Comput Biol. .

Abstract

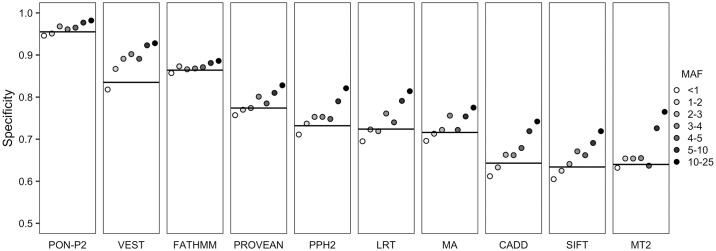
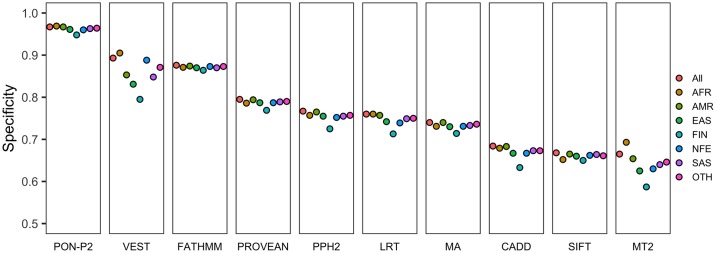
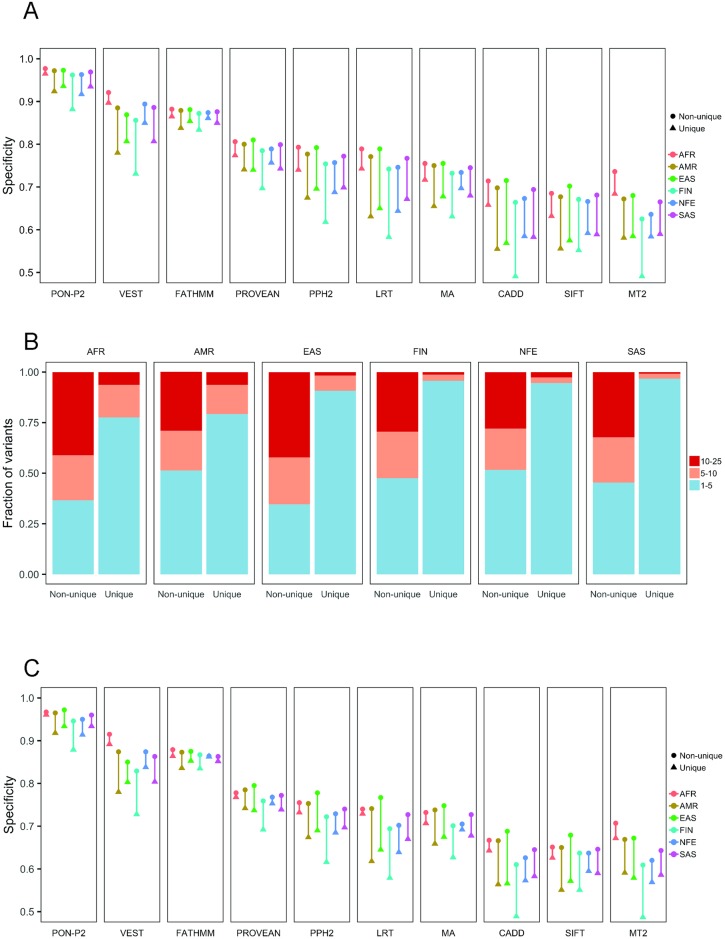
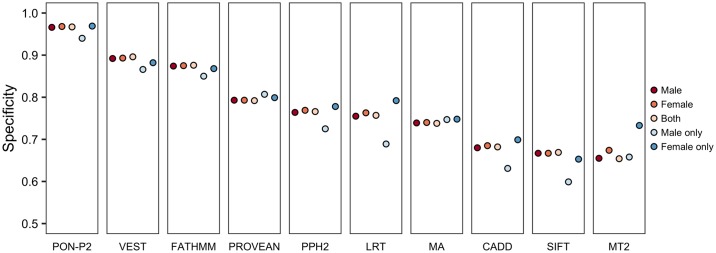
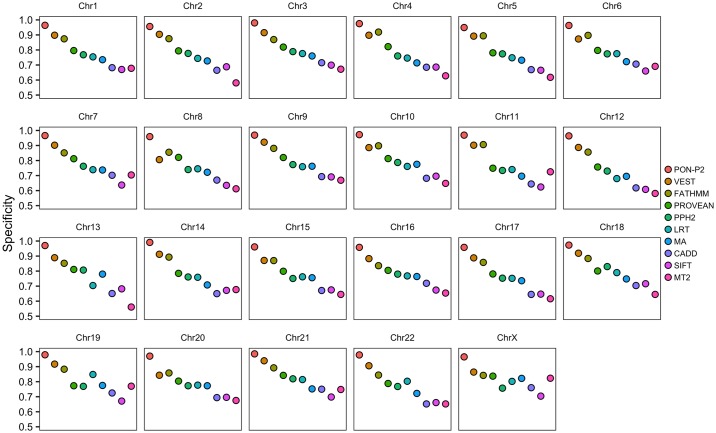
Computational tools are widely used for interpreting variants detected in sequencing projects. The choice of these tools is critical for reliable variant impact interpretation for precision medicine and should be based on systematic performance assessment. The performance of the methods varies widely in different performance assessments, for example due to the contents and sizes of test datasets. To address this issue, we obtained 63,160 common amino acid substitutions (allele frequency ≥1% and <25%) from the Exome Aggregation Consortium (ExAC) database, which contains variants from 60,706 genomes or exomes. We evaluated the specificity, the capability to detect benign variants, for 10 variant interpretation tools. In addition to overall specificity of the tools, we tested their performance for variants in six geographical populations. PON-P2 had the best performance (95.5%) followed by FATHMM (86.4%) and VEST (83.5%). While these tools had excellent performance, the poorest method predicted more than one third of the benign variants to be disease-causing. The results allow choosing reliable methods for benign variant interpretation, for both research and clinical purposes, as well as provide a benchmark for method developers.


Conflict of interest statement

The authors have declared that no competing interests exist.

Figures

Fig 1
Fig 1. Performance of variant tolerance predictors.
Specificities of 10 prediction tools for variants with different AFs. The black horizontal line indicates performance for all variants (AF ≥1% and <25%). The variants with AF <1% have low AF in the whole dataset but have higher AF in at least one of the populations. MA, MutationAssessor; MT2, MutationTaster2; PPH2, PolyPhen-2.
Fig 2
Fig 2. Performance of variant tolerance predictors for variants in ethnic groups.
Specificities of prediction tools for common variants (AF ≥1% and <25%) in different populations. AFR, African; AMR, American; EAS, East Asian; FIN, Finnish; NFE, Non-Finnish European; OTH, Other; SAS, South Asian; MA, MutationAssessor; MT2, MutationTaster2; PPH2, PolyPhen-2.
Fig 3
Fig 3. Analysis of unique and non-unique variants in populations.
(A) Performance of tools on unique and non-unique variants with different minor allele frequencies in different populations. AFR, African; AMR, American; EAS, East Asian; FIN, Finnish; NFE, Non-Finnish European; SAS, South Asian. The unique dataset contains variants with AF ≥1% and <25% in the specific population but <1% in all other populations and the non-unique dataset consists of the remaining variants. The differences are shown by the lines containing the values for each population. (B) Fractions of unique and non-unique variants in relation to AF. The colors for AF ranges are shown to the right. (C) Specificities of prediction tools on unique and non-unique variants (AF 1–5%) for each ancestry group. Unique variants have AF ≥1% in specific ancestry group but AF < 1% in all other ancestry groups. Non-unique variants have AF ≥1% in more than one ancestry groups.
Fig 4
Fig 4. Performance of variant tolerance predictors for variants in males and females.
Results are shown for all variants for males and females, both, as well as for unique variants in male (AF ≥1% in male but <1% in female) and female (AF ≥1% in female but <1% in male) populations.
Fig 5
Fig 5. Chromosome-wise performance of tools.
Variants in chromosome Y were excluded because there were only 3 variants. MA, Mutation Assessor; MT2, MutationTaster2; PPH2, PolyPhen-2.

References

    1. Abecasis GR, Altshuler D, Auton A, Brooks LD, Durbin RM, Gibbs RA, et al. A map of human genome variation from population-scale sequencing. Nature. 2010;467(7319):1061–1073. 10.1038/nature09534 - DOI - PMC - PubMed
    1. Landrum MJ, Lee JM, Benson M, Brown G, Chao C, Chitipiralla S, et al. ClinVar: public archive of interpretations of clinically relevant variants. Nucleic Acids Res. 2016;44(D1):D862–868. 10.1093/nar/gkv1222 - DOI - PMC - PubMed
    1. Amberger JS, Bocchini CA, Schiettecatte F, Scott AF, Hamosh A. OMIM.org: Online Mendelian Inheritance in Man (OMIM(R)), an online catalog of human genes and genetic disorders. Nucleic Acids Res. 2015;43(Database issue):D789–798. 10.1093/nar/gku1205 - DOI - PMC - PubMed
    1. The UniProt Consortium. UniProt: the universal protein knowledgebase. Nucleic Acids Res. 2017;45(Database issue):D158–D169. 10.1093/nar/gkw1099 - DOI - PMC - PubMed
    1. Sherry ST, Ward MH, Kholodov M, Baker J, Phan L, Smigielski EM, et al. dbSNP: the NCBI database of genetic variation. Nucleic Acids Res. 2001;29(1):308–311. - PMC - PubMed

Publication types