Comparative Study
. 2019:22:101713.
doi: 10.1016/j.nicl.2019.101713. Epub 2019 Feb 4.

Hypercapnic BOLD MRI compared to H215O PET/CT for the hemodynamic evaluation of patients with Moyamoya Disease

Affiliations
Comparative Study

Hypercapnic BOLD MRI compared to H215O PET/CT for the hemodynamic evaluation of patients with Moyamoya Disease

Till-Karsten Hauser et al. Neuroimage Clin. 2019.

Abstract

Background and purpose: Patients with Moyamoya Disease (MMD) need hemodynamic evaluation of vascular territories at risk of stroke. Today's investigative standards include H215O PET/CT with pharmacological challenges with acetazolamide (ACZ). Recent developments suggest that CO2-triggered blood‑oxygen-level-dependent (BOLD) functional MRI might provide comparable results to current standard methods for evaluation of territorial hemodynamics, while being a more widely available and easily implementable method. This study examines results of a newly developed quantifiable analysis algorithm for CO2-triggered BOLD MRI in Moyamoya patients and correlates the results with H215O PET/CT with ACZ challenge to assess comparability between both modalities.

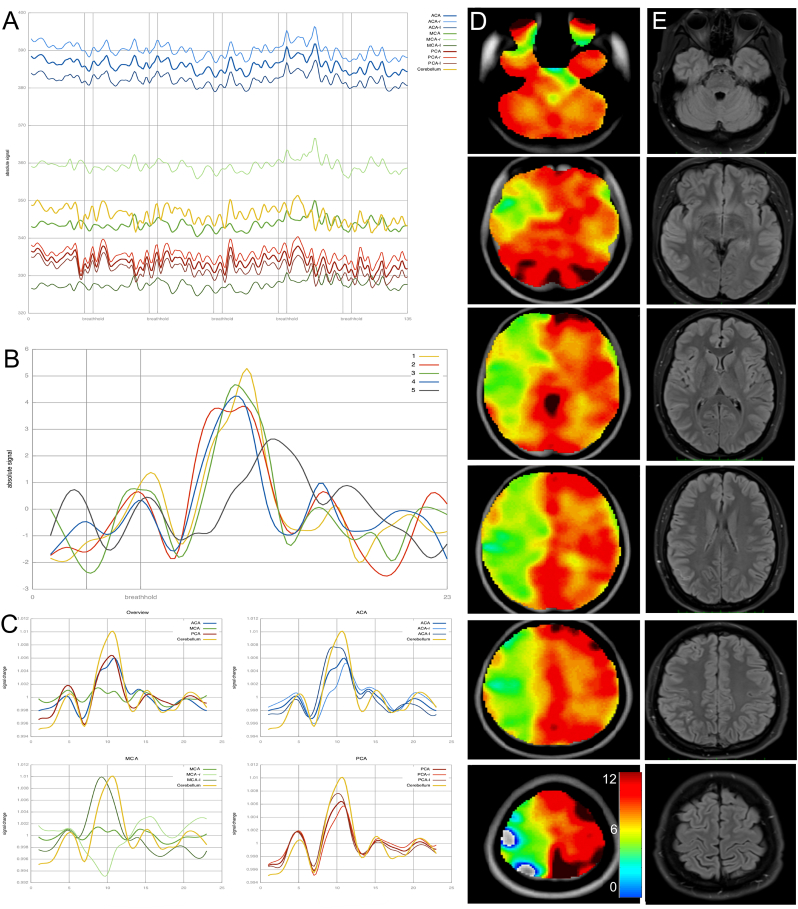
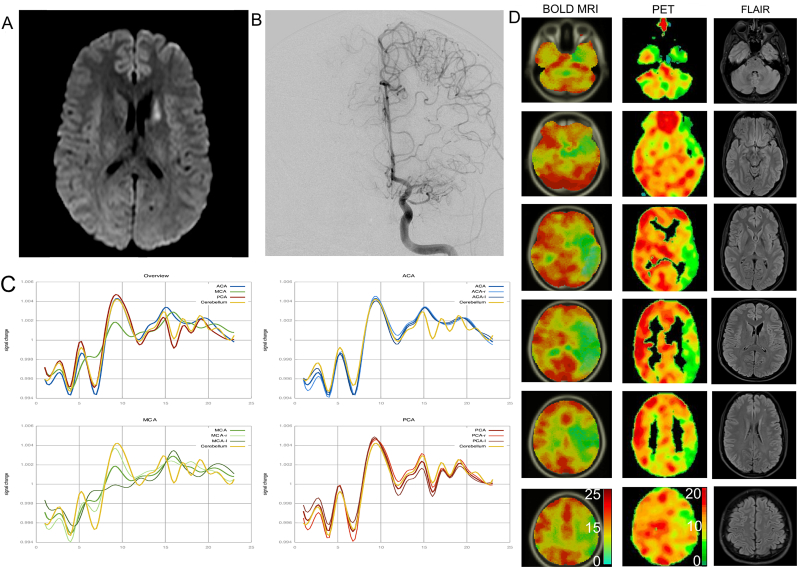
Methods: CO2-triggered BOLD MRI was performed and compared to H215O PET/CT with ACZ challenge in patients with angiographically proven MMD. Images of both modalities were analyzed retrospectively in a blinded, standardized fashion by visual inspection, as well as with a semi-quantitative analysis using stimuli-induced approximated regional perfusion-weighted data and BOLD-signal changes with reference to cerebellum.

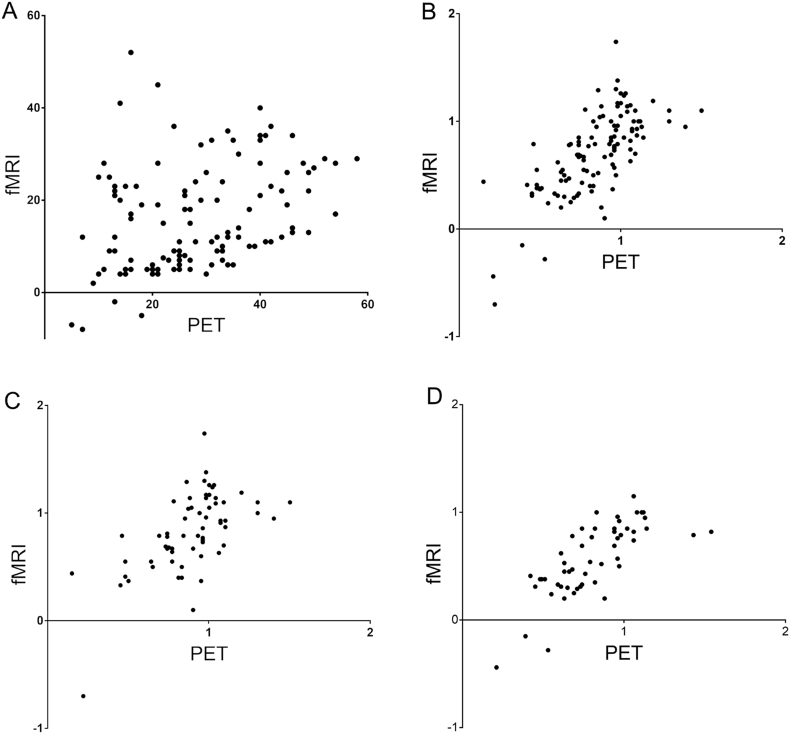
Results: 20 consecutive patients fulfilled the inclusion criteria, a total of 160 vascular territories were analyzed retrospectively. Visual analysis (4-step visual rating system) of standardized, color-coded cerebrovascular reserve/reactivity maps showed a very strong correlation (Spearman's rho = 0.9, P < 0.001) between both modalities. Likewise, comparison of approximated regional perfusion changes across vascular territories (normalized to cerebellar change) reveal a highly significant correlation between both methods (Pearson's r = 0.71, P < 0.001).

Conclusions: The present analysis indicates that CO2-triggered BOLD MRI is a very promising tool for the hemodynamic evaluation of MMD patients with results comparable to those seen in H215O PET/CT with ACZ challenge. It therefore holds future potential in becoming a routine examination in the pre- and postoperative evaluation of MMD patients after further prospective evaluation.

Keywords: BOLD MRI; Cerebrovascular reserve; Moyamoya; PET/CT.


Figures

Fig. 1
Fig. 1
A) Plot of mean signal intensities in all evaluated regions over the course of the whole fMRI measurement. Vertical lines show the breath-hold time periods of 9 s each. B) Shows response curves of the cerebellum as a reference. In this case, the fifth cycle (grey color) shows a markedly different response curve suggestive of poor patient compliance in this cycle. For further analysis this cycle was excluded. C) Peristimulus histograms (PSTH) showing breath hold related signal increase in the ACA (blue), MCA (green) and PCA (red) territories compared to the reference curve of the cerebellum (yellow). Top left shows an overview with mean curves representing the ACA, MCA and PCA signals of both hemispheres. This patient with unilateral involvement of Moyamoya angiopathy shows nearly normal response curves in the left MCA, whereas there is a negative curve amplitude in the right sided MCA territory, indicating flow reduction during breath hold- induced vessel dilatation. D) CVR maps of breath-hold BOLD MRI indicating the above-mentioned vascular deficits. Values for the color-scale resemble the integral of the relative signal change of BOLD MRI. E) Corresponding FLAIR images. (For interpretation of the references to color in this figure legend, the reader is referred to the web version of this article.)
Fig. 2
Fig. 2
Plots showing the correlation of all signal changes for PET (x-axis) and fMRI (y-axis). A) shows the correlation of absolute values of signal change showing a weak, but significant correlation (r = 0.35, p = 0.001). B–D) shows values calculated as the quotient of absolute values in the respective vascular territories and signal of the cerebellum with strong correlation. B) depicts territories of all patients (r = 0.71, p < 0.001), C) of all patients with preoperative (r = 0.61, p < 0.001) and D) of all patients with postoperative imaging (r = 0.76, p < 0.001).
Fig. 3
Fig. 3
Exemplary case of a patient with unilateral Moyamoya Angiopathy symptomatic by an infarction in the caudate nucleus (A). Cerebral angiography (B) shows an occlusion of the left MCA with surrounding fine Moyamoya collaterals. C) shows the PSTH of all curves as a mean (top left), as well ACA (blue), MCA (green) and PCA (red) for the respective hemispheres. Significant decrease of vasoreactivity can be seen isolated in the left MCA territory. D) shows the standardized color-coded maps of signal change of breath-hold BOLD MRI (left column) in comparison to H215O PET/CT (middle column) signal change between baseline and after ACZ administration. Values for the color-scale resemble the integral of the relative signal change of BOLD MRI and absolute signal change (%) of PET. Despite slight differences in the color-scale and slice direction between both modalities, high correlation of both techniques can be seen. Right column shows corresponding FLAIR images. This patient was treated successfully by direct STA-MCA revascularization.

References

    1. Acker G., Lange C., Schatka I., Pfeifer A., Czabanka M.A., Vajkoczy P. Brain perfusion imaging under acetazolamide challenge for detection of impaired cerebrovascular reserve capacity: positive findings with 15o-water pet in patients with negative 99mtc-hmpao spect findings. J. Nucl. Med. 2018;59:294–298. - PubMed
    1. Arigoni M., Kneifel S., Fandino J., Khan N., Burger C., Buck A. Simplified quantitative determination of cerebral perfusion reserve with h 2 15 o pet and acetazolamide. Eur. J. Nucl. Med. Mol. Imaging. 2000;27:1557–1563. - PubMed
    1. Bright M.G., Murphy K. Reliable quantification of bold fmri cerebrovascular reactivity despite poor breath-hold performance. NeuroImage. 2013;83:559–568. - PMC - PubMed
    1. Diedrichsen J. A spatially unbiased atlas template of the human cerebellum. NeuroImage. 2006;33:127–138. - PubMed
    1. Dlamini N., Shah-Basak P., Leung J., Kirkham F., Shroff M., Kassner A. Breath-hold blood oxygen level–dependent mri: a tool for the assessment of cerebrovascular reserve in children with moyamoya disease. Am. J. Neuroradiol. 2018;39:1717–1723. - PMC - PubMed

Publication types